| Param | Original file | Final file |
|---|---|---|
| Filename | modeM0/AS1A04_022T04_9000001746_11815cztM0_level2.evt | modeM0/AS1A04_022T04_9000001746_11815cztM0_level2_quad_clean.evt |
| Size (bytes) | 584,665,920 | 88,260,480 |
| Size | 557.6 MB | 84.2 MB |
| Events in quadrant A | 3,787,087 | 538,368 |
| Events in quadrant B | 4,844,109 | 532,576 |
| Events in quadrant C | 3,571,054 | 546,882 |
| Events in quadrant D | 4,974,515 | 511,602 |
| Mode SS | |||
|---|---|---|---|
| Quadrant | BADHDUFLAG | Total packets | Discarded packets |
| A | 0 | 156 | 0 |
| B | 0 | 156 | 0 |
| C | 0 | 156 | 0 |
| D | 0 | 156 | 0 |
| Mode M9 | |||
|---|---|---|---|
| Quadrant | BADHDUFLAG | Total packets | Discarded packets |
| A | 0 | 4 | 0 |
| B | 0 | 4 | 0 |
| C | 0 | 4 | 0 |
| D | 0 | 4 | 0 |
| Mode M0 | |||
|---|---|---|---|
| Quadrant | BADHDUFLAG | Total packets | Discarded packets |
| A | 0 | 16494 | 3 |
| B | 0 | 19470 | 2 |
| C | 0 | 16140 | 2 |
| D | 0 | 20075 | 2 |
| Quadrant | Total seconds | Saturated seconds | Saturation percentage |
|---|---|---|---|
| A | 7810 | 267 | 3.418694% |
| B | 7810 | 450 | 5.761844% |
| C | 7810 | 110 | 1.408451% |
| D | 7810 | 347 | 4.443022% |
Noise dominated data is calculated using 1-second bins in cleaned event files. If a bin has >2000 counts, and if more than 50% of those come from <1% of pixels, then it is considered to be noise-dominated and hence unusable.
| Quadrant | # 1 sec bins | Bins with >0 counts | Bins with >2000 counts | High rate bins dominated by noise | Noise dominated (total time) | Noise dominated (detector-on time) | Marked lightcurve |
|---|---|---|---|---|---|---|---|
| A | 7826 | 7812 | 0 | 0 | 0.00% | 0.00% | 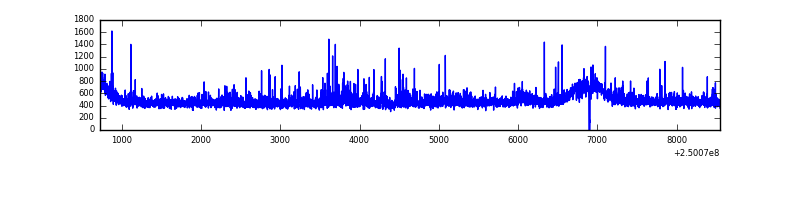 |
| B | 7826 | 7812 | 126 | 126 | 1.61% | 1.61% | 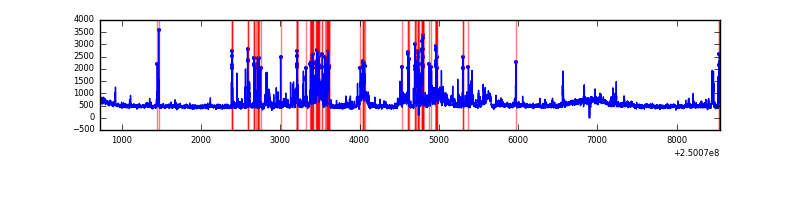 |
| C | 7826 | 7812 | 0 | 0 | 0.00% | 0.00% |  |
| D | 7826 | 7812 | 217 | 217 | 2.77% | 2.78% | 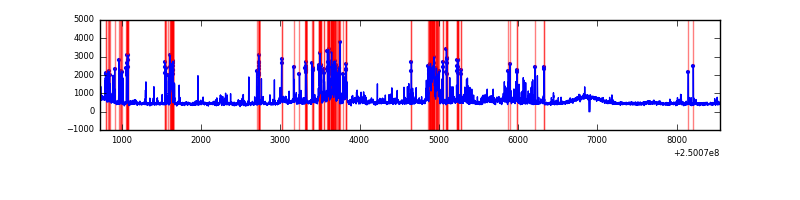 |
Top three noisy pixels from each quadrant. If the there are fewer than three noisy pixels in the level2.evt file, extra rows are filled as -1
| Pixel properties | Quadrant properties | ||||||
|---|---|---|---|---|---|---|---|
| Quadrant | DetID | PixID | Counts | Sigma | Mean | Median | Sigma |
| A | 1 | 162 | 88609 | 461.87 | 927 | 906 | 189.9 |
| A | 1 | 178 | 43788 | 225.83 | 927 | 906 | 189.9 |
| A | 1 | 161 | 39051 | 200.88 | 927 | 906 | 189.9 |
| B | 4 | 239 | 659234 | 3747.68 | 924 | 897 | 175.7 |
| B | 10 | 16 | 300284 | 1704.3 | 924 | 897 | 175.7 |
| B | 3 | 64 | 121641 | 687.35 | 924 | 897 | 175.7 |
| C | 8 | 128 | 10621 | 45.8 | 909 | 911 | 212.0 |
| C | 8 | 112 | 6996 | 28.7 | 909 | 911 | 212.0 |
| C | 13 | 61 | 6893 | 28.22 | 909 | 911 | 212.0 |
| D | 1 | 52 | 698700 | 3185.29 | 898 | 868 | 219.1 |
| D | 12 | 17 | 228382 | 1038.5 | 898 | 868 | 219.1 |
| D | 8 | 195 | 154691 | 702.13 | 898 | 868 | 219.1 |
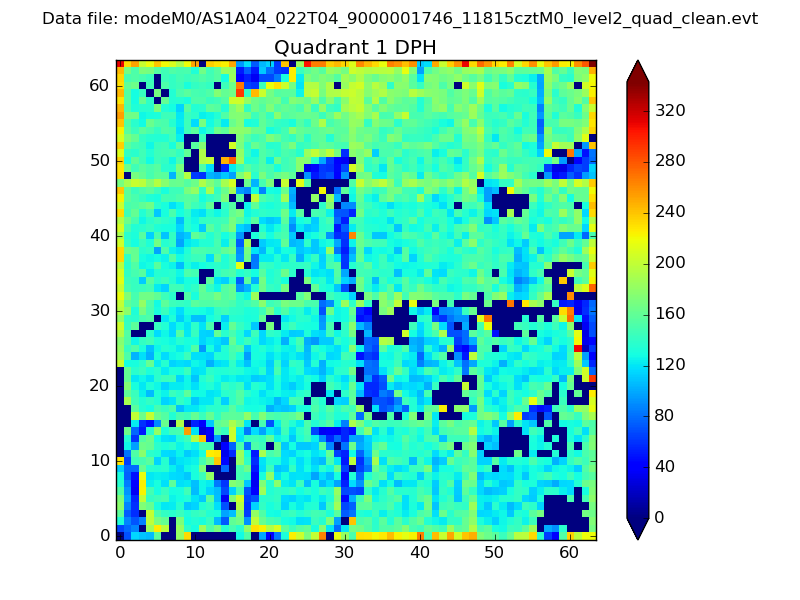
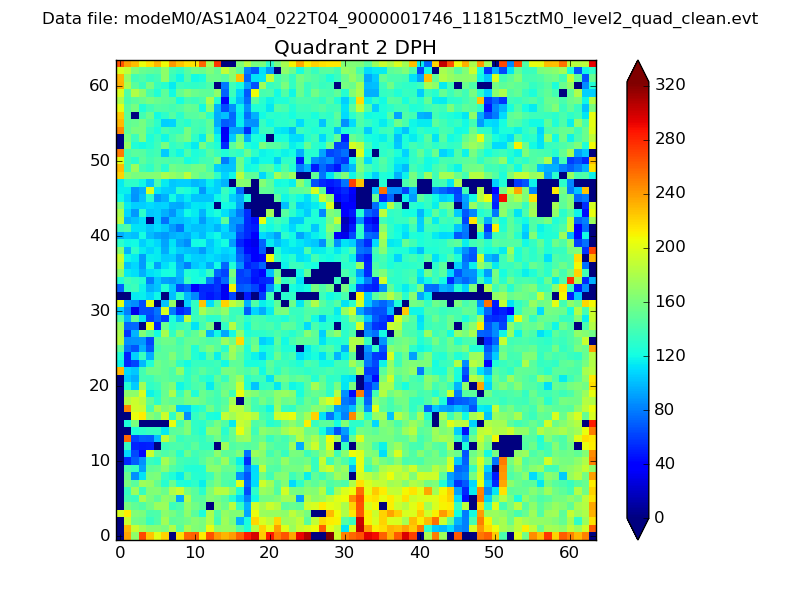
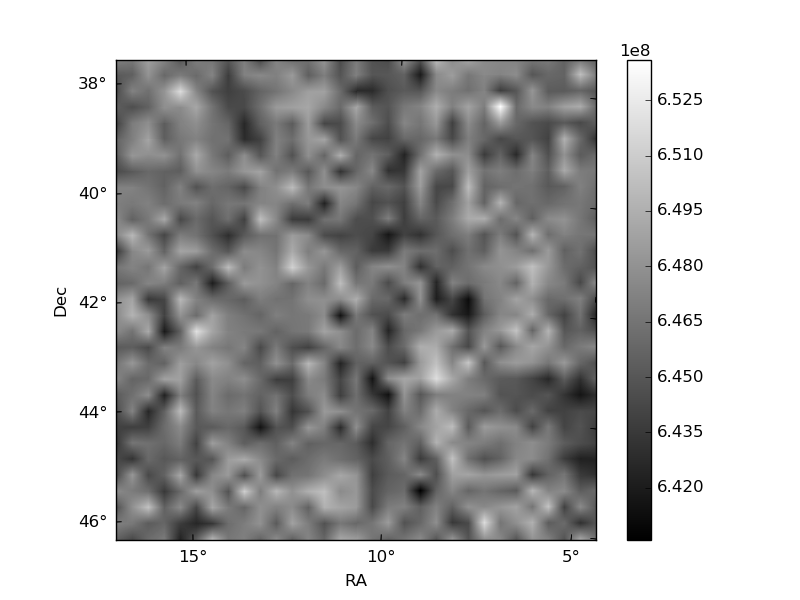
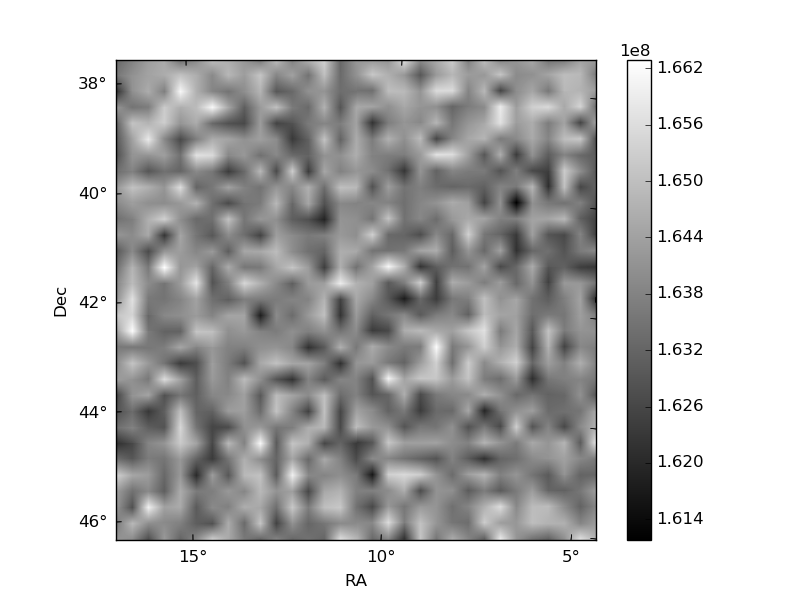
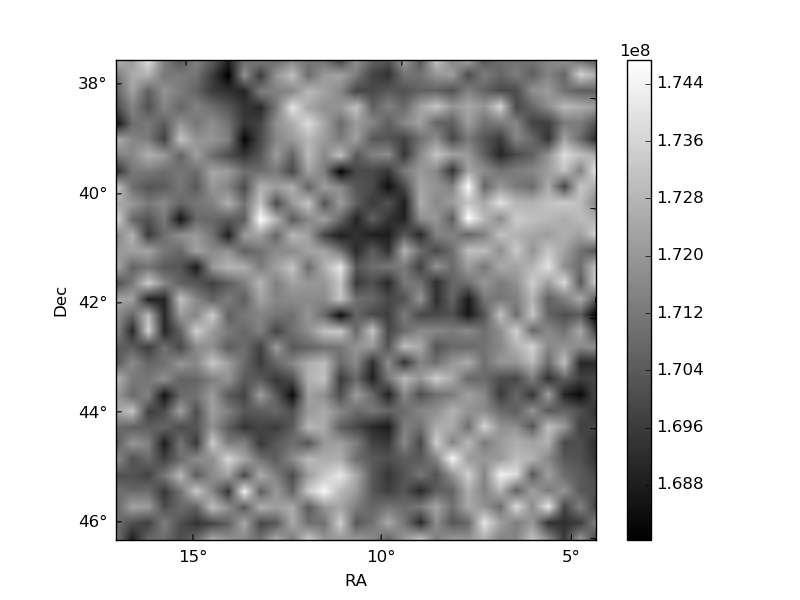
Histogram calculated using DETX and DETY for each event in the final _common_clean file
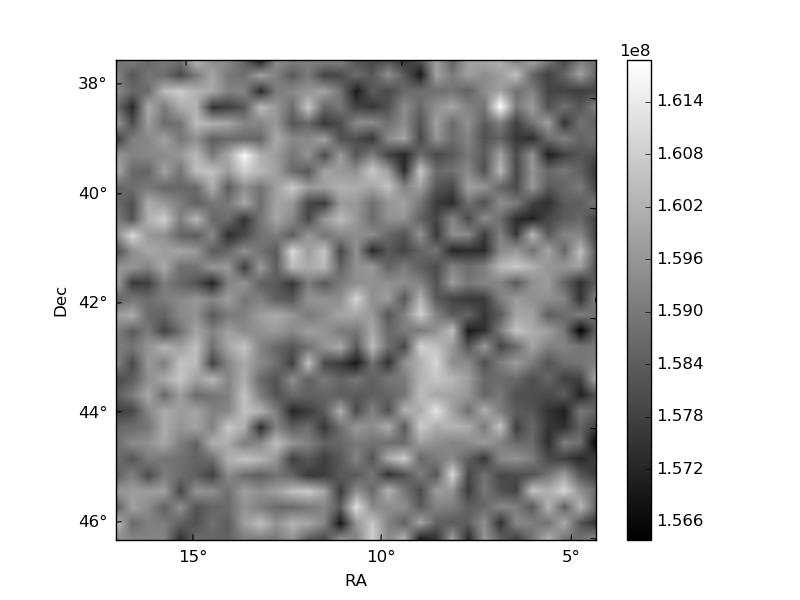
| Quadrant A | 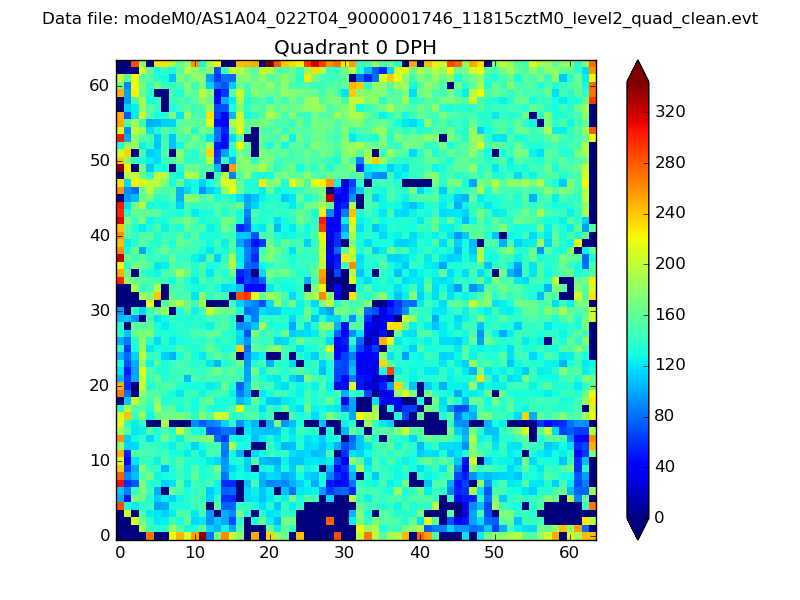 |
 |
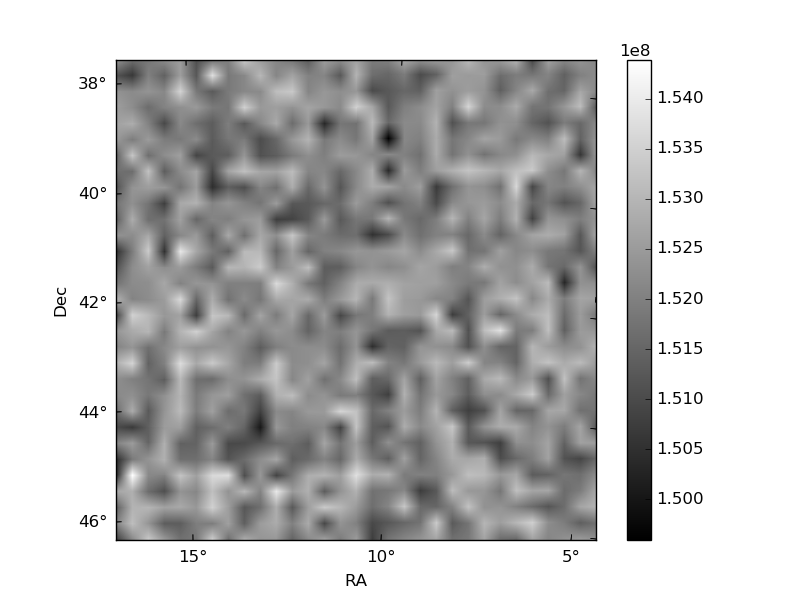
Quadrant B |
|---|---|---|---|
| Quadrant D | 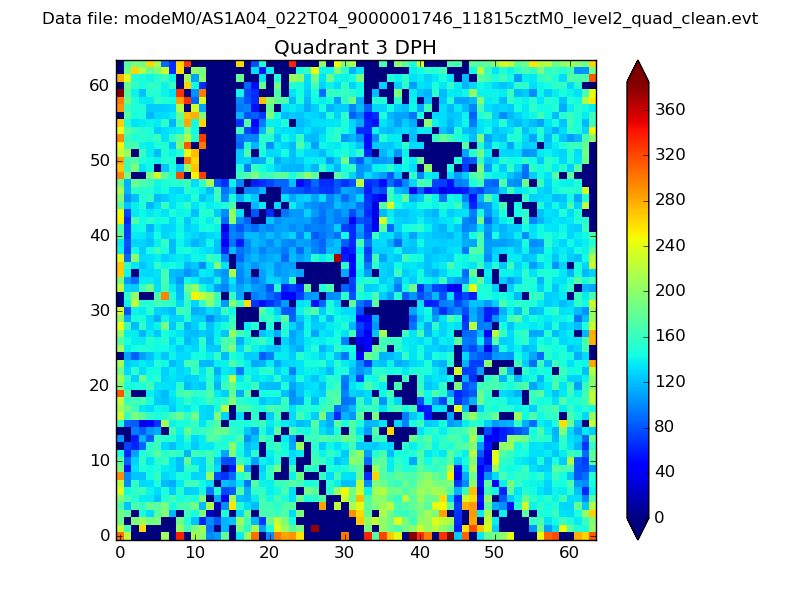 |
 |
Quadrant C |
| Plot type | Count rate plots | Images |
|---|---|---|
| Comparison with Poisson distribution Blue bars denote a histogram of data divided into 1 sec bins. Red curve is a Poisson curve with rate = median count rate of data. |
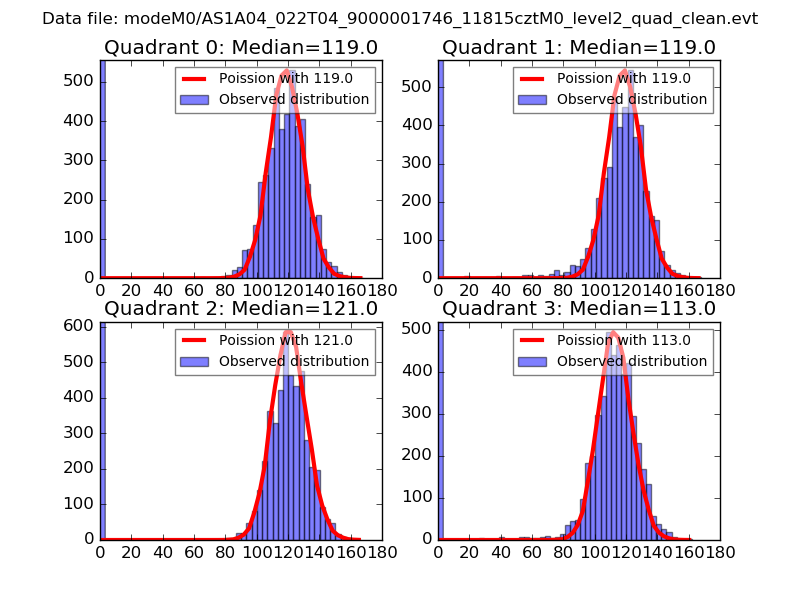 |
 |
| Quadrant-wise count rates Data is divided into 100 sec bins |
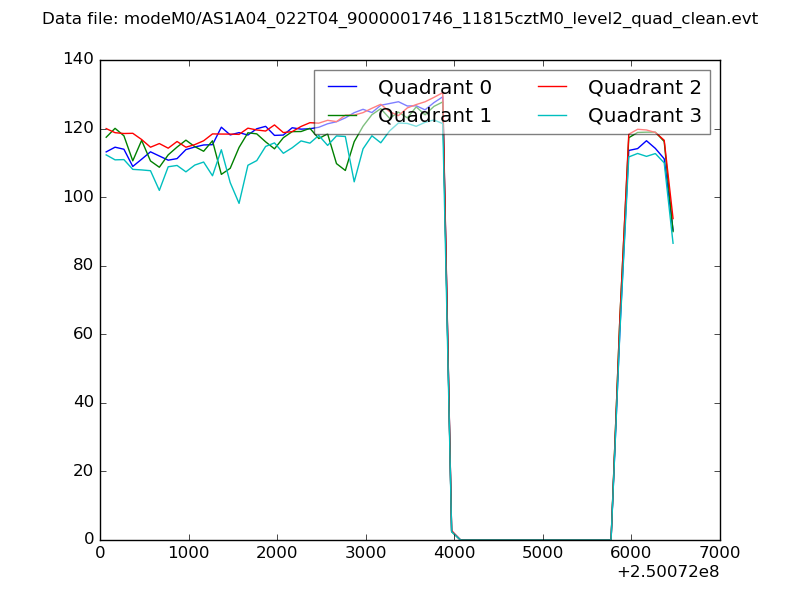 |
|
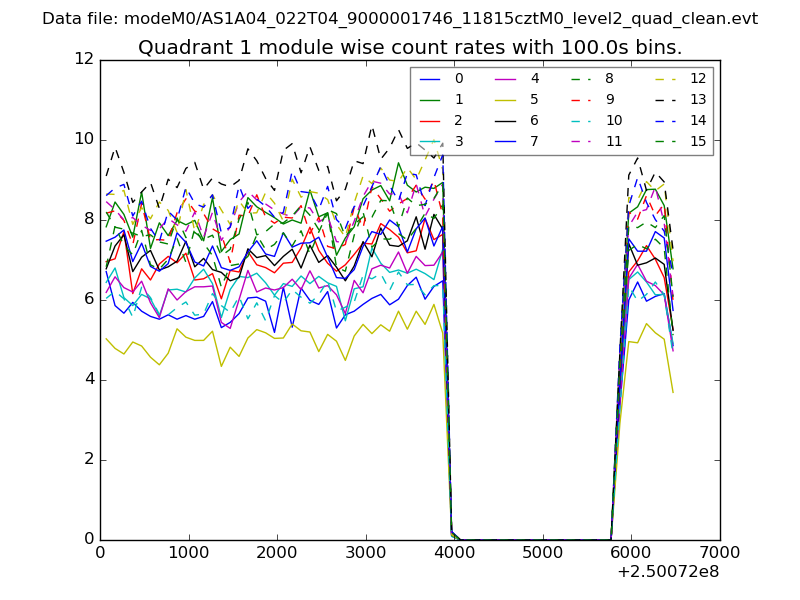
| Module-wise count rates for Quadrant A Data is divided into 100 sec bins |
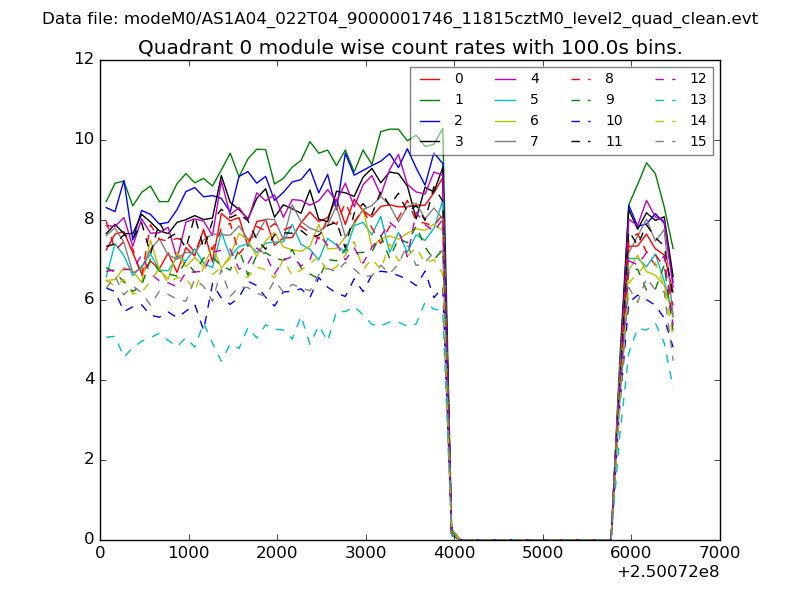 |
 |
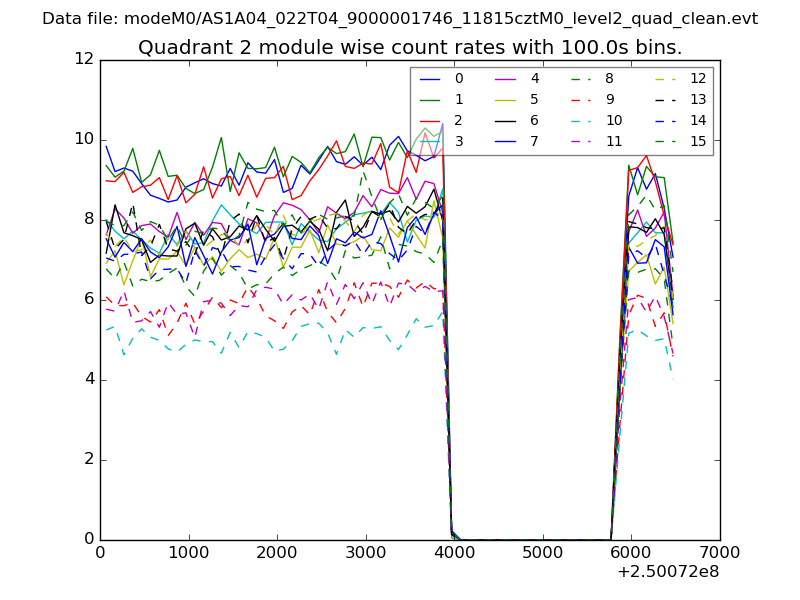
| Module-wise count rates for Quadrant B Data is divided into 100 sec bins |
 |
 |
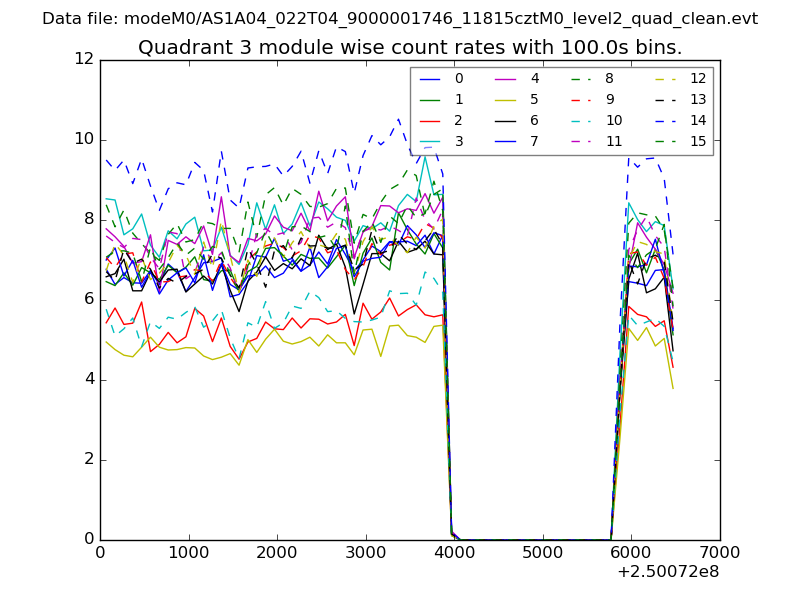
| Module-wise count rates for Quadrant C Data is divided into 100 sec bins |
 |
 |
| Module-wise count rates for Quadrant D Data is divided into 100 sec bins |
 |
 |
| Parameter | Plot |
|---|---|
| CZT HV Monitor | 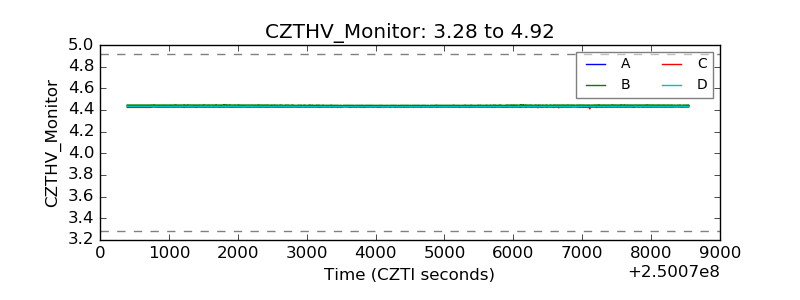 |
| D_VDD | 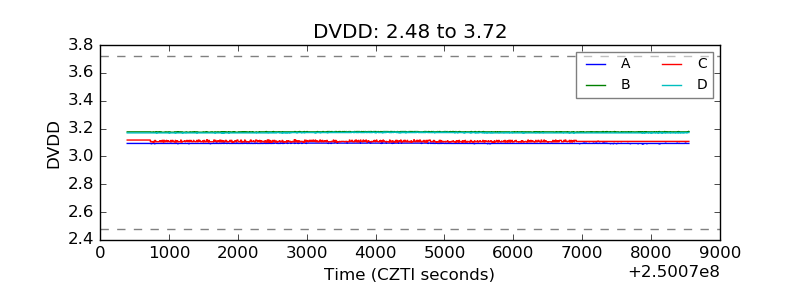 |
| Temperature 1 | 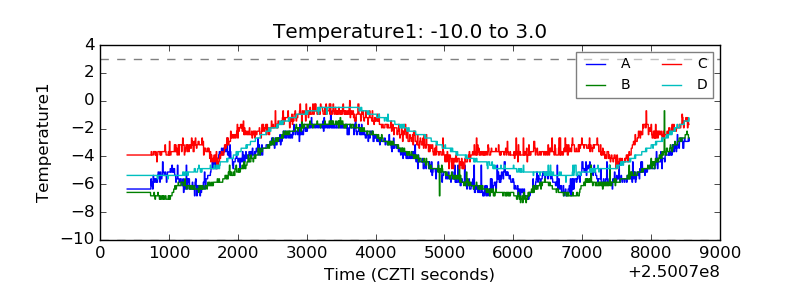 |
| Veto HV Monitor | 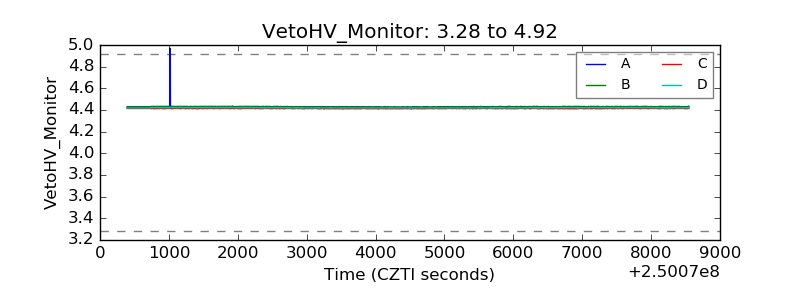 |
| Veto LLD | 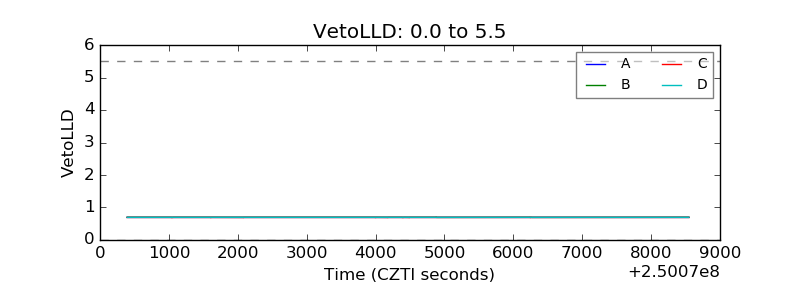 |
| Alpha Counter | 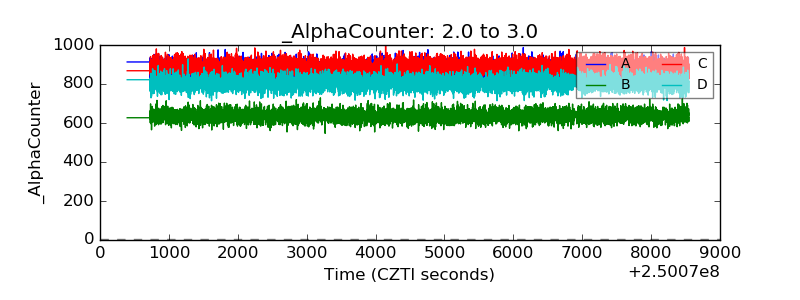 |
| _CPM_Rate | 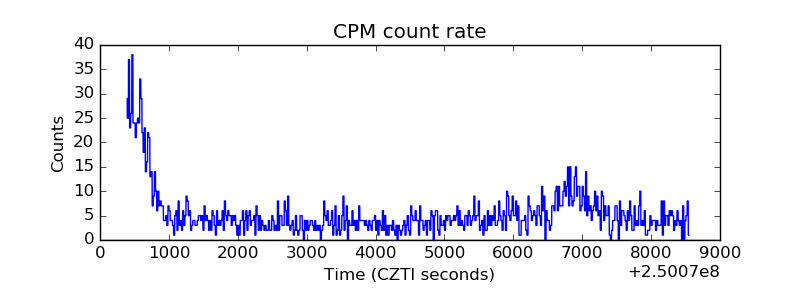 |
| CZT Counter | 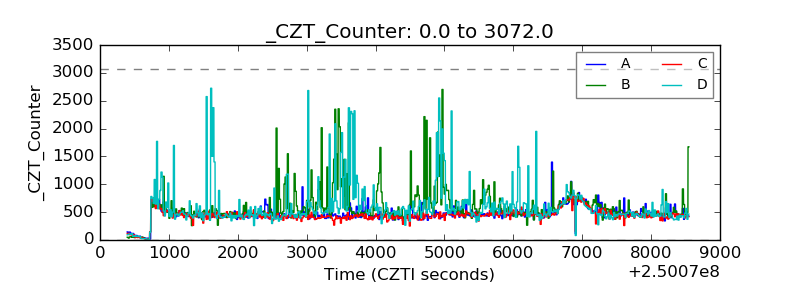 |
| +2.5 Volts monitor |  |
| +5 Volts monitor |  |
| _ROLL_ROT | 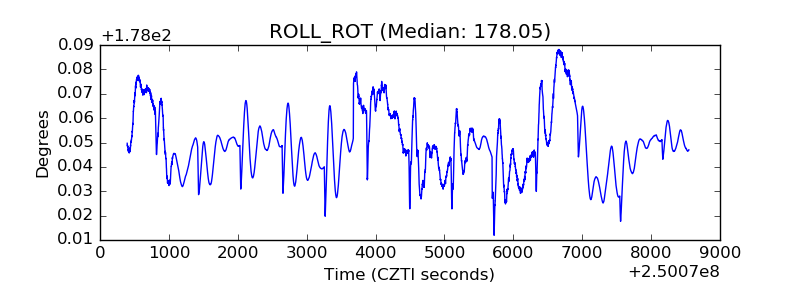 |
| _Roll_DEC | 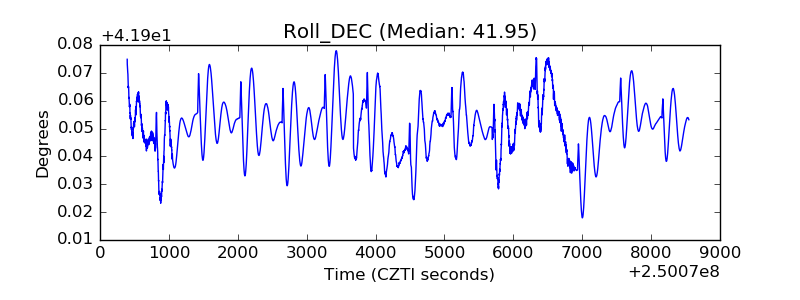 |
| _Roll_RA | 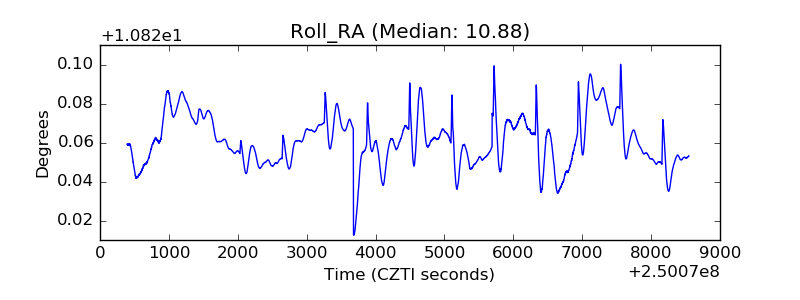 |
| Veto Counter | 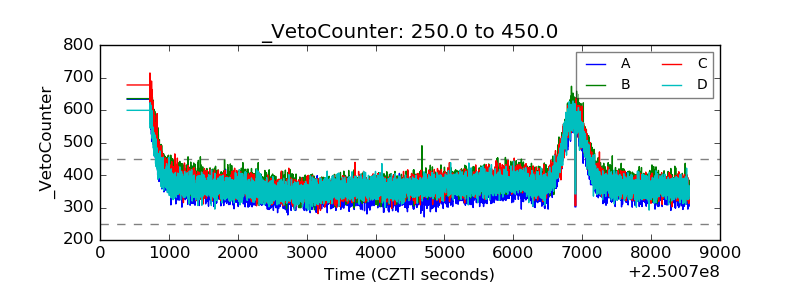 |