| Param | Original file | Final file |
|---|---|---|
| Filename | modeM0/AS1A04_022T04_9000001746_11816cztM0_level2.evt | modeM0/AS1A04_022T04_9000001746_11816cztM0_level2_quad_clean.evt |
| Size (bytes) | 580,006,080 | 94,389,120 |
| Size | 553.1 MB | 90.0 MB |
| Events in quadrant A | 3,569,837 | 589,561 |
| Events in quadrant B | 6,075,308 | 580,636 |
| Events in quadrant C | 3,359,636 | 600,648 |
| Events in quadrant D | 4,057,635 | 571,291 |
| Mode SS | |||
|---|---|---|---|
| Quadrant | BADHDUFLAG | Total packets | Discarded packets |
| A | 0 | 150 | 0 |
| B | 0 | 150 | 0 |
| C | 0 | 150 | 0 |
| D | 0 | 150 | 0 |
| Mode M0 | |||
|---|---|---|---|
| Quadrant | BADHDUFLAG | Total packets | Discarded packets |
| A | 0 | 15541 | 2 |
| B | 0 | 23073 | 1 |
| C | 0 | 15255 | 1 |
| D | 0 | 16991 | 1 |
| Quadrant | Total seconds | Saturated seconds | Saturation percentage |
|---|---|---|---|
| A | 7410 | 258 | 3.481781% |
| B | 7410 | 727 | 9.811066% |
| C | 7410 | 155 | 2.091768% |
| D | 7410 | 257 | 3.468286% |
Noise dominated data is calculated using 1-second bins in cleaned event files. If a bin has >2000 counts, and if more than 50% of those come from <1% of pixels, then it is considered to be noise-dominated and hence unusable.
| Quadrant | # 1 sec bins | Bins with >0 counts | Bins with >2000 counts | High rate bins dominated by noise | Noise dominated (total time) | Noise dominated (detector-on time) | Marked lightcurve |
|---|---|---|---|---|---|---|---|
| A | 7456 | 7412 | 0 | 0 | 0.00% | 0.00% | 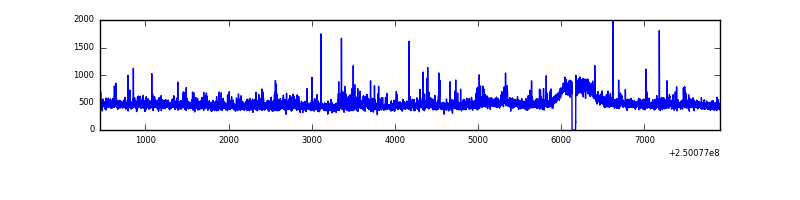 |
| B | 7456 | 7412 | 301 | 301 | 4.04% | 4.06% | 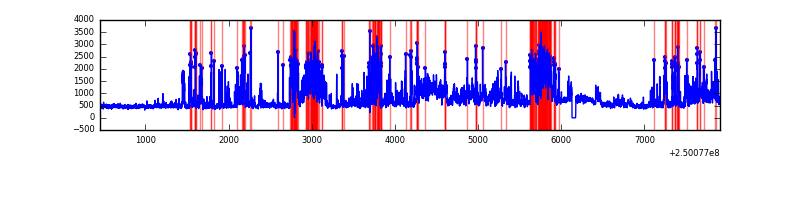 |
| C | 7456 | 7412 | 1 | 1 | 0.01% | 0.01% | 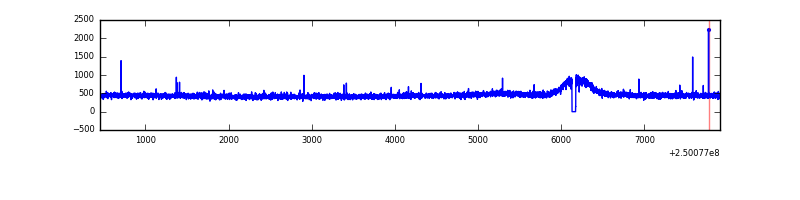 |
| D | 7456 | 7412 | 61 | 61 | 0.82% | 0.82% | 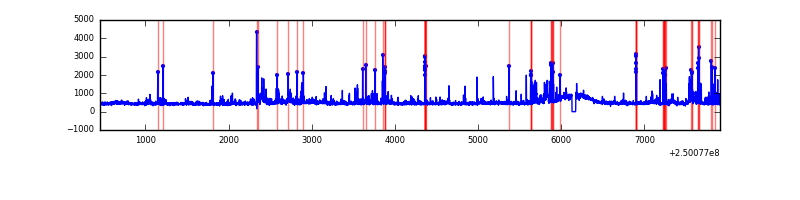 |
Top three noisy pixels from each quadrant. If the there are fewer than three noisy pixels in the level2.evt file, extra rows are filled as -1
| Pixel properties | Quadrant properties | ||||||
|---|---|---|---|---|---|---|---|
| Quadrant | DetID | PixID | Counts | Sigma | Mean | Median | Sigma |
| A | 1 | 162 | 75137 | 409.95 | 877 | 858 | 181.2 |
| A | 1 | 178 | 37525 | 202.37 | 877 | 858 | 181.2 |
| A | 1 | 161 | 33006 | 177.42 | 877 | 858 | 181.2 |
| B | 4 | 239 | 1047985 | 6345.17 | 860 | 835 | 165.0 |
| B | 10 | 16 | 1008663 | 6106.9 | 860 | 835 | 165.0 |
| B | 3 | 64 | 544911 | 3296.81 | 860 | 835 | 165.0 |
| C | 8 | 208 | 8489 | 38.22 | 857 | 858 | 199.7 |
| C | 13 | 61 | 6458 | 28.05 | 857 | 858 | 199.7 |
| C | 14 | 234 | 2933 | 10.39 | 857 | 858 | 199.7 |
| D | 1 | 52 | 410871 | 1978.37 | 854 | 826 | 207.3 |
| D | 13 | 104 | 100456 | 480.69 | 854 | 826 | 207.3 |
| D | 8 | 195 | 82812 | 395.56 | 854 | 826 | 207.3 |
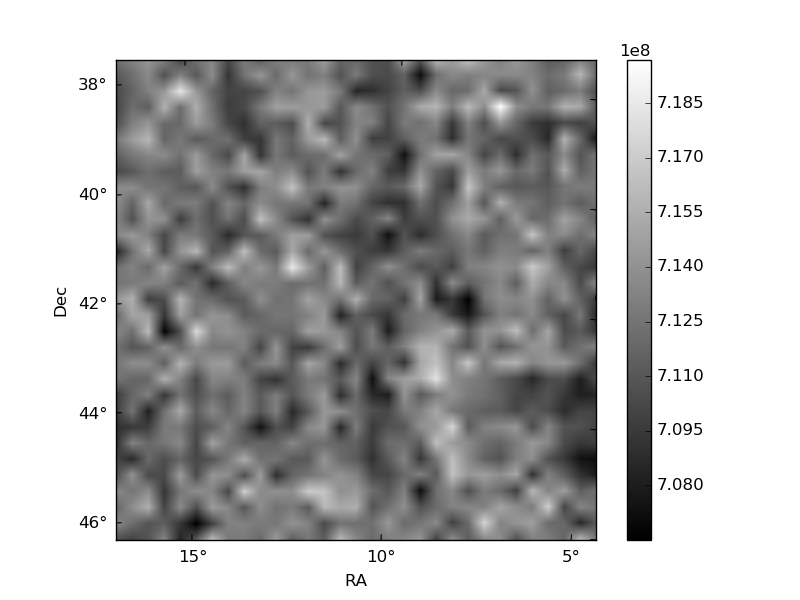
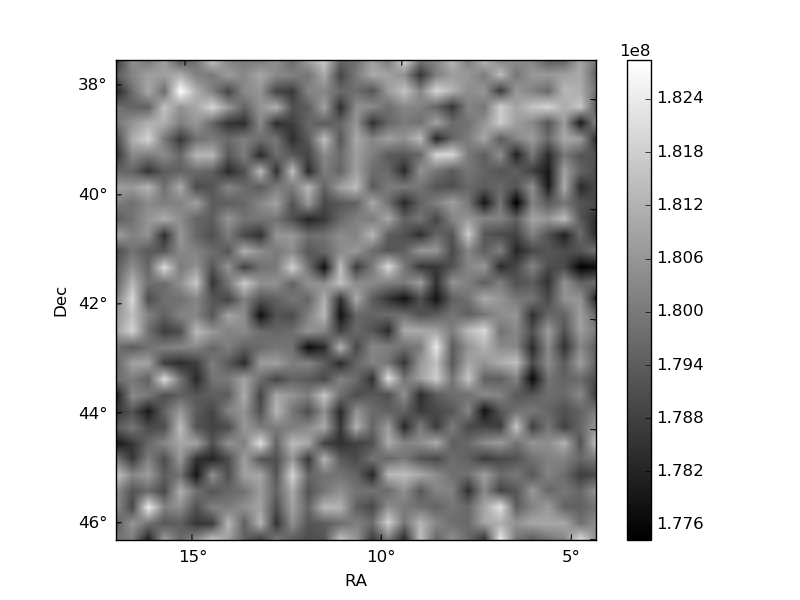
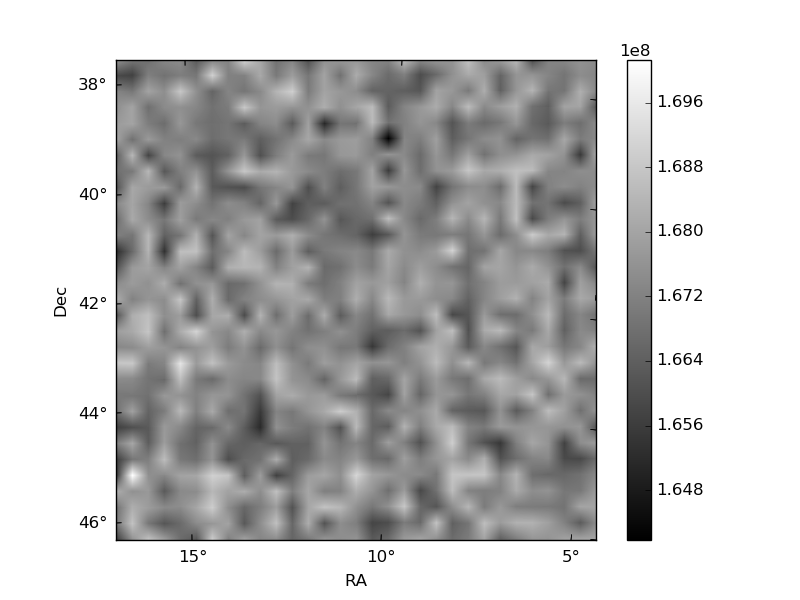
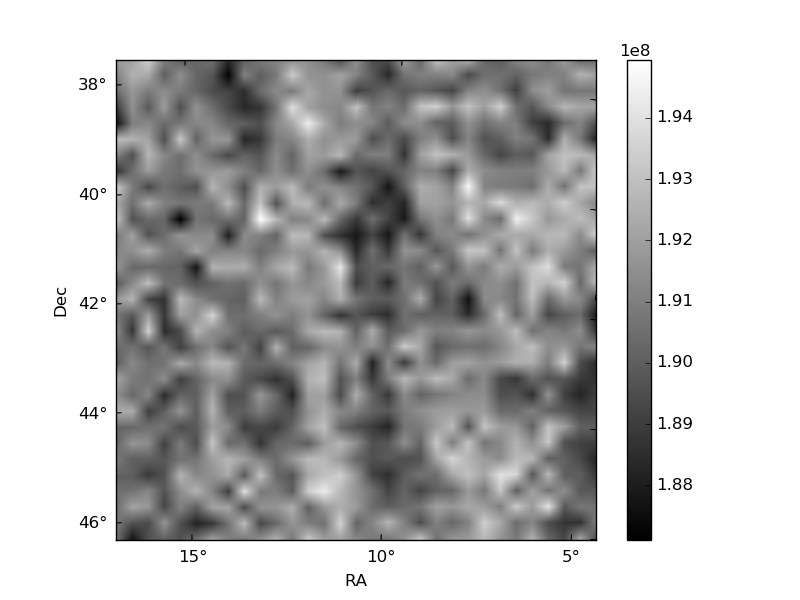
Histogram calculated using DETX and DETY for each event in the final _common_clean file
| Quadrant A | 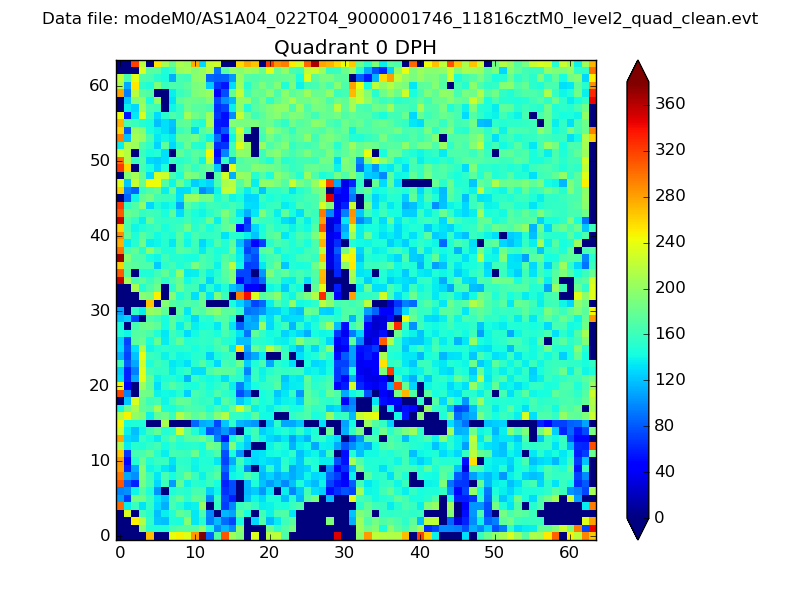 |
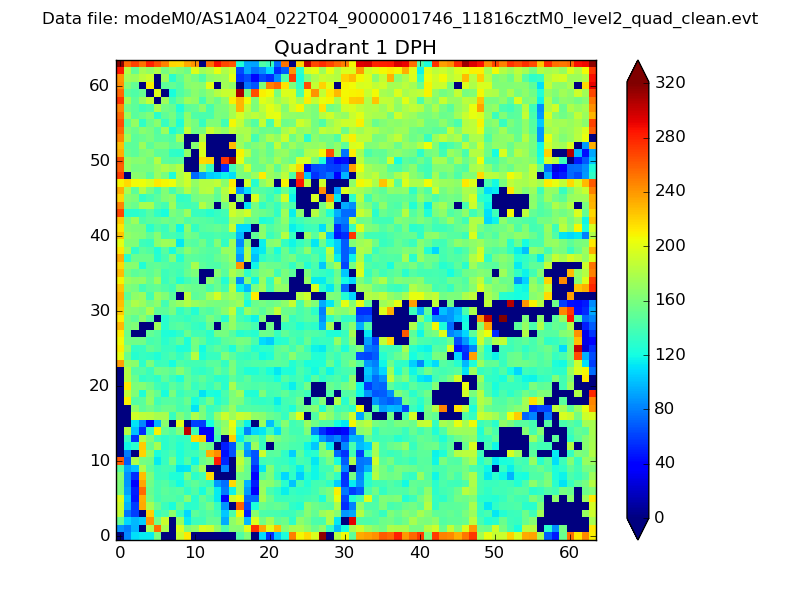 |
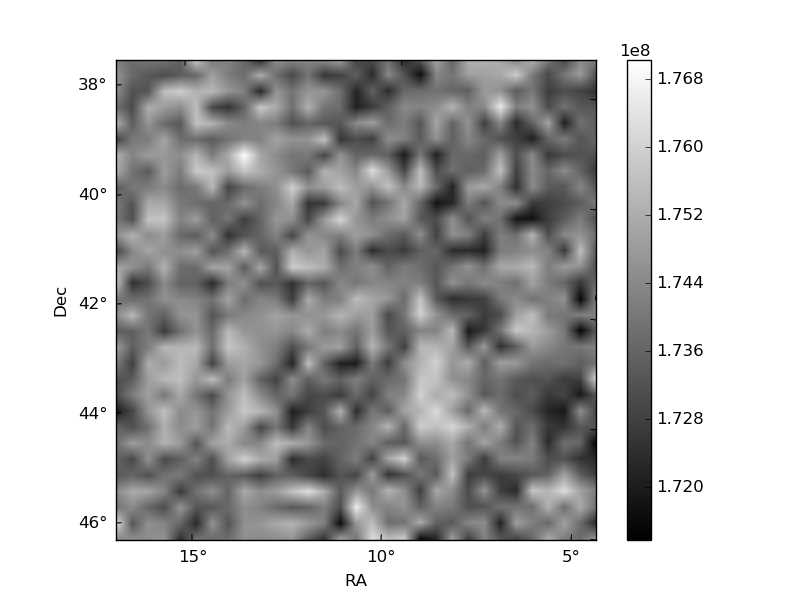
Quadrant B |
|---|---|---|---|
| Quadrant D | 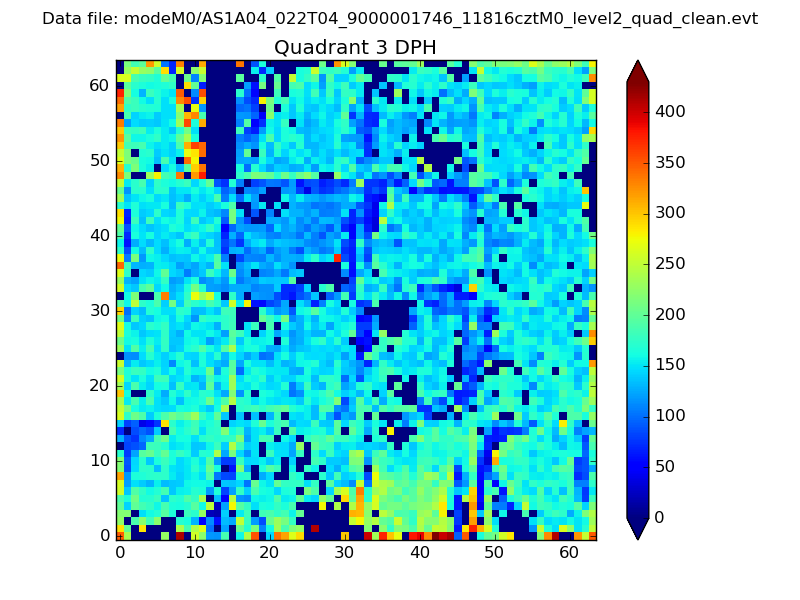 |
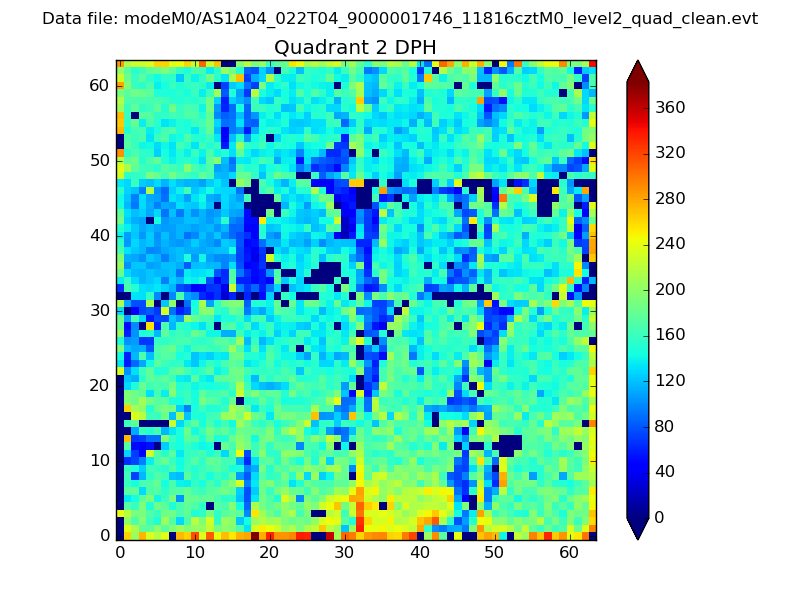 |
Quadrant C |
| Plot type | Count rate plots | Images |
|---|---|---|
| Comparison with Poisson distribution Blue bars denote a histogram of data divided into 1 sec bins. Red curve is a Poisson curve with rate = median count rate of data. |
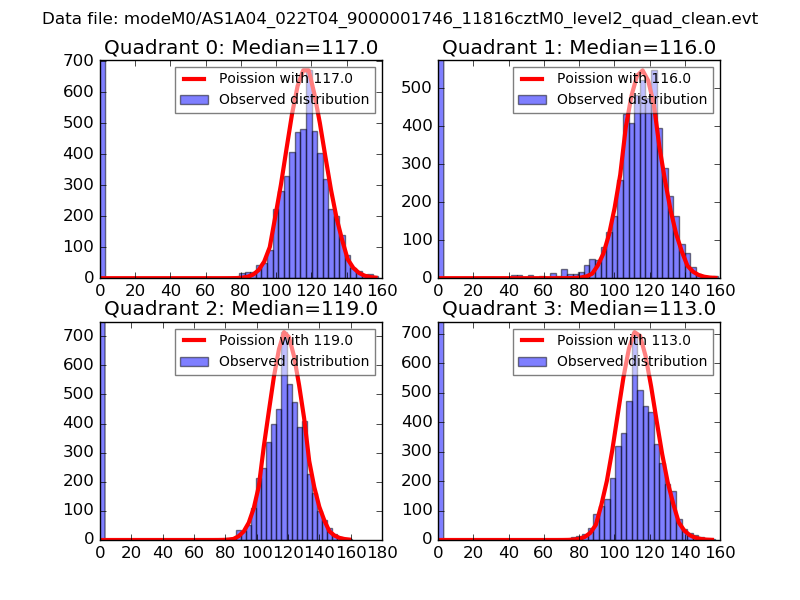 |
 |
| Quadrant-wise count rates Data is divided into 100 sec bins |
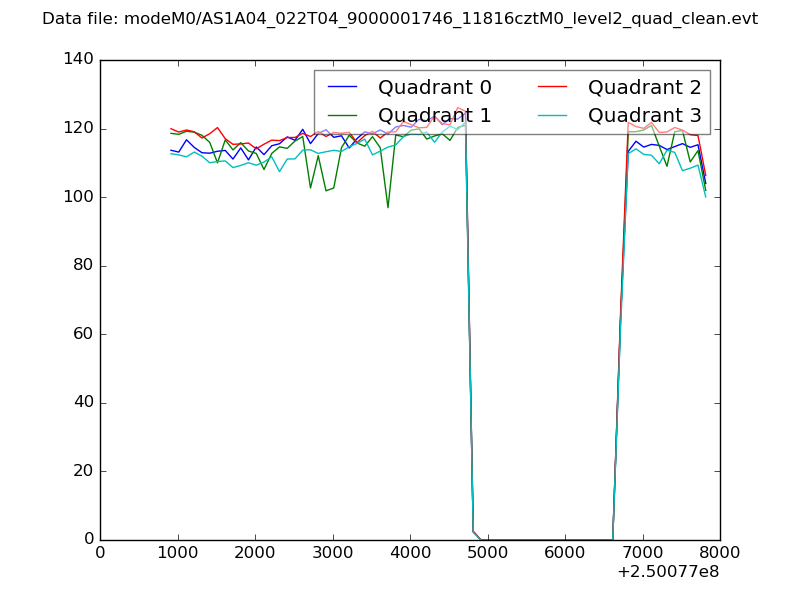 |
|
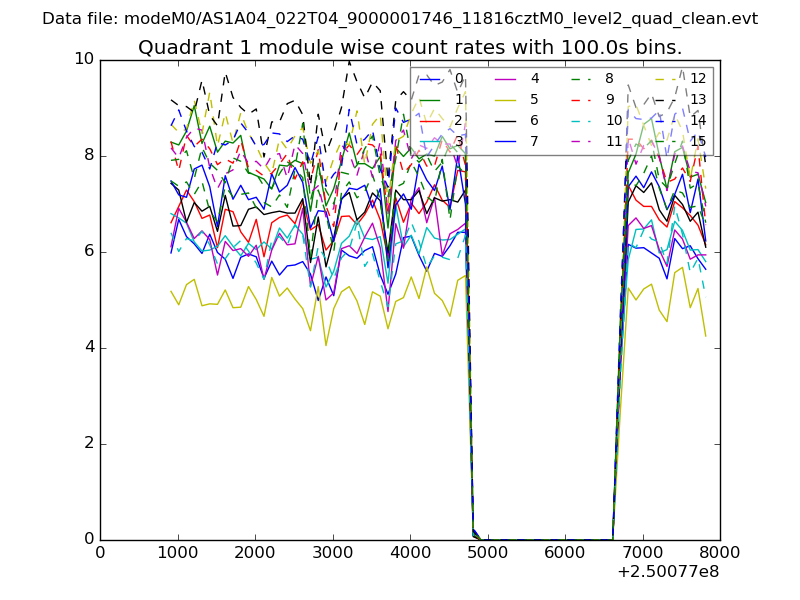
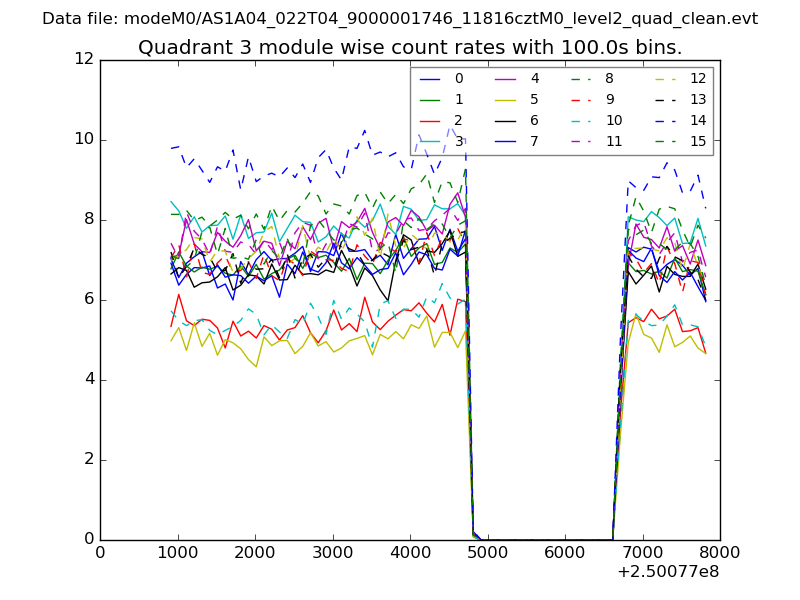
| Module-wise count rates for Quadrant A Data is divided into 100 sec bins |
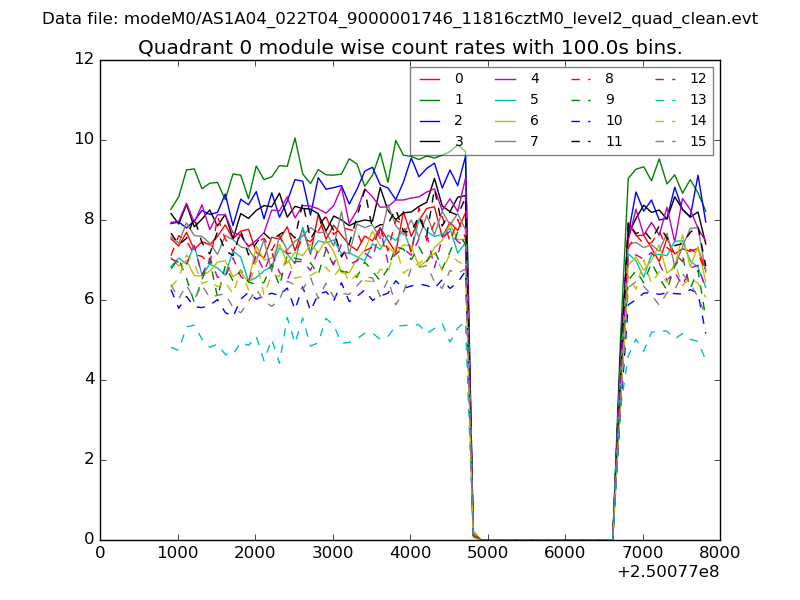 |
 |
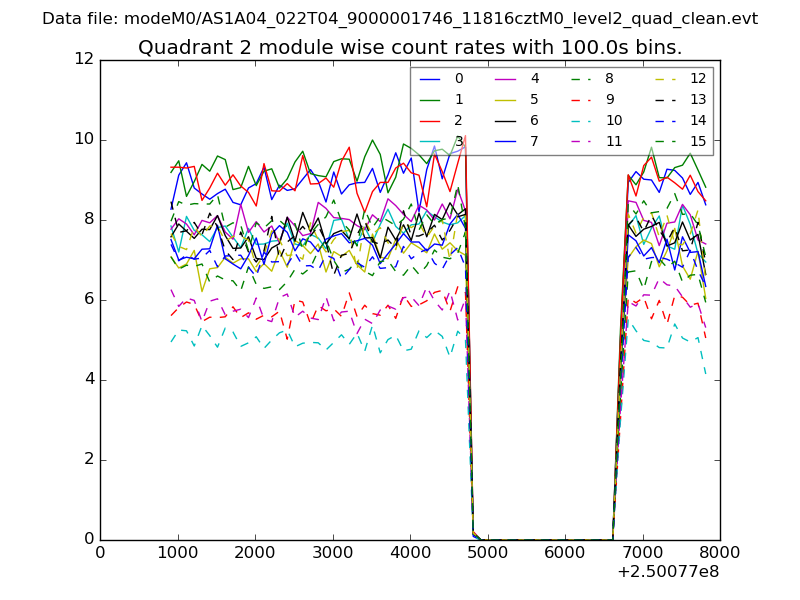
| Module-wise count rates for Quadrant B Data is divided into 100 sec bins |
 |
 |
| Module-wise count rates for Quadrant C Data is divided into 100 sec bins |
 |
 |
| Module-wise count rates for Quadrant D Data is divided into 100 sec bins |
 |
 |
| Parameter | Plot |
|---|---|
| CZT HV Monitor | 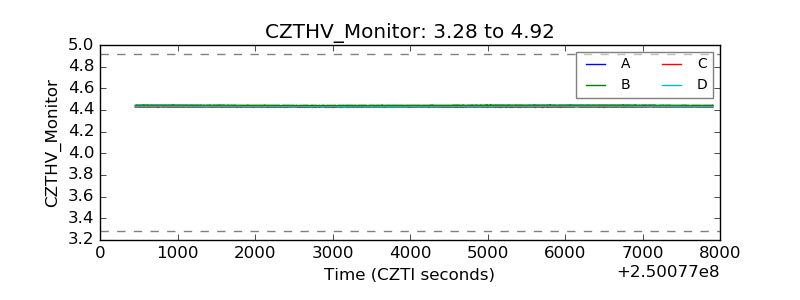 |
| D_VDD | 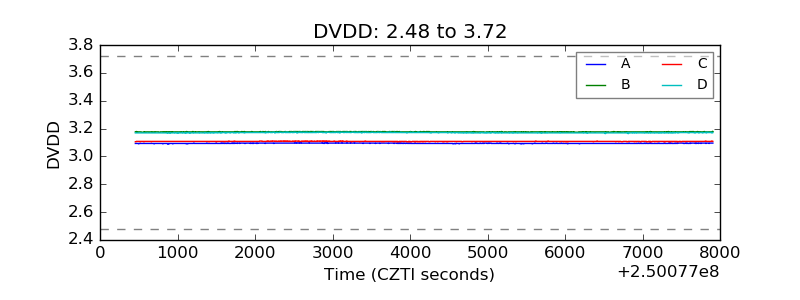 |
| Temperature 1 | 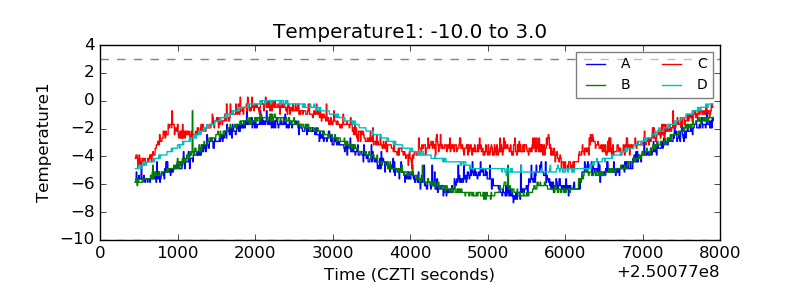 |
| Veto HV Monitor |  |
| Veto LLD | 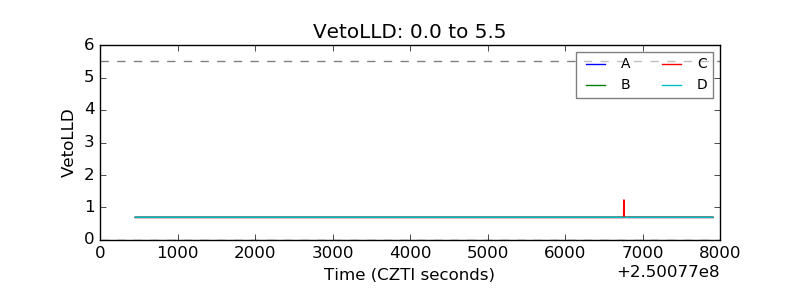 |
| Alpha Counter |  |
| _CPM_Rate | 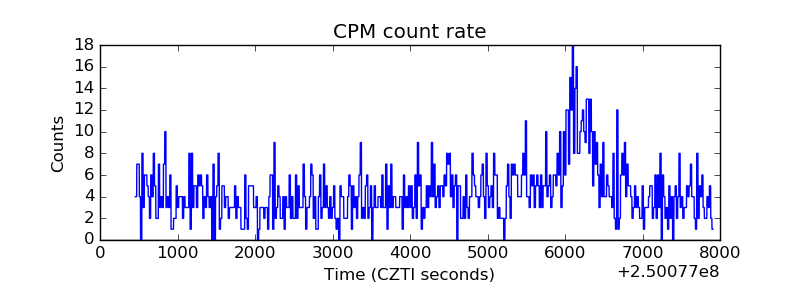 |
| CZT Counter | 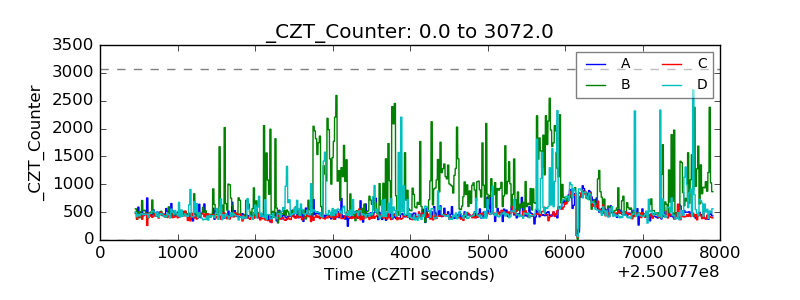 |
| +2.5 Volts monitor |  |
| +5 Volts monitor |  |
| _ROLL_ROT | 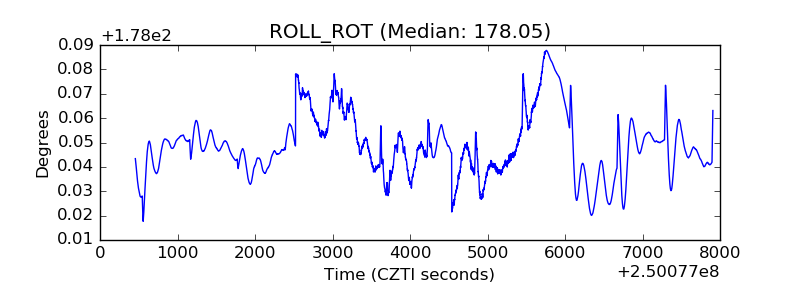 |
| _Roll_DEC | 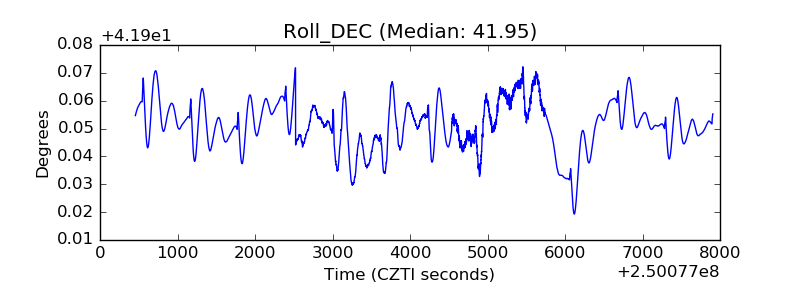 |
| _Roll_RA | 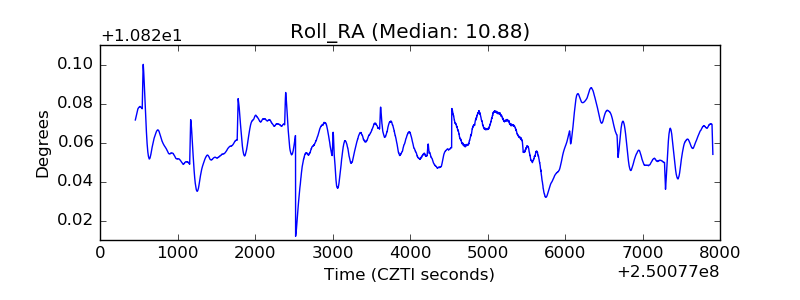 |
| Veto Counter | 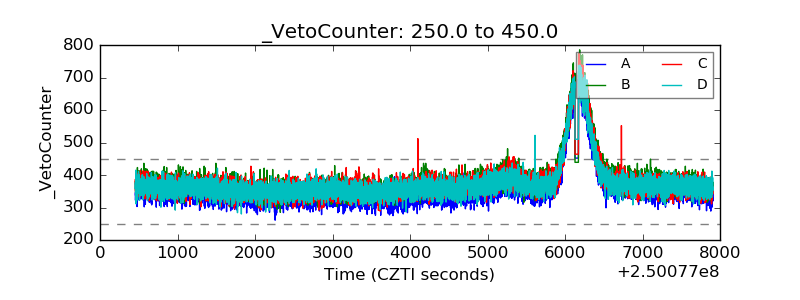 |