| Param | Original file | Final file |
|---|---|---|
| Filename | modeM0/AS1A04_022T04_9000001746_11819cztM0_level2.evt | modeM0/AS1A04_022T04_9000001746_11819cztM0_level2_quad_clean.evt |
| Size (bytes) | 1,153,442,880 | 194,063,040 |
| Size | 1.1 GB | 185.1 MB |
| Events in quadrant A | 6,986,318 | 1,237,232 |
| Events in quadrant B | 11,757,867 | 1,197,832 |
| Events in quadrant C | 6,518,297 | 1,253,884 |
| Events in quadrant D | 8,689,016 | 1,186,193 |
| Mode SS | |||
|---|---|---|---|
| Quadrant | BADHDUFLAG | Total packets | Discarded packets |
| A | 0 | 294 | 0 |
| B | 0 | 294 | 0 |
| C | 0 | 294 | 0 |
| D | 0 | 294 | 0 |
| Mode M9 | |||
|---|---|---|---|
| Quadrant | BADHDUFLAG | Total packets | Discarded packets |
| A | 0 | 10 | 0 |
| B | 0 | 10 | 0 |
| C | 0 | 10 | 0 |
| D | 0 | 10 | 0 |
| Mode M0 | |||
|---|---|---|---|
| Quadrant | BADHDUFLAG | Total packets | Discarded packets |
| A | 0 | 30450 | 2 |
| B | 0 | 44821 | 2 |
| C | 0 | 29693 | 2 |
| D | 0 | 35624 | 2 |
| Quadrant | Total seconds | Saturated seconds | Saturation percentage |
|---|---|---|---|
| A | 14519 | 251 | 1.728769% |
| B | 14519 | 1032 | 7.107928% |
| C | 14519 | 132 | 0.909154% |
| D | 14519 | 516 | 3.553964% |
Noise dominated data is calculated using 1-second bins in cleaned event files. If a bin has >2000 counts, and if more than 50% of those come from <1% of pixels, then it is considered to be noise-dominated and hence unusable.
| Quadrant | # 1 sec bins | Bins with >0 counts | Bins with >2000 counts | High rate bins dominated by noise | Noise dominated (total time) | Noise dominated (detector-on time) | Marked lightcurve |
|---|---|---|---|---|---|---|---|
| A | 15525 | 14522 | 5 | 5 | 0.03% | 0.03% | 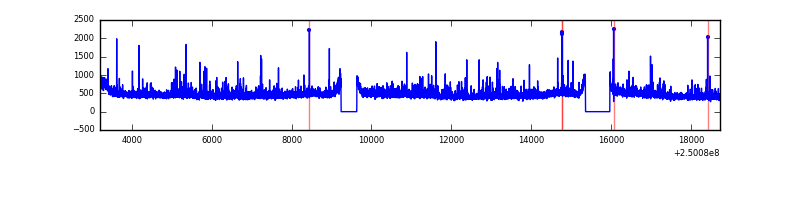 |
| B | 15525 | 14522 | 581 | 581 | 3.74% | 4.00% | 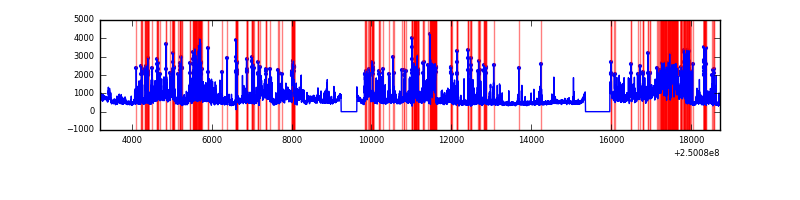 |
| C | 15525 | 14522 | 3 | 3 | 0.02% | 0.02% | 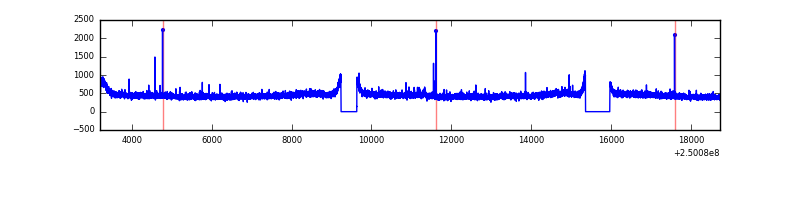 |
| D | 15525 | 14522 | 272 | 272 | 1.75% | 1.87% | 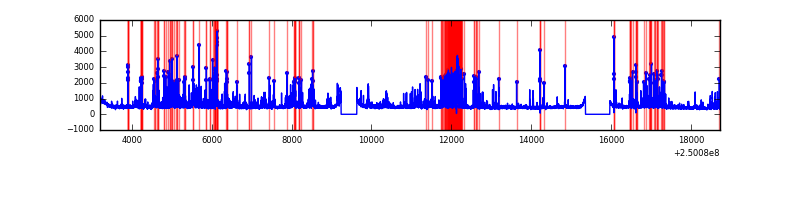 |
Top three noisy pixels from each quadrant. If the there are fewer than three noisy pixels in the level2.evt file, extra rows are filled as -1
| Pixel properties | Quadrant properties | ||||||
|---|---|---|---|---|---|---|---|
| Quadrant | DetID | PixID | Counts | Sigma | Mean | Median | Sigma |
| A | 1 | 162 | 195567 | 568.03 | 1687 | 1648 | 341.4 |
| A | 1 | 178 | 99743 | 287.34 | 1687 | 1648 | 341.4 |
| A | 1 | 161 | 87089 | 250.28 | 1687 | 1648 | 341.4 |
| B | 10 | 16 | 2923236 | 9363.29 | 1658 | 1616 | 312.0 |
| B | 4 | 239 | 1851014 | 5927.0 | 1658 | 1616 | 312.0 |
| B | 3 | 64 | 100384 | 316.53 | 1658 | 1616 | 312.0 |
| C | 8 | 208 | 48437 | 121.06 | 1652 | 1658 | 386.4 |
| C | 13 | 61 | 12456 | 27.94 | 1652 | 1658 | 386.4 |
| C | 0 | 207 | 11144 | 24.55 | 1652 | 1658 | 386.4 |
| D | 1 | 52 | 1000697 | 2519.04 | 1638 | 1587 | 396.6 |
| D | 13 | 122 | 390601 | 980.82 | 1638 | 1587 | 396.6 |
| D | 13 | 104 | 231012 | 578.45 | 1638 | 1587 | 396.6 |
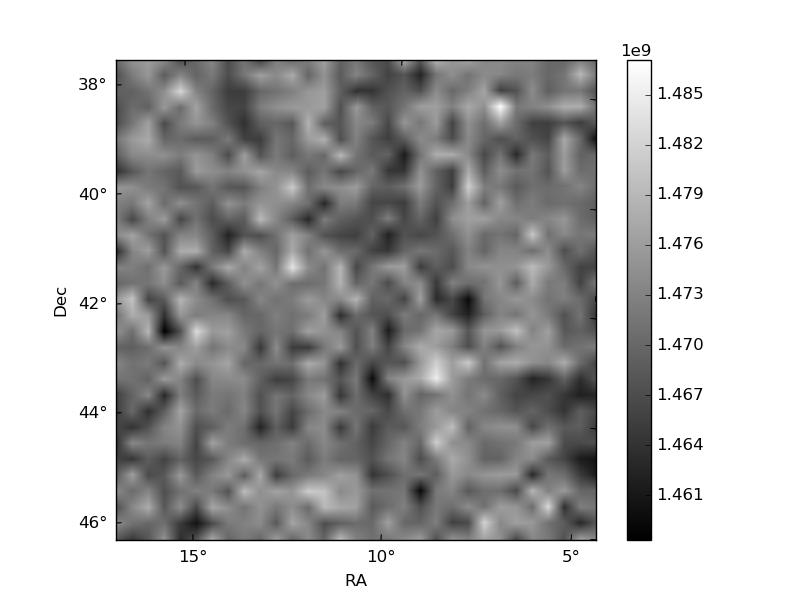
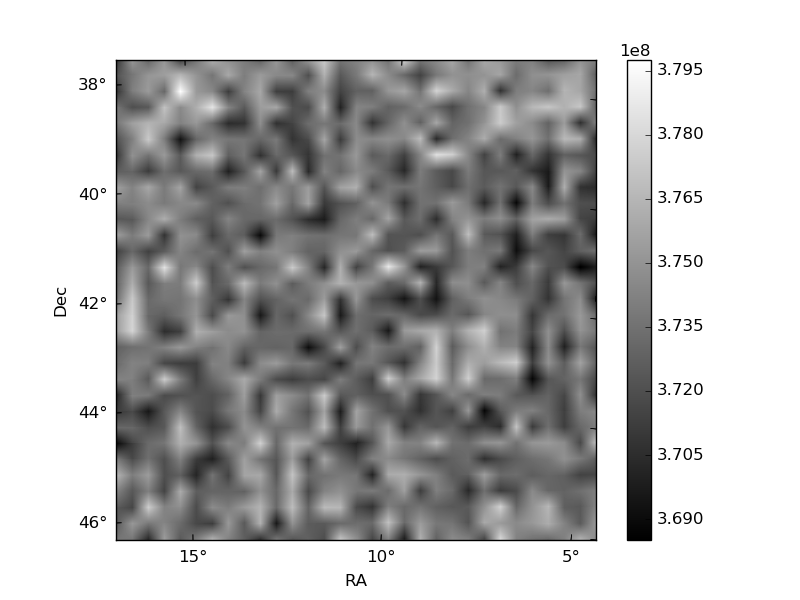
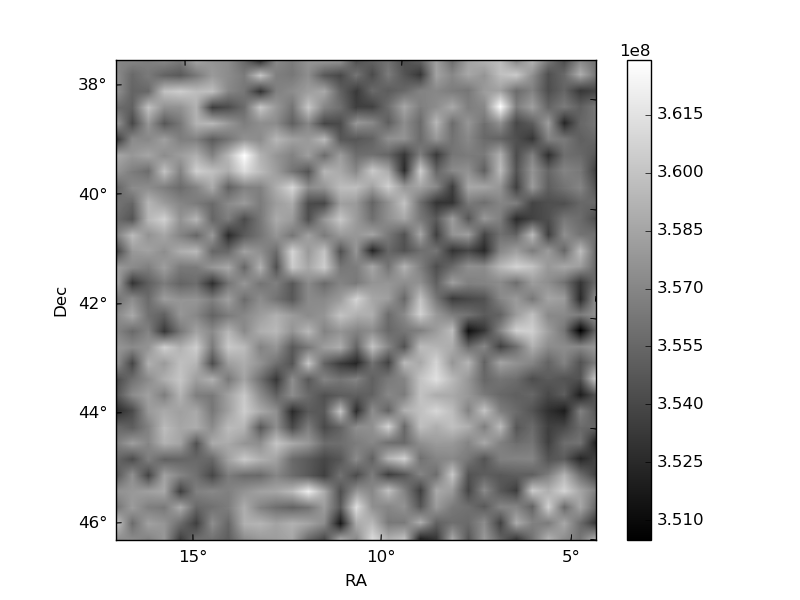
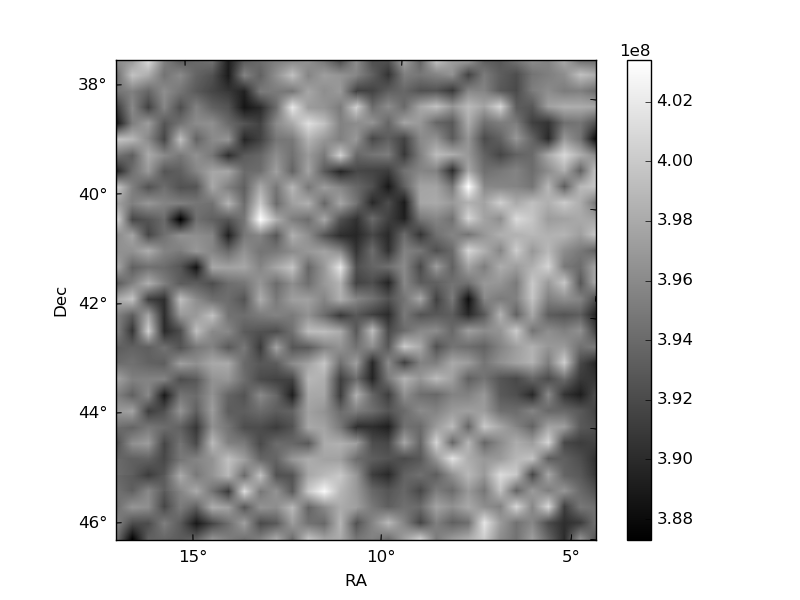
Histogram calculated using DETX and DETY for each event in the final _common_clean file
| Quadrant A | 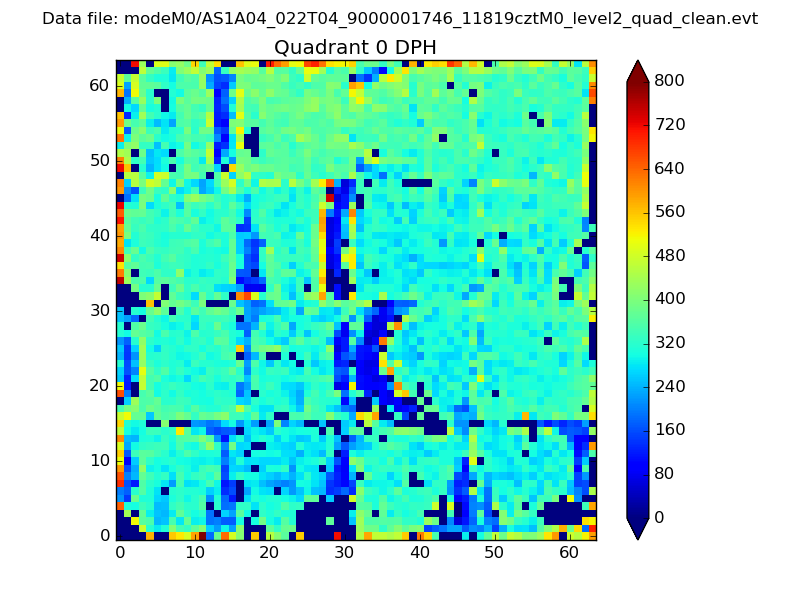 |
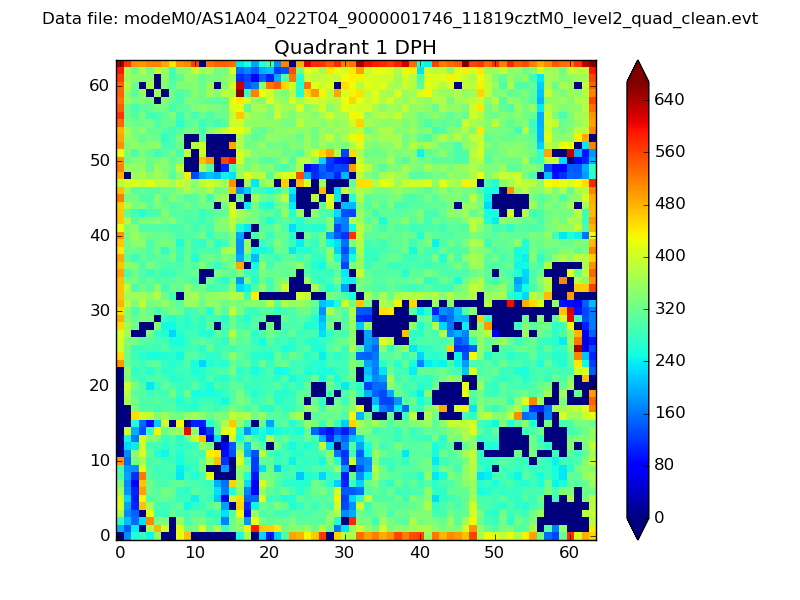 |
Quadrant B |
|---|---|---|---|
| Quadrant D | 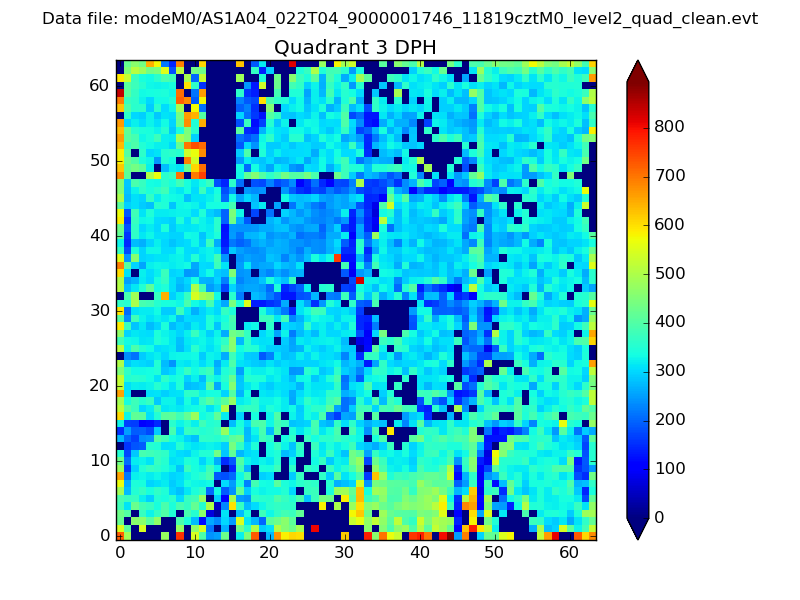 |
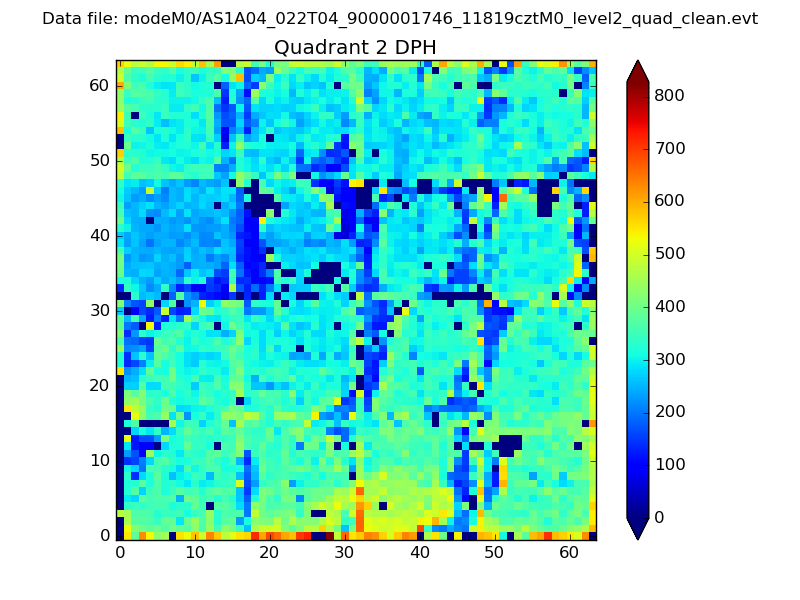 |
Quadrant C |
| Plot type | Count rate plots | Images |
|---|---|---|
| Comparison with Poisson distribution Blue bars denote a histogram of data divided into 1 sec bins. Red curve is a Poisson curve with rate = median count rate of data. |
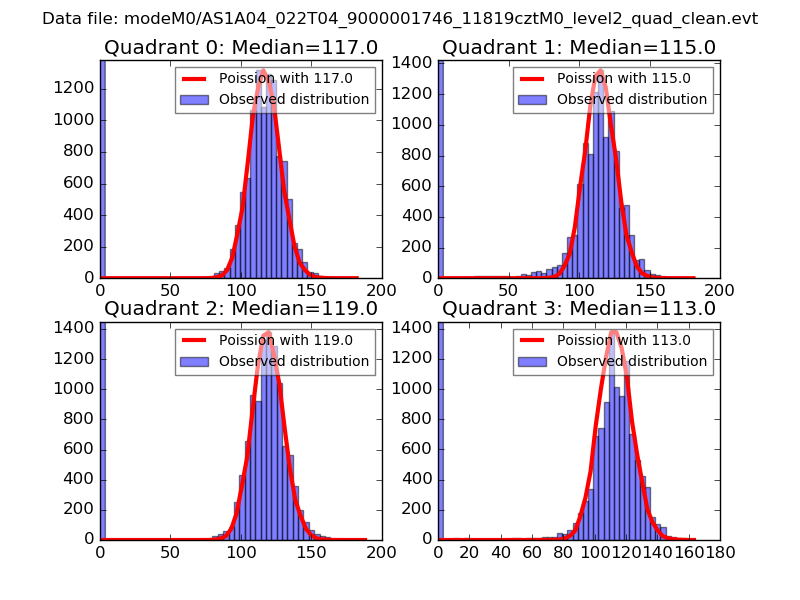 |
 |
| Quadrant-wise count rates Data is divided into 100 sec bins |
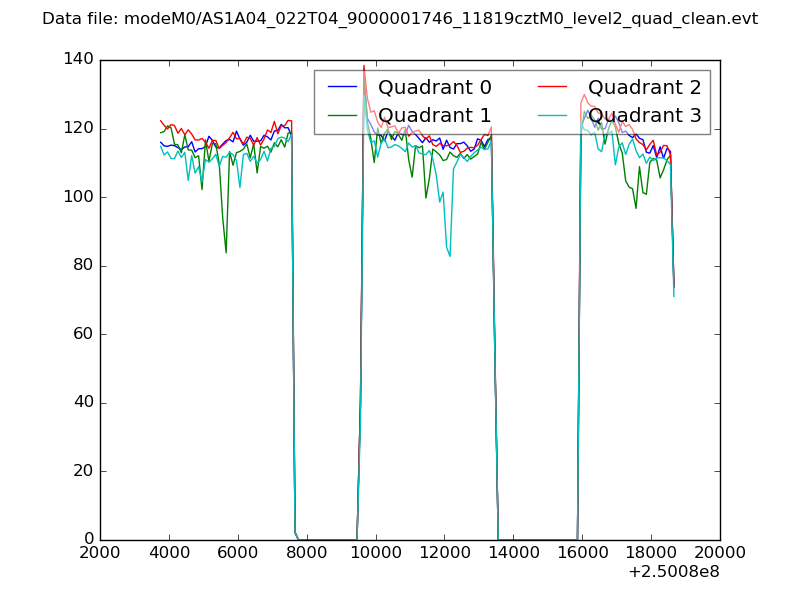 |
|
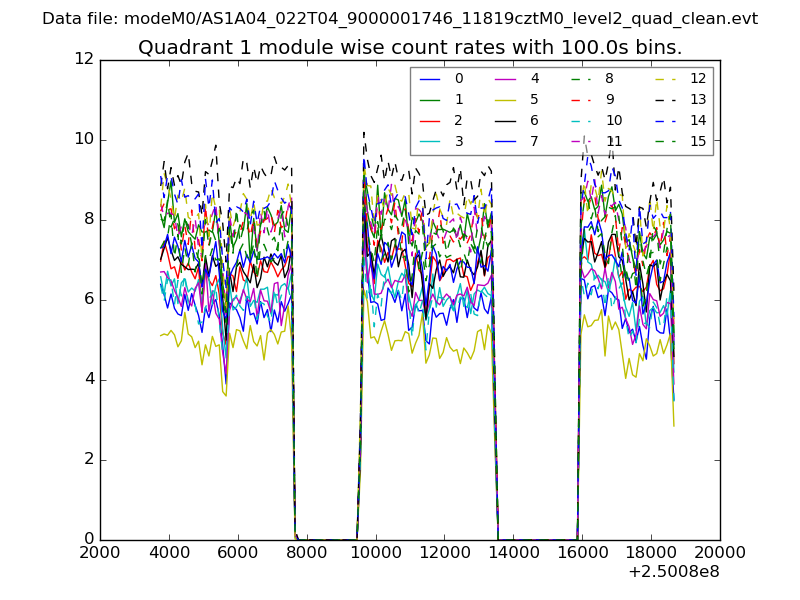
| Module-wise count rates for Quadrant A Data is divided into 100 sec bins |
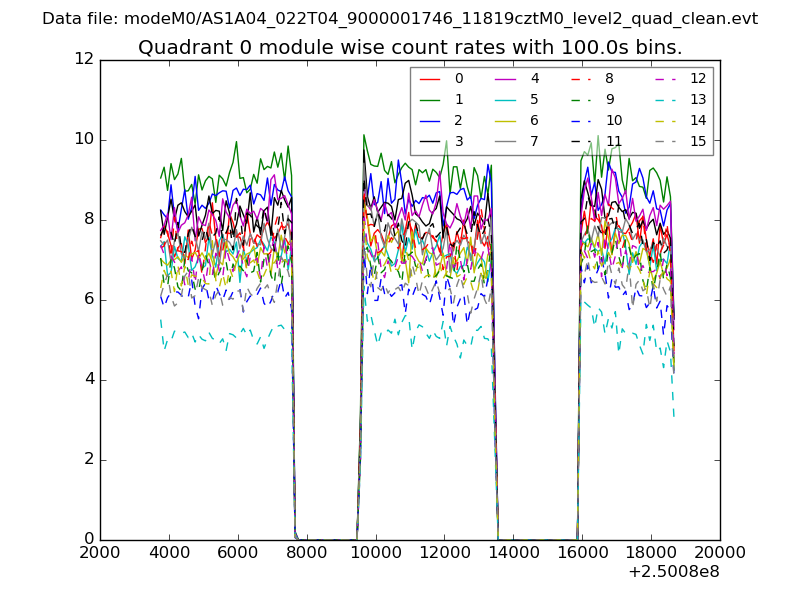 |
 |
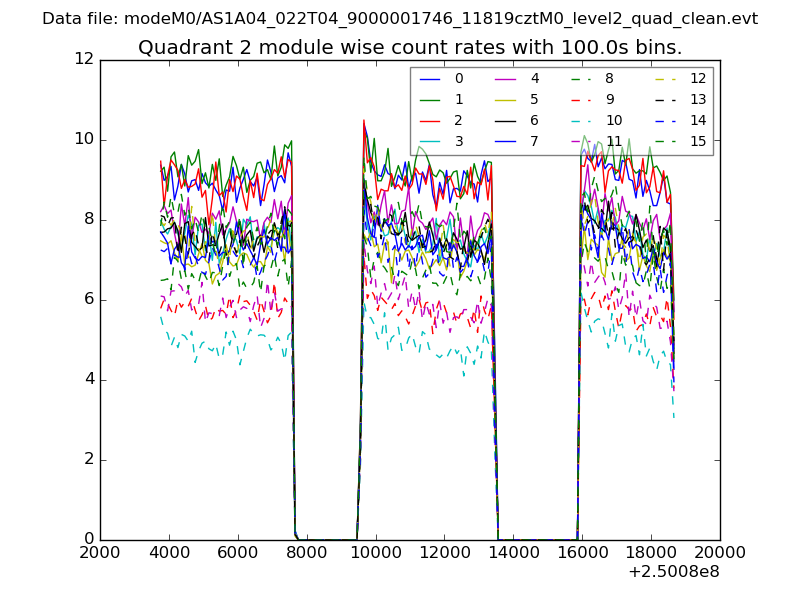
| Module-wise count rates for Quadrant B Data is divided into 100 sec bins |
 |
 |
| Module-wise count rates for Quadrant C Data is divided into 100 sec bins |
 |
 |
| Module-wise count rates for Quadrant D Data is divided into 100 sec bins |
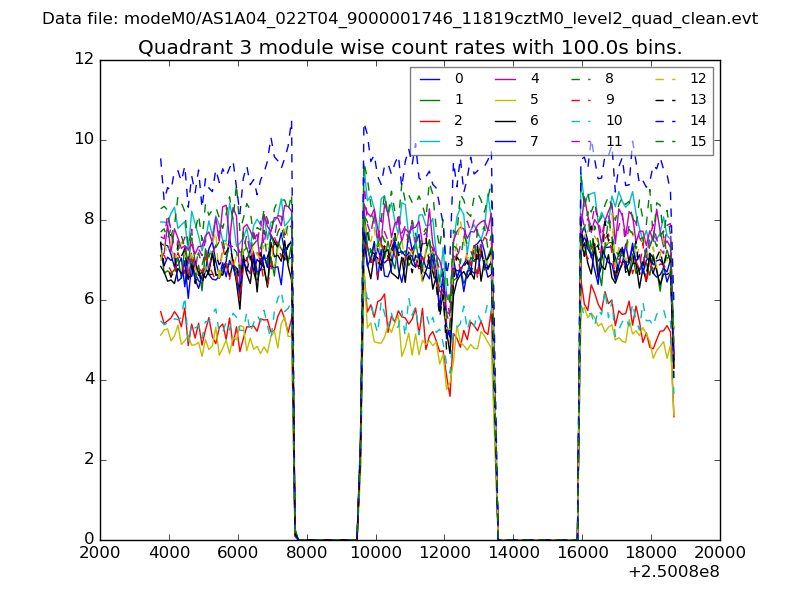 |
 |
| Parameter | Plot |
|---|---|
| CZT HV Monitor | 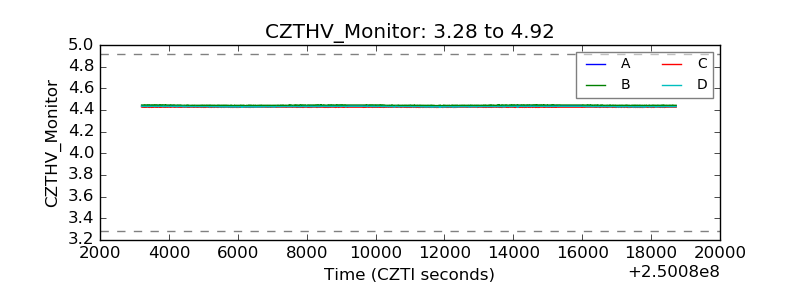 |
| D_VDD | 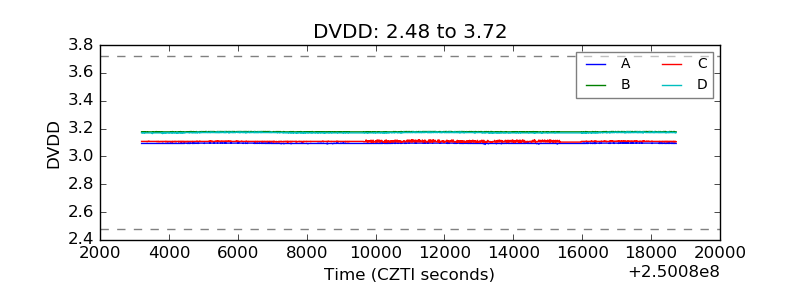 |
| Temperature 1 | 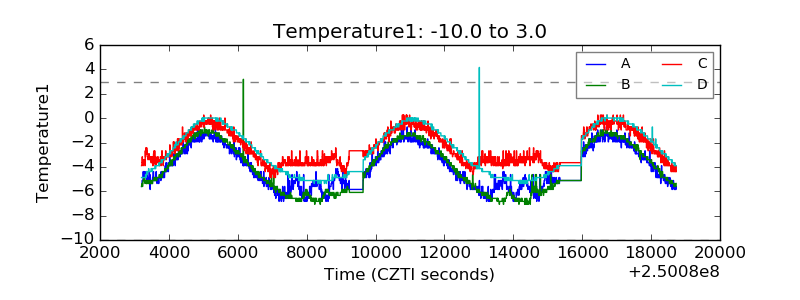 |
| Veto HV Monitor | 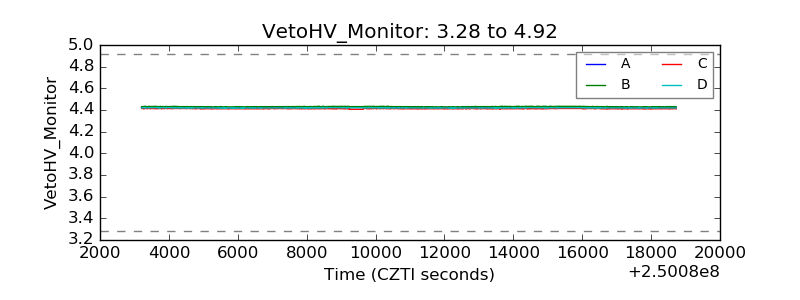 |
| Veto LLD | 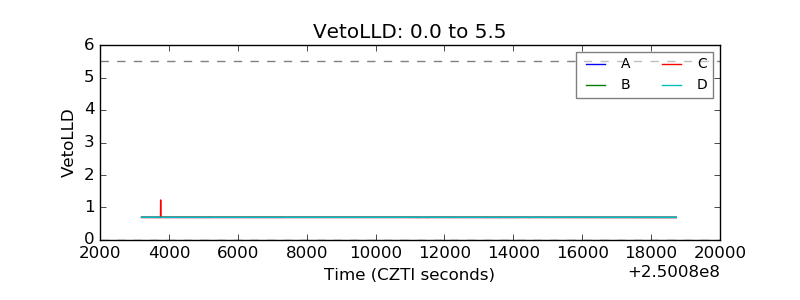 |
| Alpha Counter | 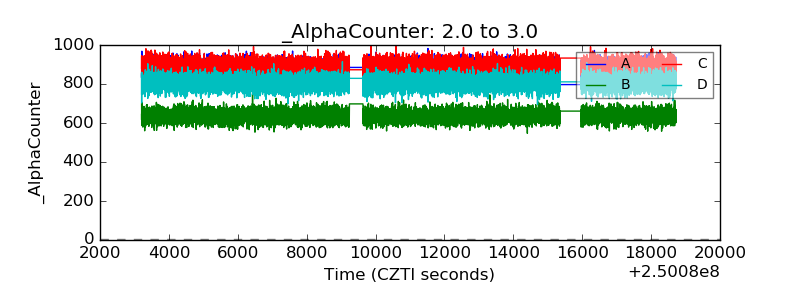 |
| _CPM_Rate | 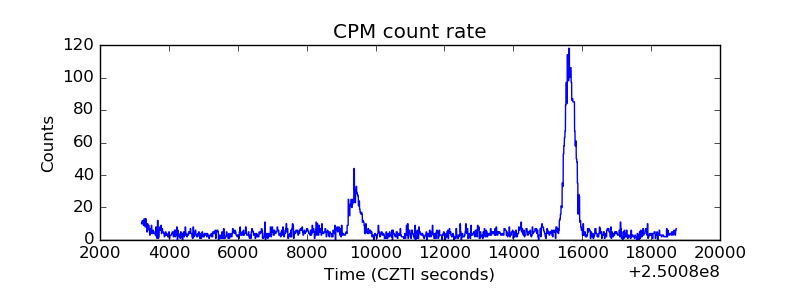 |
| CZT Counter | 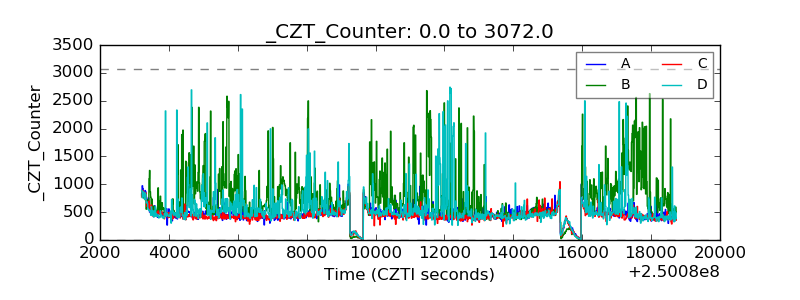 |
| +2.5 Volts monitor |  |
| +5 Volts monitor |  |
| _ROLL_ROT | 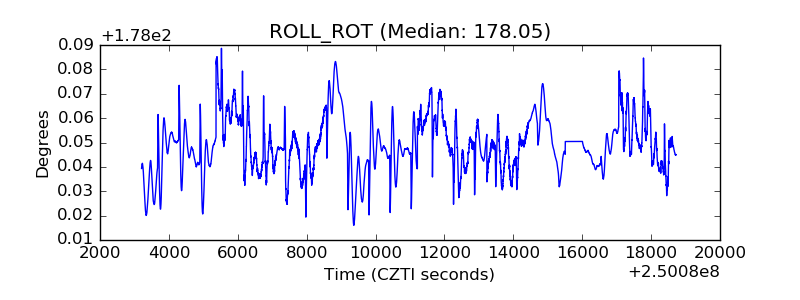 |
| _Roll_DEC | 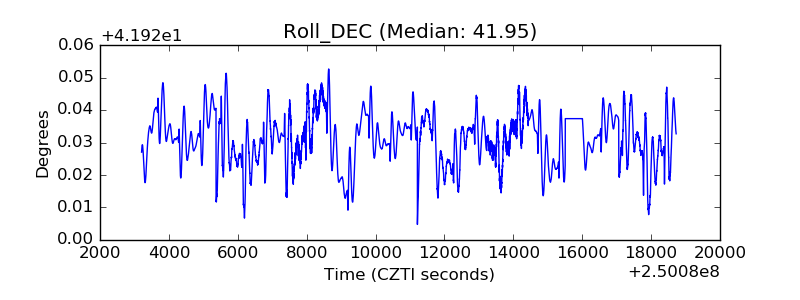 |
| _Roll_RA | 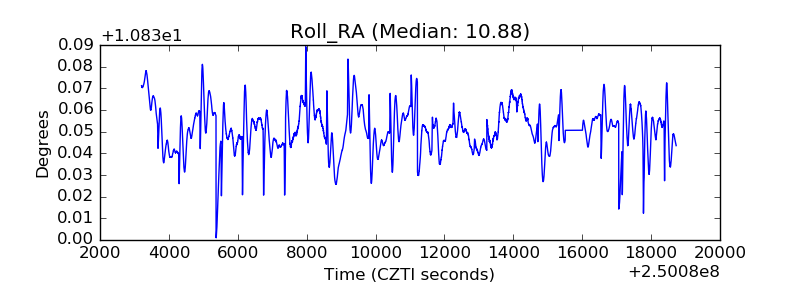 |
| Veto Counter | 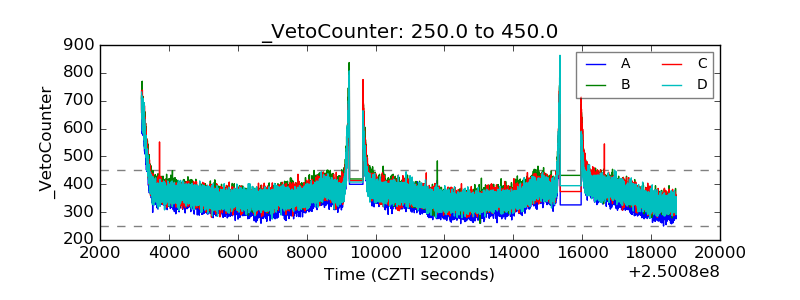 |