| Param | Original file | Final file |
|---|---|---|
| Filename | modeM0/AS1A04_022T07_9000001748cztM0_level2.fits | modeM0/AS1A04_022T07_9000001748cztM0_level2_quad_clean.evt |
| Size (bytes) | 676,998,720 | 631,465,920 |
| Size | 645.6 MB | 602.2 MB |
| Events in quadrant A | 4,282,770 | 4,063,772 |
| Events in quadrant B | 3,121,310 | 2,332,622 |
| Events in quadrant C | 4,241,060 | 3,940,196 |
| Events in quadrant D | 3,607,636 | 3,550,768 |
| Mode SS | |||
|---|---|---|---|
| Quadrant | BADHDUFLAG | Total packets | Discarded packets |
| A | 0 | 1558 | 0 |
| B | 0 | 1558 | 0 |
| C | 0 | 1558 | 0 |
| D | 0 | 1558 | 0 |
| Mode M9 | |||
|---|---|---|---|
| Quadrant | BADHDUFLAG | Total packets | Discarded packets |
| A | 0 | 111 | 0 |
| B | 0 | 111 | 0 |
| C | 0 | 111 | 0 |
| D | 0 | 111 | 0 |
| Mode M0 | |||
|---|---|---|---|
| Quadrant | BADHDUFLAG | Total packets | Discarded packets |
| A | 0 | 163062 | 0 |
| B | 0 | 367229 | 0 |
| C | 0 | 156659 | 0 |
| D | 0 | 188708 | 0 |
| Quadrant | Total seconds | Saturated seconds | Saturation percentage |
|---|---|---|---|
| A | 76340 | 1334 | 1.747446% |
| B | 76332 | 29073 | 38.087565% |
| C | 76340 | 668 | 0.875033% |
| D | 76332 | 2150 | 2.816643% |
Noise dominated data is calculated using 1-second bins in cleaned event files. If a bin has >2000 counts, and if more than 50% of those come from <1% of pixels, then it is considered to be noise-dominated and hence unusable.
| Quadrant | # 1 sec bins | Bins with >0 counts | Bins with >2000 counts | High rate bins dominated by noise | Noise dominated (total time) | Noise dominated (detector-on time) | Marked lightcurve |
|---|---|---|---|---|---|---|---|
| A | 87670 | 76345 | 0 | 0 | 0.00% | 0.00% |  |
| B | 87670 | 75287 | 0 | 0 | 0.00% | 0.00% |  |
| C | 87670 | 76345 | 0 | 0 | 0.00% | 0.00% | 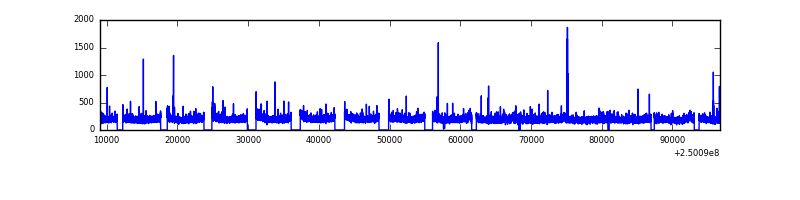 |
| D | 87670 | 76322 | 0 | 0 | 0.00% | 0.00% |  |
Top three noisy pixels from each quadrant. If the there are fewer than three noisy pixels in the level2.evt file, extra rows are filled as -1
| Pixel properties | Quadrant properties | ||||||
|---|---|---|---|---|---|---|---|
| Quadrant | DetID | PixID | Counts | Sigma | Mean | Median | Sigma |
| A | 0 | 29 | 4216 | 11.33 | 1114 | 1045 | 279.8 |
| A | 7 | 110 | 3455 | 8.61 | 1114 | 1045 | 279.8 |
| A | 0 | 30 | 3267 | 7.94 | 1114 | 1045 | 279.8 |
| B | 2 | 9 | 2698 | 11.77 | 825 | 788 | 162.3 |
| B | 14 | 254 | 2117 | 8.19 | 825 | 788 | 162.3 |
| B | 12 | 226 | 2020 | 7.59 | 825 | 788 | 162.3 |
| C | 12 | 241 | 3022 | 6.85 | 1119 | 1042 | 289.2 |
| C | 1 | 65 | 2921 | 6.5 | 1119 | 1042 | 289.2 |
| C | 3 | 126 | 2865 | 6.3 | 1119 | 1042 | 289.2 |
| D | 3 | 14 | 2759 | 6.58 | 1030 | 934 | 277.4 |
| D | 6 | 231 | 2688 | 6.32 | 1030 | 934 | 277.4 |
| D | 10 | 189 | 2571 | 5.9 | 1030 | 934 | 277.4 |
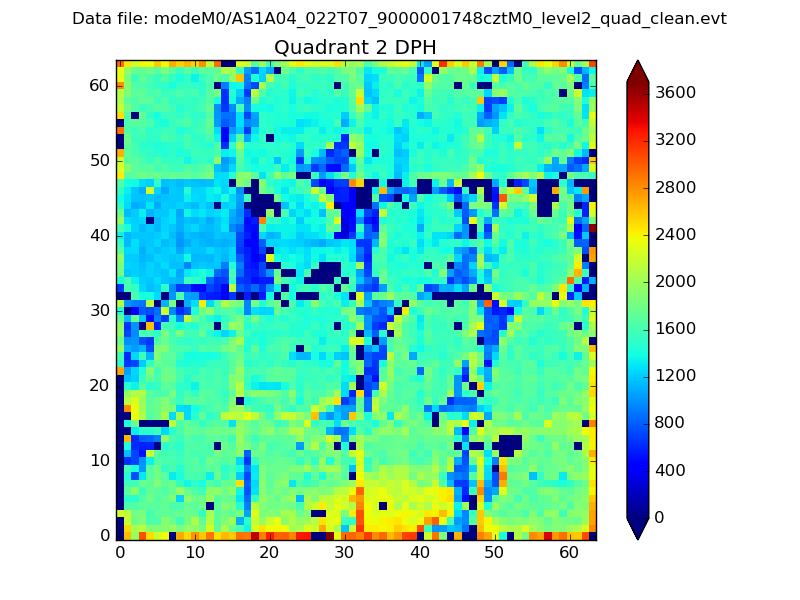
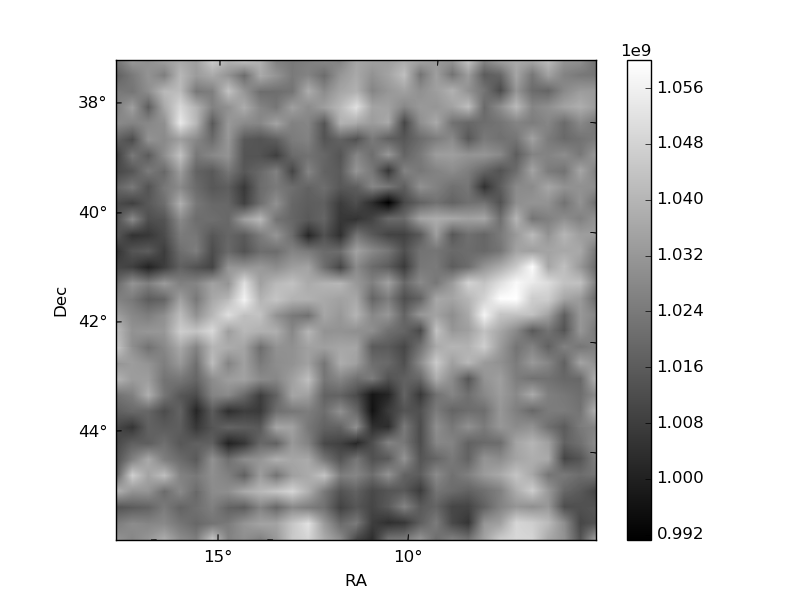
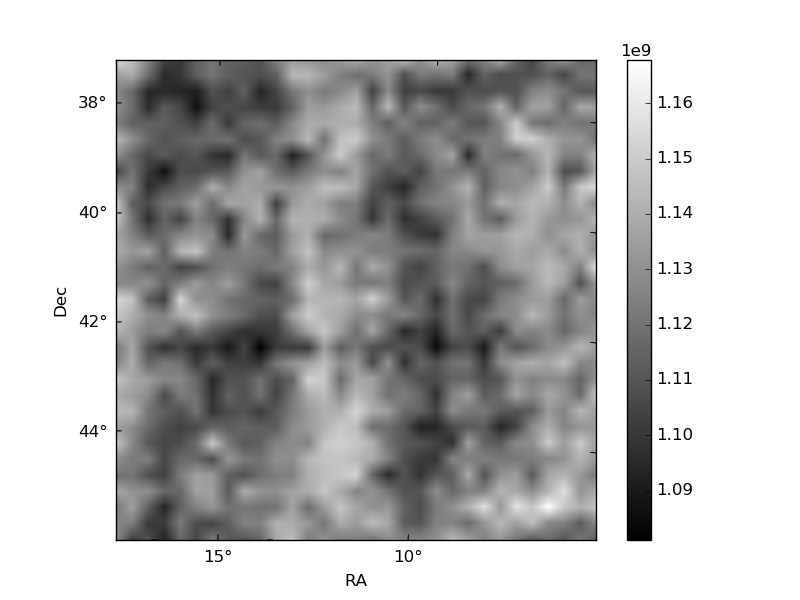
Histogram calculated using DETX and DETY for each event in the final _common_clean file
| Quadrant A |  |
 |
Quadrant B |
|---|---|---|---|
| Quadrant D | 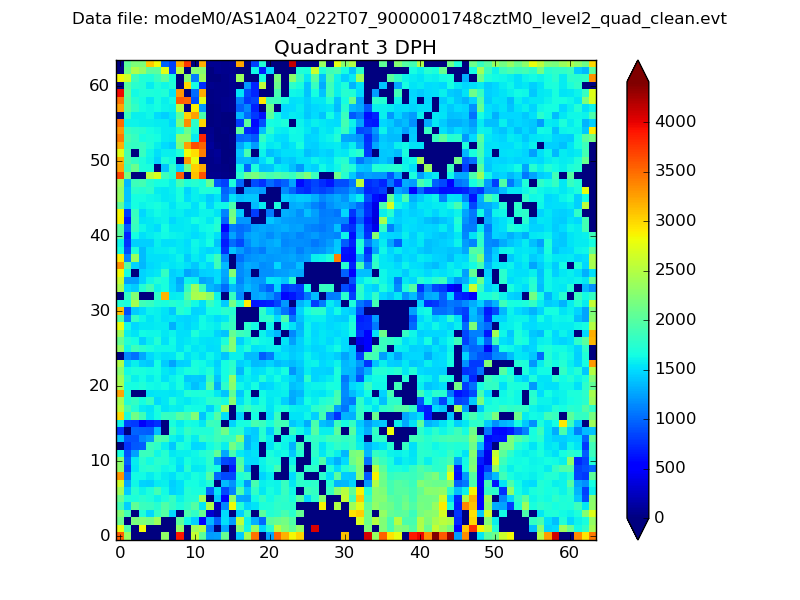 |
 |
Quadrant C |
| Plot type | Count rate plots | Images |
|---|---|---|
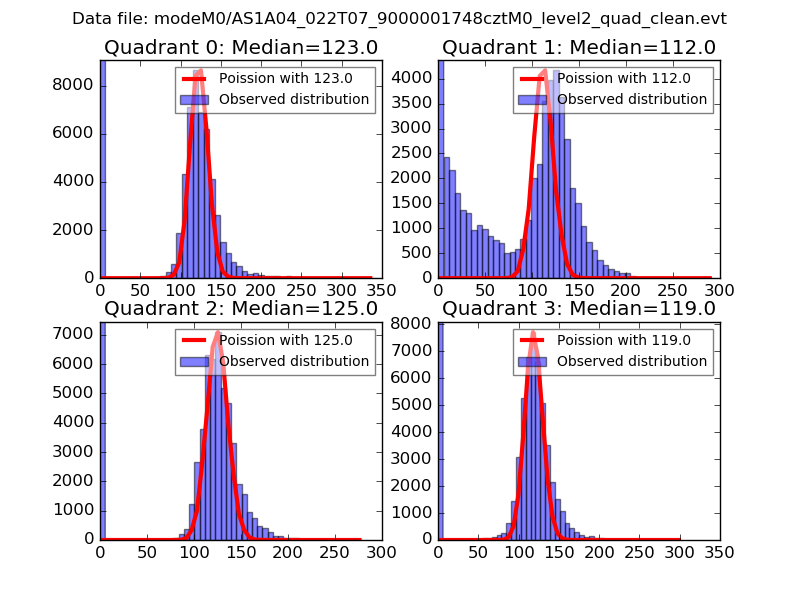
| Comparison with Poisson distribution Blue bars denote a histogram of data divided into 1 sec bins. Red curve is a Poisson curve with rate = median count rate of data. |
 |
 |
| Quadrant-wise count rates Data is divided into 100 sec bins |
 |
|
| Module-wise count rates for Quadrant A Data is divided into 100 sec bins |
 |
 |
| Module-wise count rates for Quadrant B Data is divided into 100 sec bins |
 |
 |
| Module-wise count rates for Quadrant C Data is divided into 100 sec bins |
 |
 |
| Module-wise count rates for Quadrant D Data is divided into 100 sec bins |
 |
 |
| Parameter | Plot |
|---|---|
| CZT HV Monitor |  |
| D_VDD | 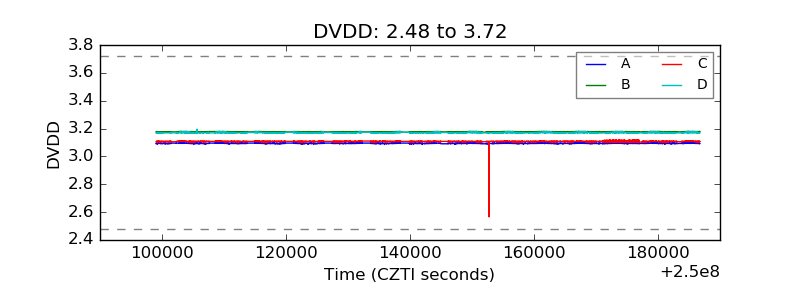 |
| Temperature 1 |  |
| Veto HV Monitor |  |
| Veto LLD | 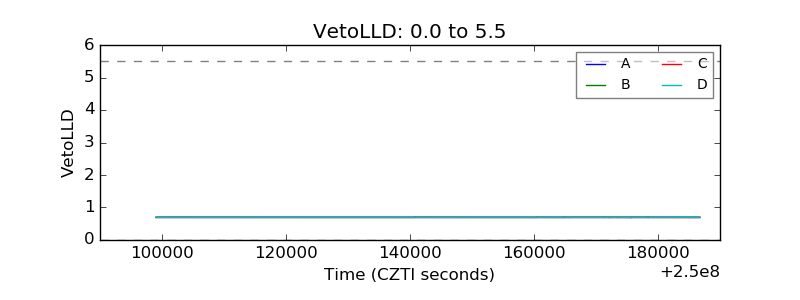 |
| Alpha Counter | 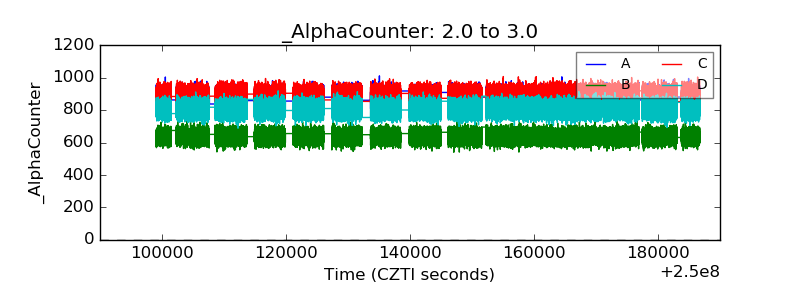 |
| _CPM_Rate |  |
| CZT Counter |  |
| +2.5 Volts monitor | 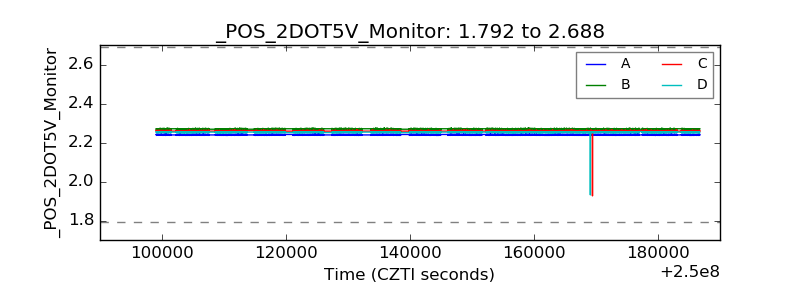 |
| +5 Volts monitor |  |
| _ROLL_ROT |  |
| _Roll_DEC |  |
| _Roll_RA |  |
| Veto Counter |  |