| Param | Original file | Final file |
|---|---|---|
| Filename | modeM0/AS1A04_022T07_9000001748_11819cztM0_level2.evt | modeM0/AS1A04_022T07_9000001748_11819cztM0_level2_quad_clean.evt |
| Size (bytes) | 292,383,360 | 42,036,480 |
| Size | 278.8 MB | 40.1 MB |
| Events in quadrant A | 1,982,773 | 251,159 |
| Events in quadrant B | 2,648,723 | 244,286 |
| Events in quadrant C | 1,822,446 | 254,393 |
| Events in quadrant D | 2,129,310 | 241,879 |
| Mode SS | |||
|---|---|---|---|
| Quadrant | BADHDUFLAG | Total packets | Discarded packets |
| A | 0 | 84 | 0 |
| B | 0 | 84 | 0 |
| C | 0 | 84 | 0 |
| D | 0 | 84 | 0 |
| Mode M9 | |||
|---|---|---|---|
| Quadrant | BADHDUFLAG | Total packets | Discarded packets |
| A | 0 | 7 | 0 |
| B | 0 | 7 | 0 |
| C | 0 | 7 | 0 |
| D | 0 | 7 | 0 |
| Mode M0 | |||
|---|---|---|---|
| Quadrant | BADHDUFLAG | Total packets | Discarded packets |
| A | 0 | 8467 | 2 |
| B | 0 | 10453 | 1 |
| C | 0 | 8115 | 1 |
| D | 0 | 9098 | 1 |
| Quadrant | Total seconds | Saturated seconds | Saturation percentage |
|---|---|---|---|
| A | 3968 | 54 | 1.360887% |
| B | 3968 | 206 | 5.191532% |
| C | 3968 | 33 | 0.831653% |
| D | 3968 | 78 | 1.965726% |
Noise dominated data is calculated using 1-second bins in cleaned event files. If a bin has >2000 counts, and if more than 50% of those come from <1% of pixels, then it is considered to be noise-dominated and hence unusable.
| Quadrant | # 1 sec bins | Bins with >0 counts | Bins with >2000 counts | High rate bins dominated by noise | Noise dominated (total time) | Noise dominated (detector-on time) | Marked lightcurve |
|---|---|---|---|---|---|---|---|
| A | 4754 | 3970 | 0 | 0 | 0.00% | 0.00% | 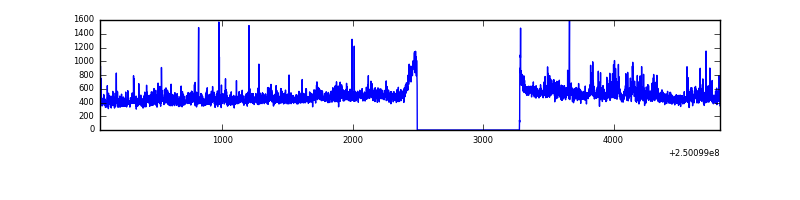 |
| B | 4754 | 3970 | 81 | 81 | 1.70% | 2.04% | 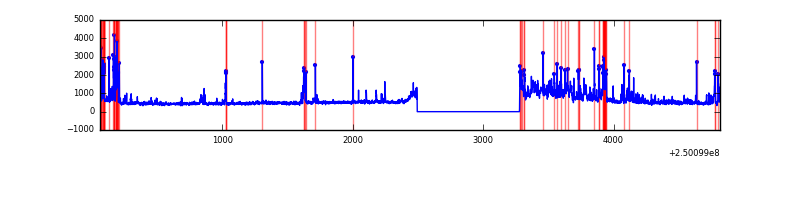 |
| C | 4754 | 3970 | 0 | 0 | 0.00% | 0.00% | 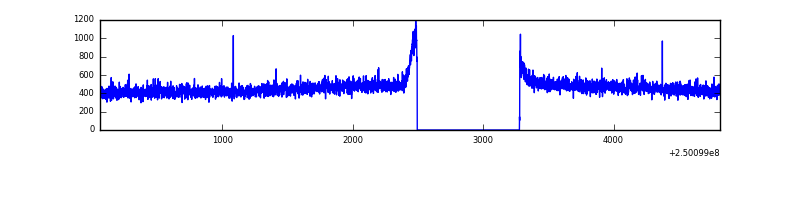 |
| D | 4754 | 3970 | 28 | 28 | 0.59% | 0.71% | 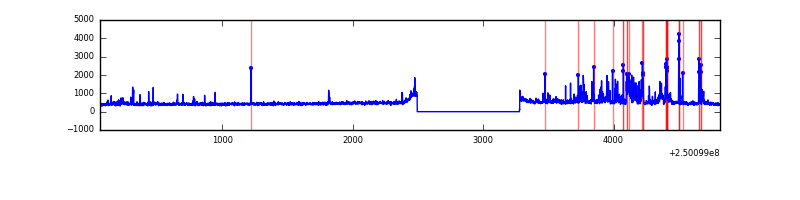 |
Top three noisy pixels from each quadrant. If the there are fewer than three noisy pixels in the level2.evt file, extra rows are filled as -1
| Pixel properties | Quadrant properties | ||||||
|---|---|---|---|---|---|---|---|
| Quadrant | DetID | PixID | Counts | Sigma | Mean | Median | Sigma |
| A | 1 | 162 | 62368 | 633.46 | 474 | 463 | 97.7 |
| A | 1 | 178 | 31906 | 321.75 | 474 | 463 | 97.7 |
| A | 1 | 161 | 28244 | 284.28 | 474 | 463 | 97.7 |
| B | 10 | 16 | 337910 | 3689.5 | 470 | 458 | 91.5 |
| B | 4 | 239 | 250767 | 2736.73 | 470 | 458 | 91.5 |
| B | 3 | 64 | 139661 | 1521.96 | 470 | 458 | 91.5 |
| C | 8 | 208 | 5023 | 41.1 | 465 | 467 | 110.9 |
| C | 13 | 61 | 3381 | 26.29 | 465 | 467 | 110.9 |
| C | 12 | 4 | 2149 | 15.17 | 465 | 467 | 110.9 |
| D | 1 | 52 | 128495 | 1139.41 | 461 | 447 | 112.4 |
| D | 9 | 85 | 78159 | 691.51 | 461 | 447 | 112.4 |
| D | 13 | 104 | 37424 | 329.03 | 461 | 447 | 112.4 |
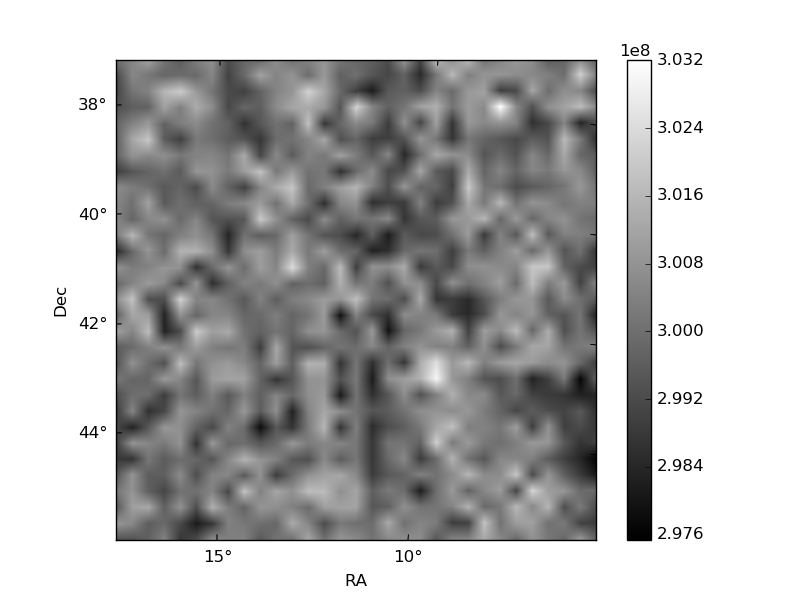
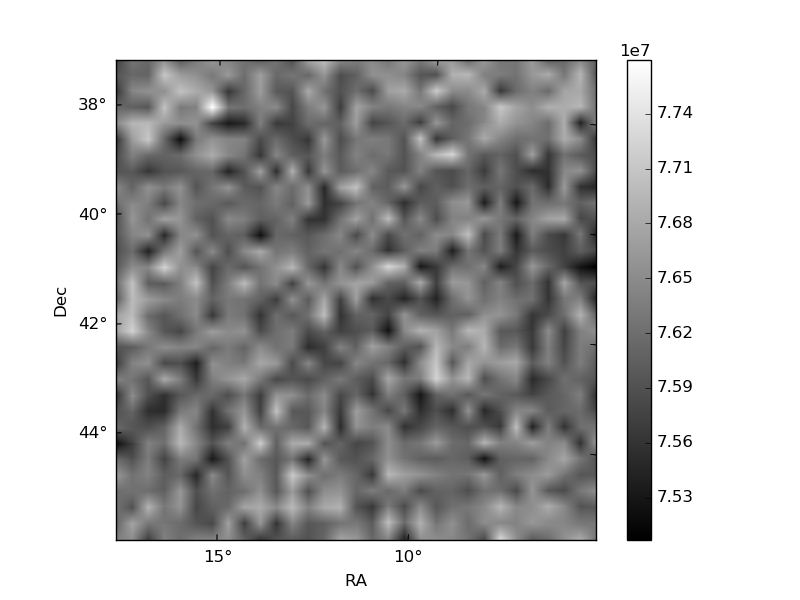
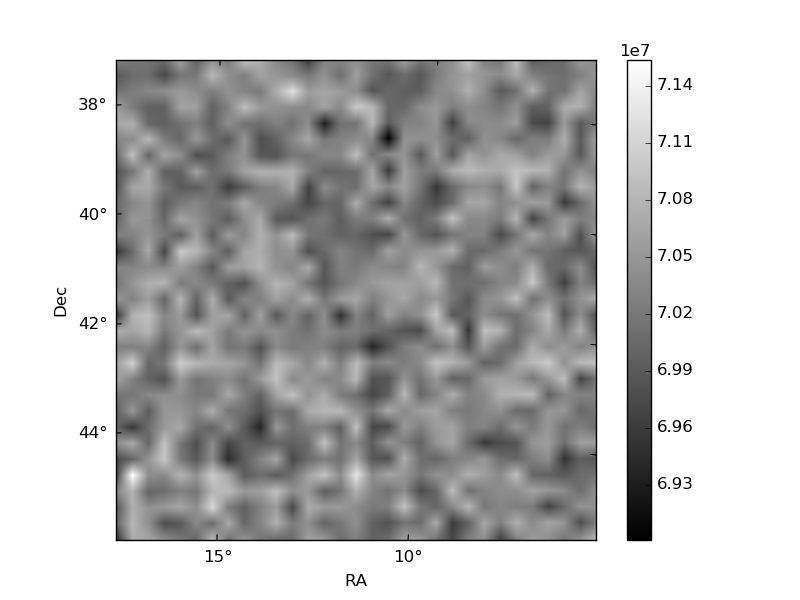
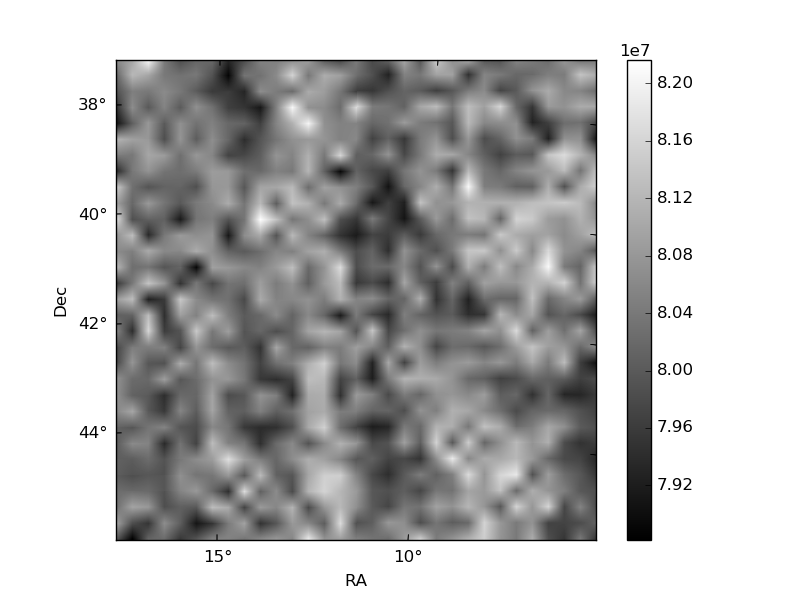
Histogram calculated using DETX and DETY for each event in the final _common_clean file
| Quadrant A | 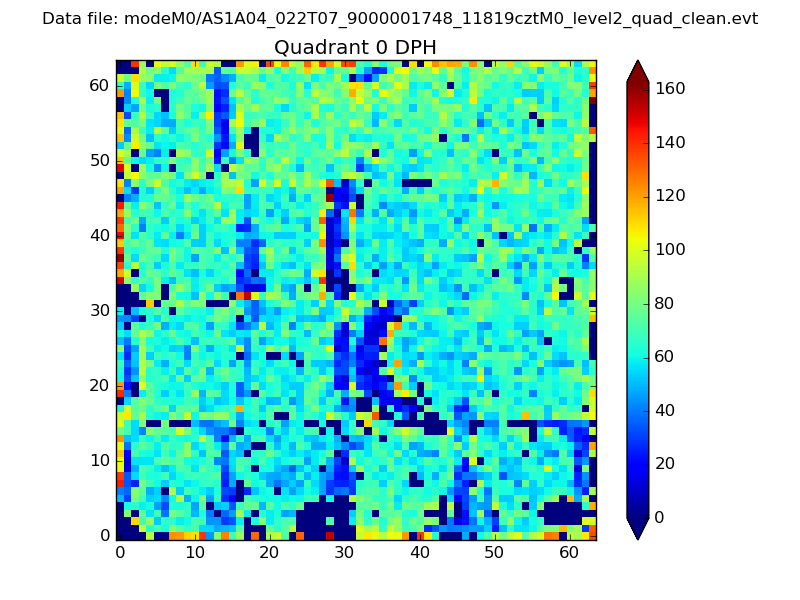 |
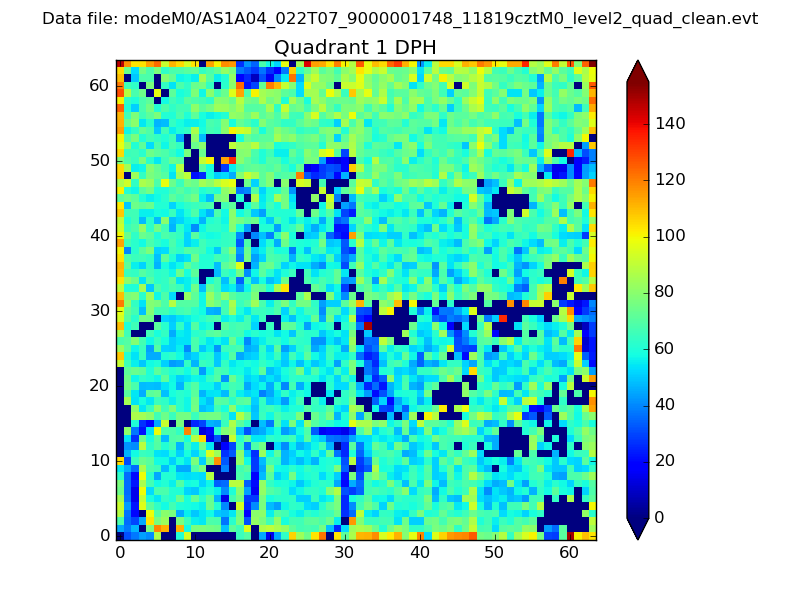 |
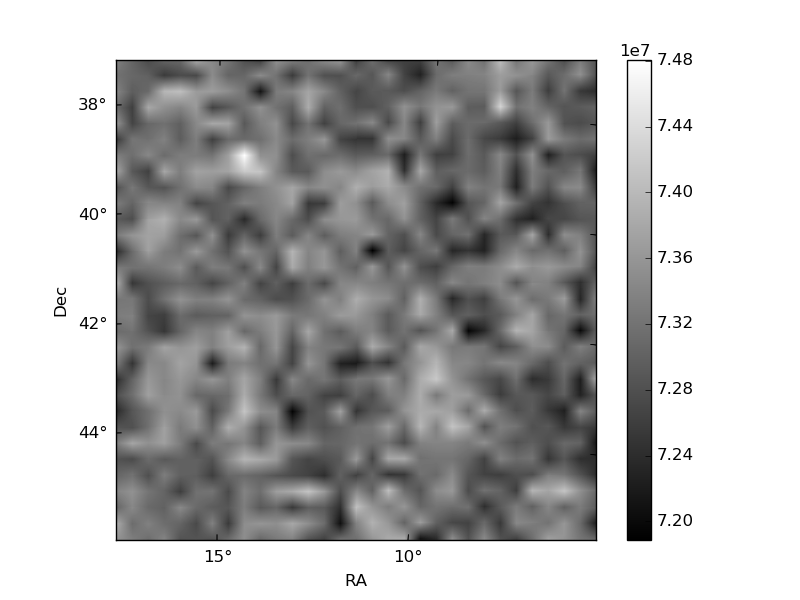
Quadrant B |
|---|---|---|---|
| Quadrant D | 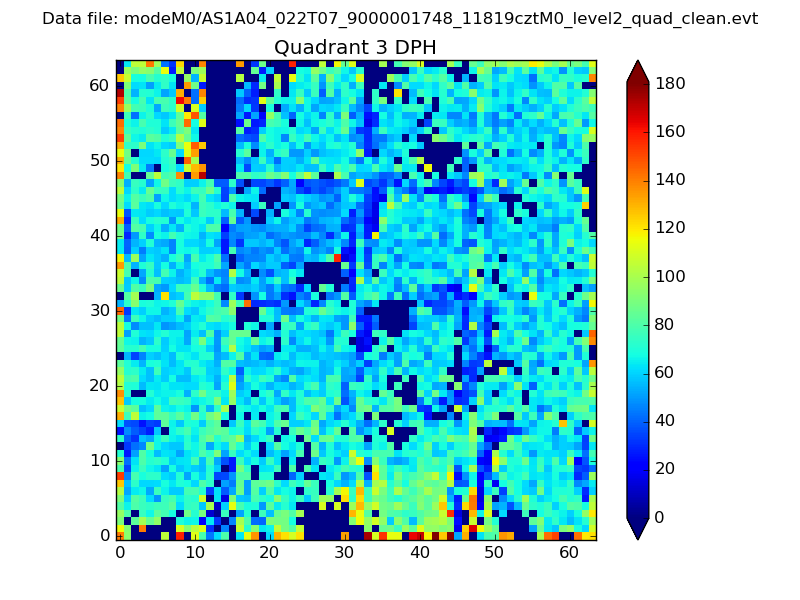 |
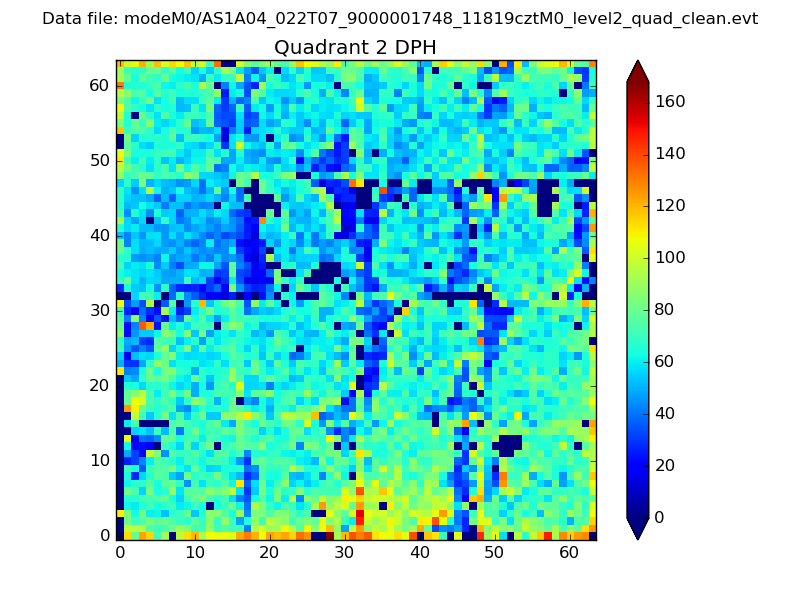 |
Quadrant C |
| Plot type | Count rate plots | Images |
|---|---|---|
| Comparison with Poisson distribution Blue bars denote a histogram of data divided into 1 sec bins. Red curve is a Poisson curve with rate = median count rate of data. |
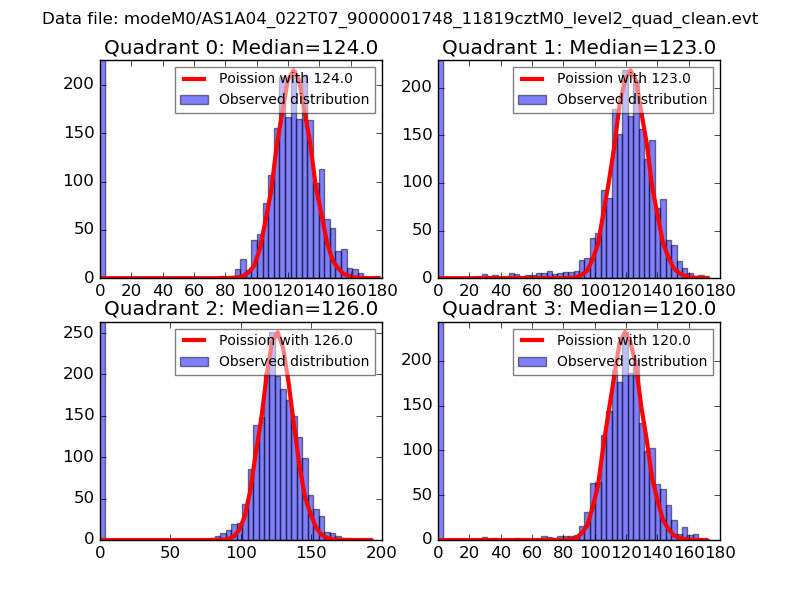 |
 |
| Quadrant-wise count rates Data is divided into 100 sec bins |
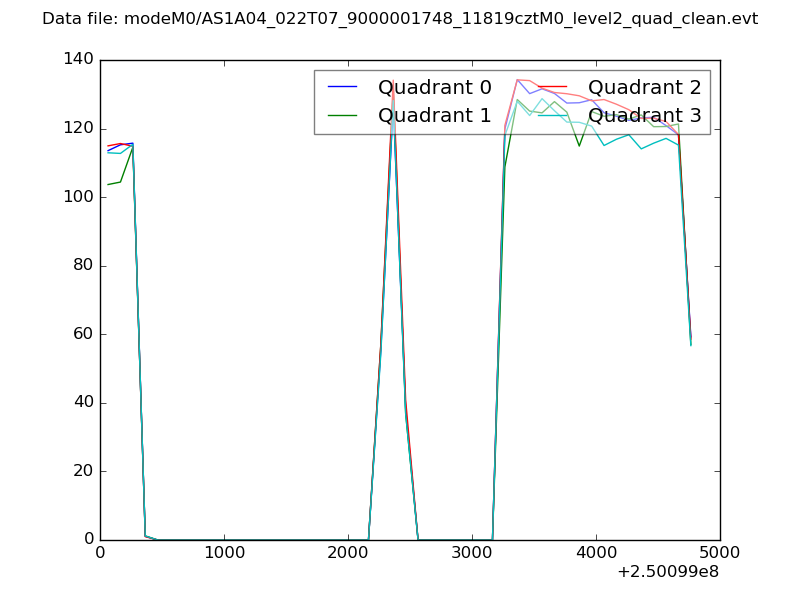 |
|
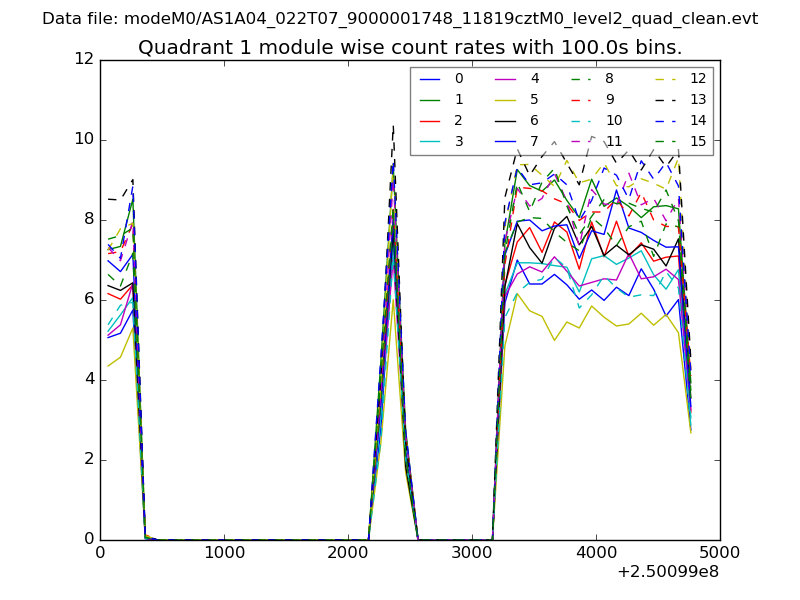
| Module-wise count rates for Quadrant A Data is divided into 100 sec bins |
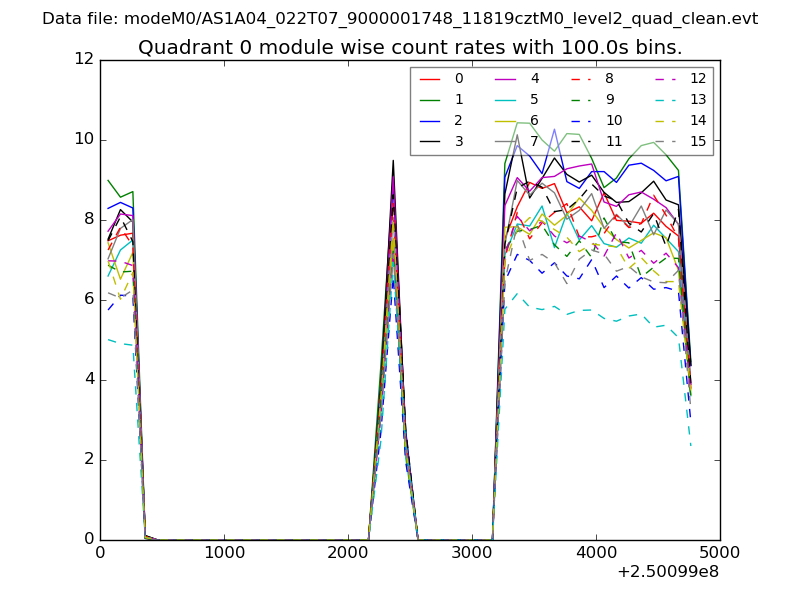 |
 |
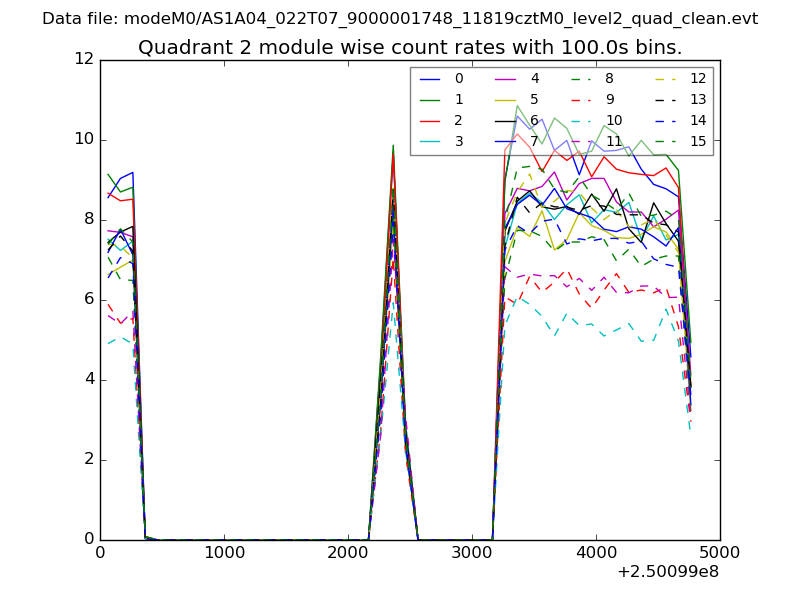
| Module-wise count rates for Quadrant B Data is divided into 100 sec bins |
 |
 |
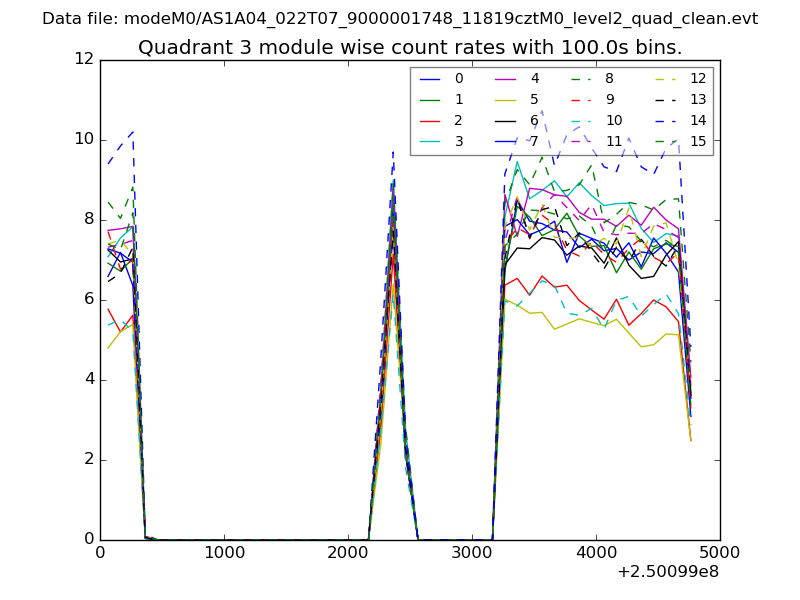
| Module-wise count rates for Quadrant C Data is divided into 100 sec bins |
 |
 |
| Module-wise count rates for Quadrant D Data is divided into 100 sec bins |
 |
 |
| Parameter | Plot |
|---|---|
| CZT HV Monitor |  |
| D_VDD | 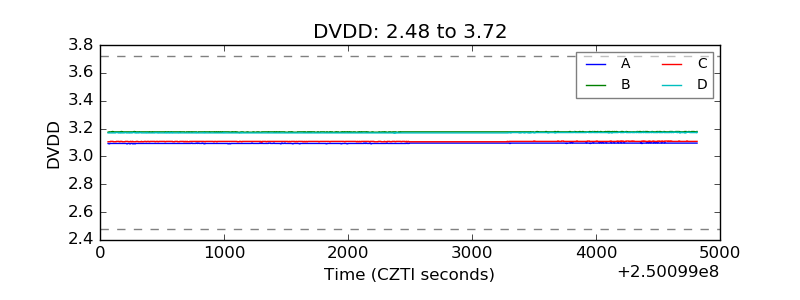 |
| Temperature 1 | 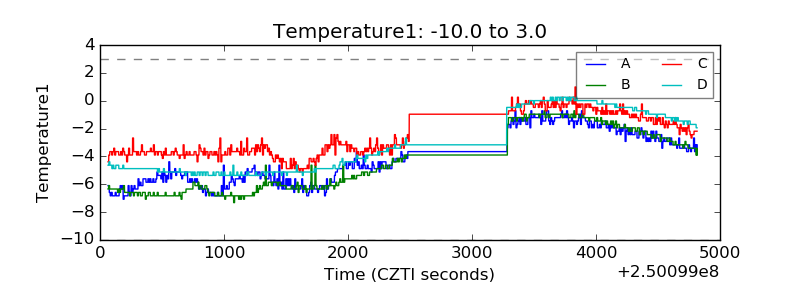 |
| Veto HV Monitor | 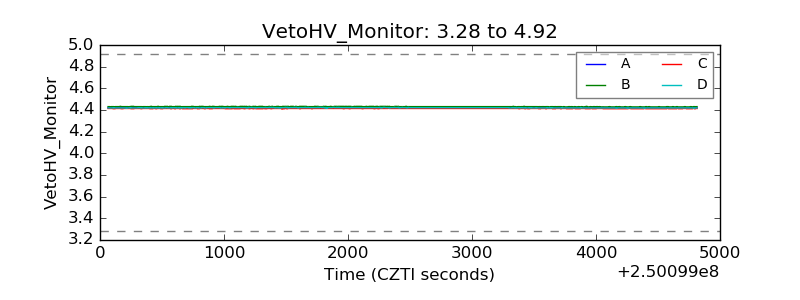 |
| Veto LLD | 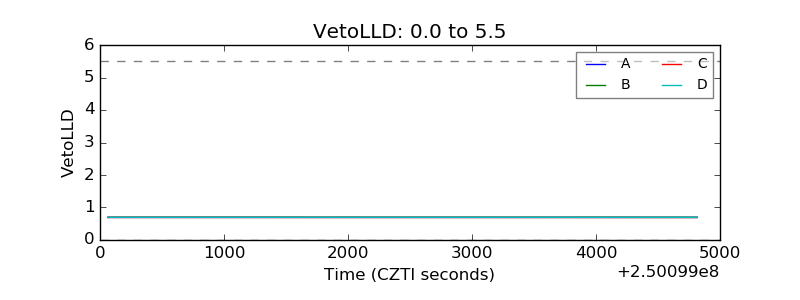 |
| Alpha Counter | 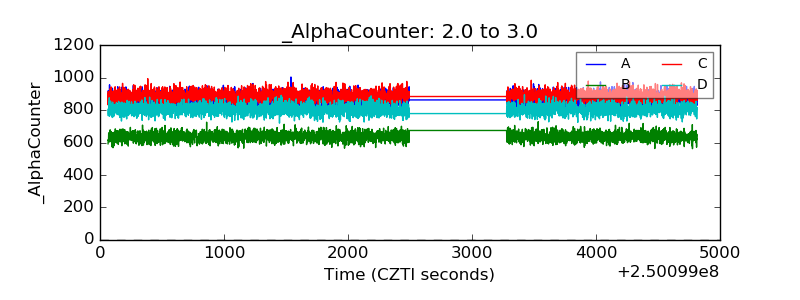 |
| _CPM_Rate | 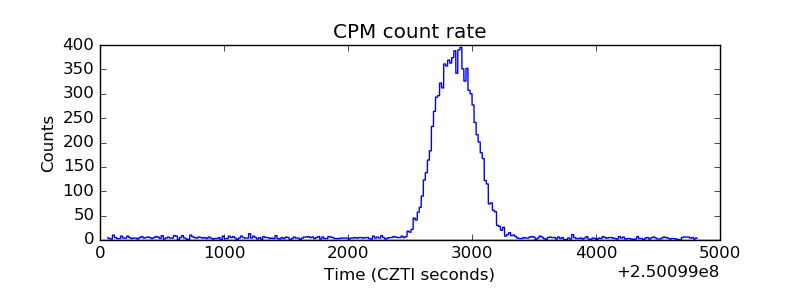 |
| CZT Counter | 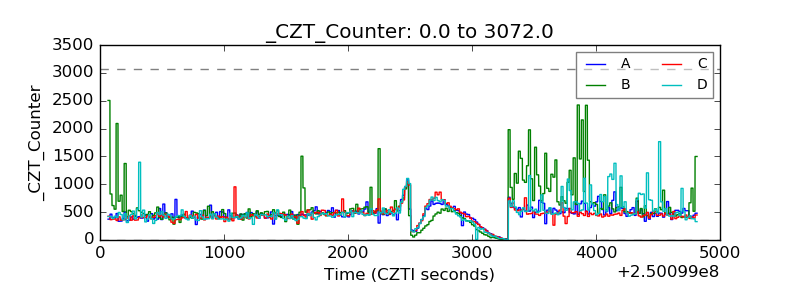 |
| +2.5 Volts monitor | 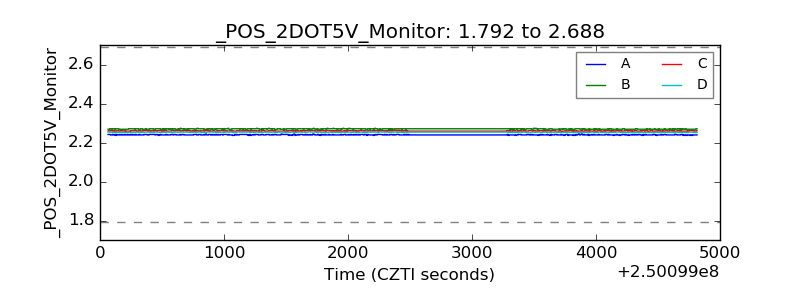 |
| +5 Volts monitor |  |
| _ROLL_ROT | 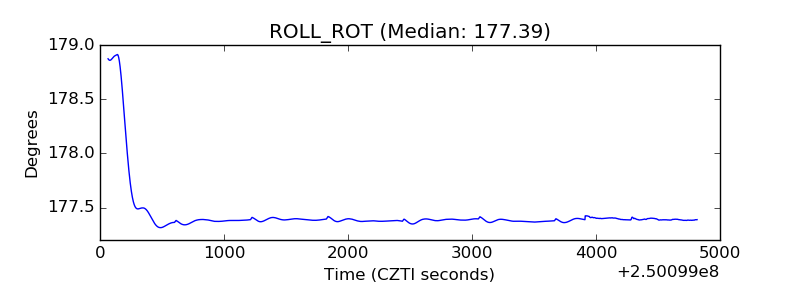 |
| _Roll_DEC | 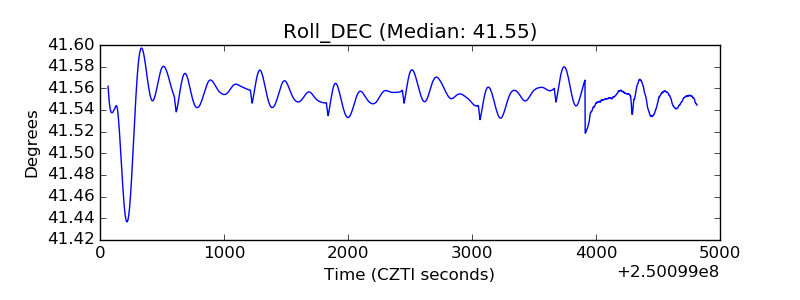 |
| _Roll_RA | 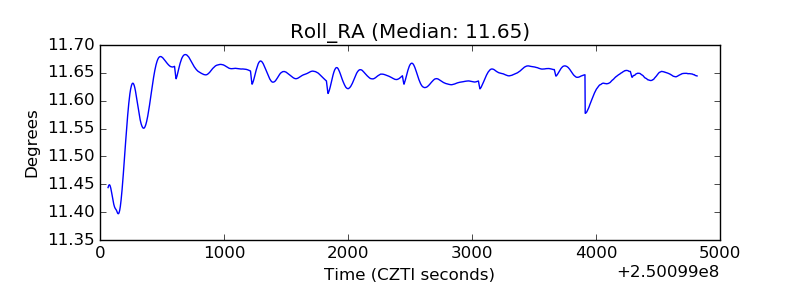 |
| Veto Counter | 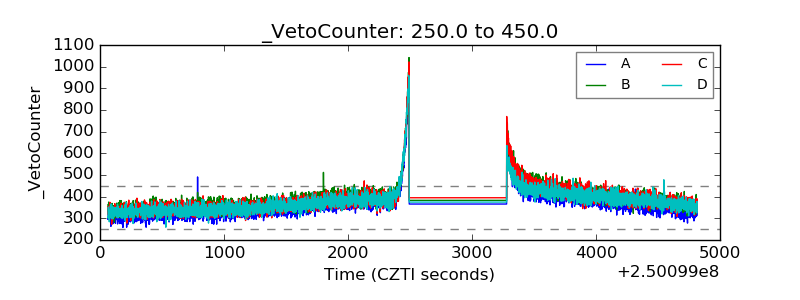 |