| Param | Original file | Final file |
|---|---|---|
| Filename | modeM0/AS1A04_022T07_9000001748_11820cztM0_level2.evt | modeM0/AS1A04_022T07_9000001748_11820cztM0_level2_quad_clean.evt |
| Size (bytes) | 566,976,960 | 93,611,520 |
| Size | 540.7 MB | 89.3 MB |
| Events in quadrant A | 3,369,445 | 603,215 |
| Events in quadrant B | 5,632,483 | 572,829 |
| Events in quadrant C | 3,062,757 | 609,273 |
| Events in quadrant D | 4,647,831 | 577,750 |
| Mode SS | |||
|---|---|---|---|
| Quadrant | BADHDUFLAG | Total packets | Discarded packets |
| A | 0 | 138 | 0 |
| B | 0 | 138 | 0 |
| C | 0 | 138 | 0 |
| D | 0 | 138 | 0 |
| Mode M9 | |||
|---|---|---|---|
| Quadrant | BADHDUFLAG | Total packets | Discarded packets |
| A | 0 | 10 | 0 |
| B | 0 | 10 | 0 |
| C | 0 | 10 | 0 |
| D | 0 | 11 | 0 |
| Mode M0 | |||
|---|---|---|---|
| Quadrant | BADHDUFLAG | Total packets | Discarded packets |
| A | 0 | 14544 | 3 |
| B | 0 | 21302 | 2 |
| C | 0 | 13813 | 2 |
| D | 0 | 18458 | 2 |
| Quadrant | Total seconds | Saturated seconds | Saturation percentage |
|---|---|---|---|
| A | 6763 | 71 | 1.049830% |
| B | 6763 | 648 | 9.581547% |
| C | 6763 | 35 | 0.517522% |
| D | 6763 | 180 | 2.661541% |
Noise dominated data is calculated using 1-second bins in cleaned event files. If a bin has >2000 counts, and if more than 50% of those come from <1% of pixels, then it is considered to be noise-dominated and hence unusable.
| Quadrant | # 1 sec bins | Bins with >0 counts | Bins with >2000 counts | High rate bins dominated by noise | Noise dominated (total time) | Noise dominated (detector-on time) | Marked lightcurve |
|---|---|---|---|---|---|---|---|
| A | 7704 | 6765 | 0 | 0 | 0.00% | 0.00% | 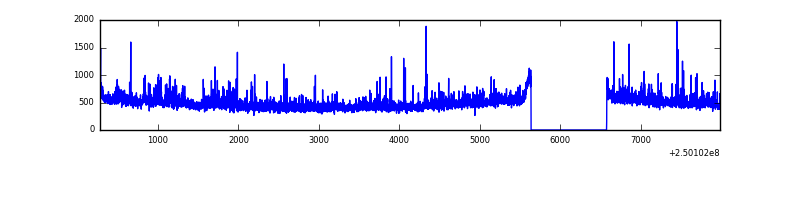 |
| B | 7704 | 6765 | 405 | 405 | 5.26% | 5.99% | 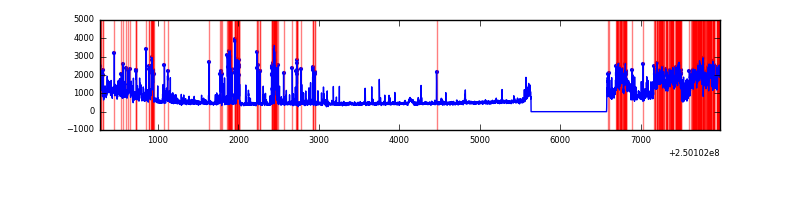 |
| C | 7704 | 6765 | 0 | 0 | 0.00% | 0.00% | 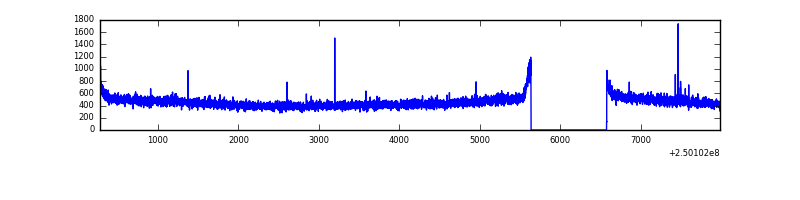 |
| D | 7704 | 6765 | 117 | 117 | 1.52% | 1.73% | 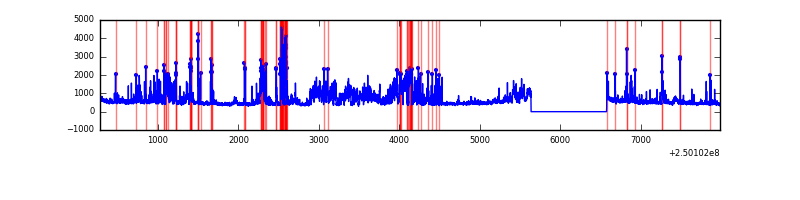 |
Top three noisy pixels from each quadrant. If the there are fewer than three noisy pixels in the level2.evt file, extra rows are filled as -1
| Pixel properties | Quadrant properties | ||||||
|---|---|---|---|---|---|---|---|
| Quadrant | DetID | PixID | Counts | Sigma | Mean | Median | Sigma |
| A | 1 | 162 | 120116 | 738.25 | 794 | 776 | 161.7 |
| A | 1 | 178 | 61807 | 377.54 | 794 | 776 | 161.7 |
| A | 1 | 161 | 54498 | 332.33 | 794 | 776 | 161.7 |
| B | 10 | 16 | 1321315 | 8959.61 | 777 | 758 | 147.4 |
| B | 4 | 239 | 686348 | 4651.53 | 777 | 758 | 147.4 |
| B | 15 | 185 | 293644 | 1987.15 | 777 | 758 | 147.4 |
| C | 0 | 207 | 6160 | 29.27 | 782 | 785 | 183.7 |
| C | 13 | 61 | 5768 | 27.13 | 782 | 785 | 183.7 |
| C | 8 | 208 | 4922 | 22.53 | 782 | 785 | 183.7 |
| D | 13 | 122 | 881355 | 4665.83 | 774 | 752 | 188.7 |
| D | 1 | 52 | 176901 | 933.32 | 774 | 752 | 188.7 |
| D | 13 | 249 | 174402 | 920.07 | 774 | 752 | 188.7 |
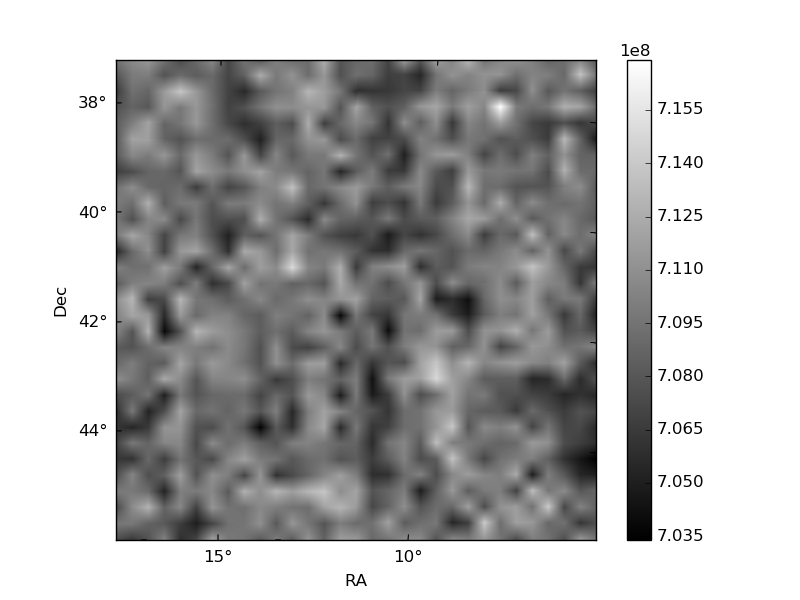
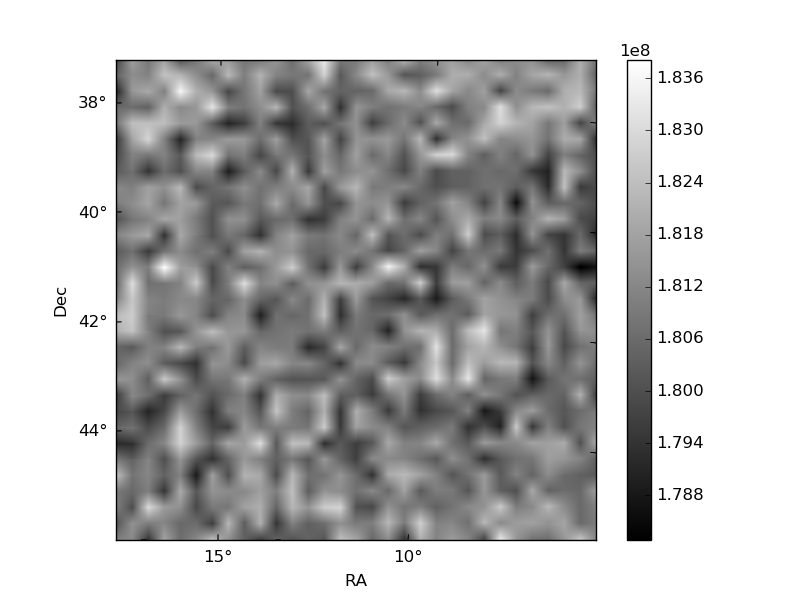
Histogram calculated using DETX and DETY for each event in the final _common_clean file
| Quadrant A | 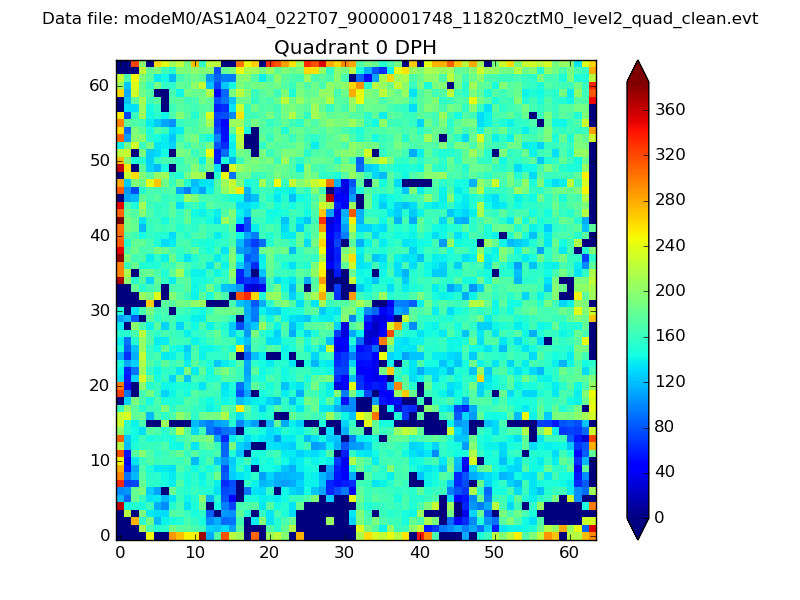 |
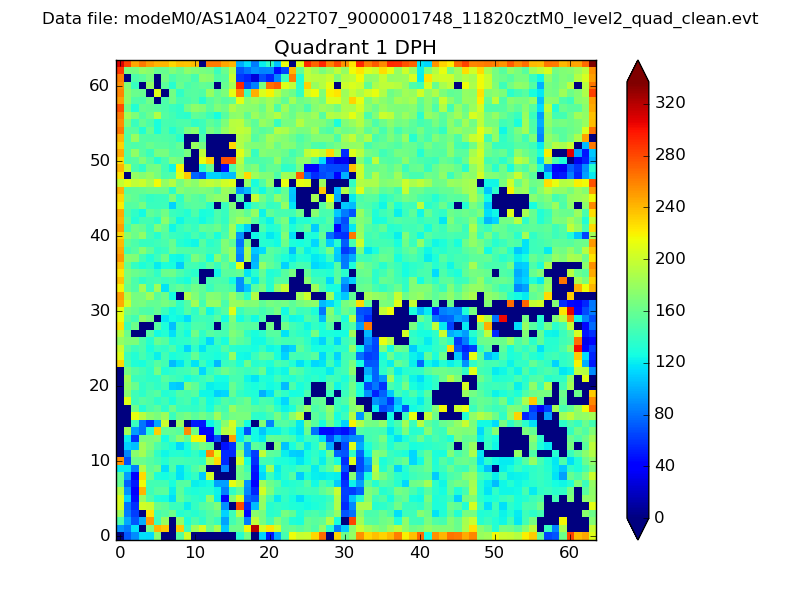 |
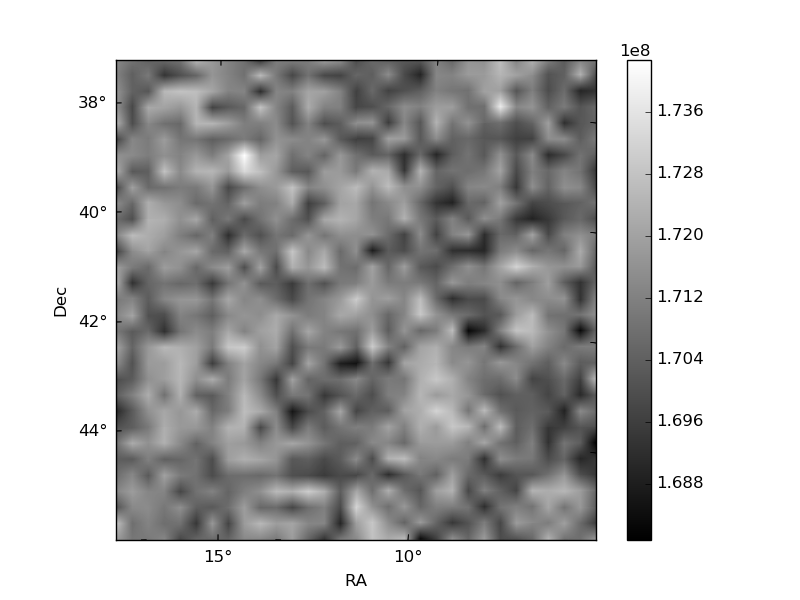
Quadrant B |
|---|---|---|---|
| Quadrant D | 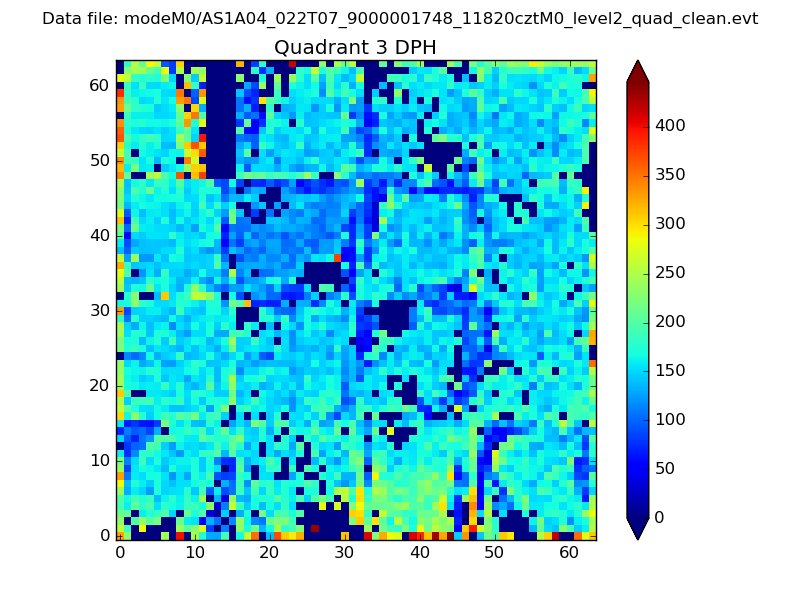 |
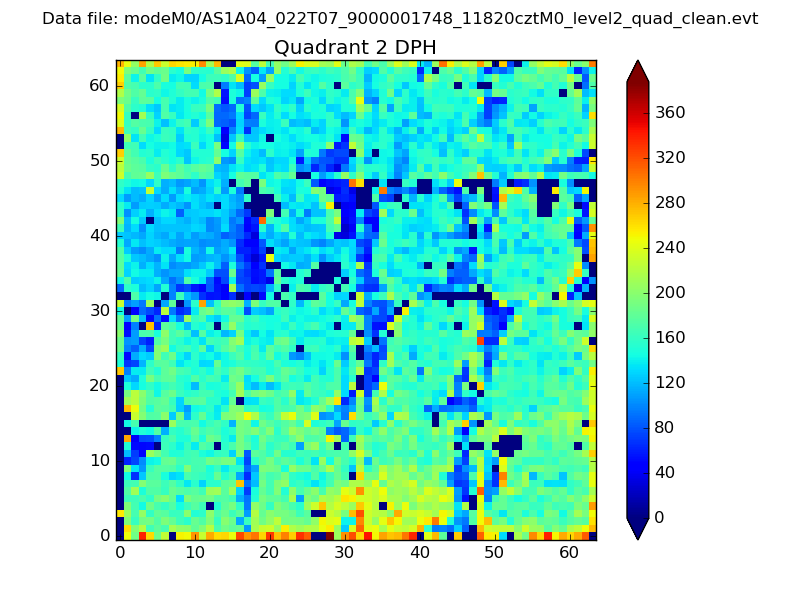 |
Quadrant C |
| Plot type | Count rate plots | Images |
|---|---|---|
| Comparison with Poisson distribution Blue bars denote a histogram of data divided into 1 sec bins. Red curve is a Poisson curve with rate = median count rate of data. |
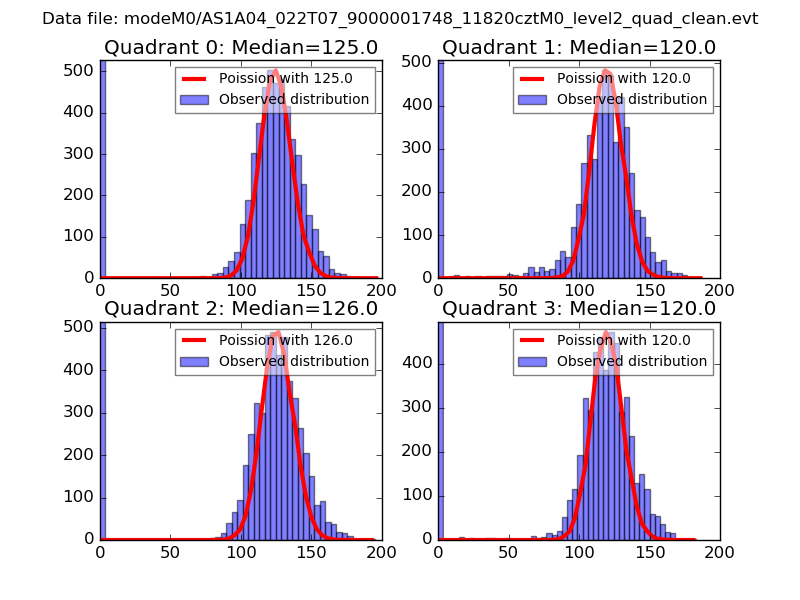 |
 |
| Quadrant-wise count rates Data is divided into 100 sec bins |
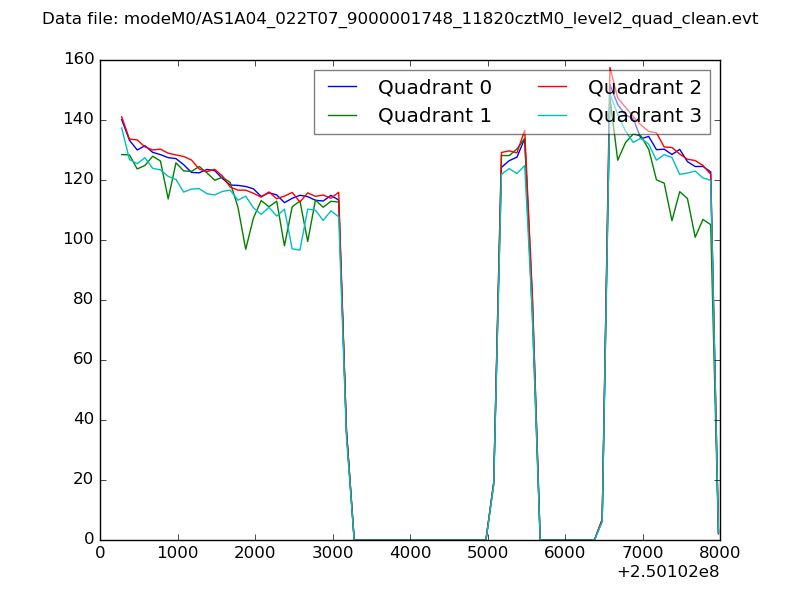 |
|
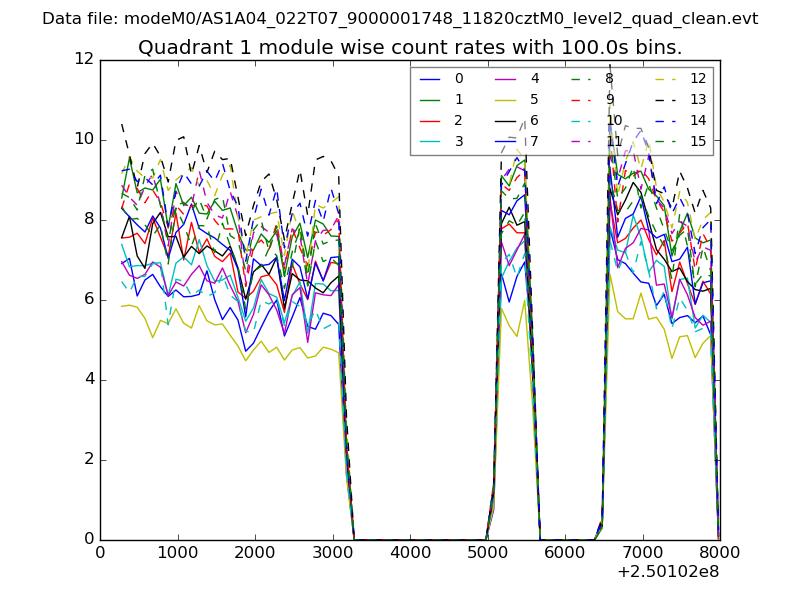
| Module-wise count rates for Quadrant A Data is divided into 100 sec bins |
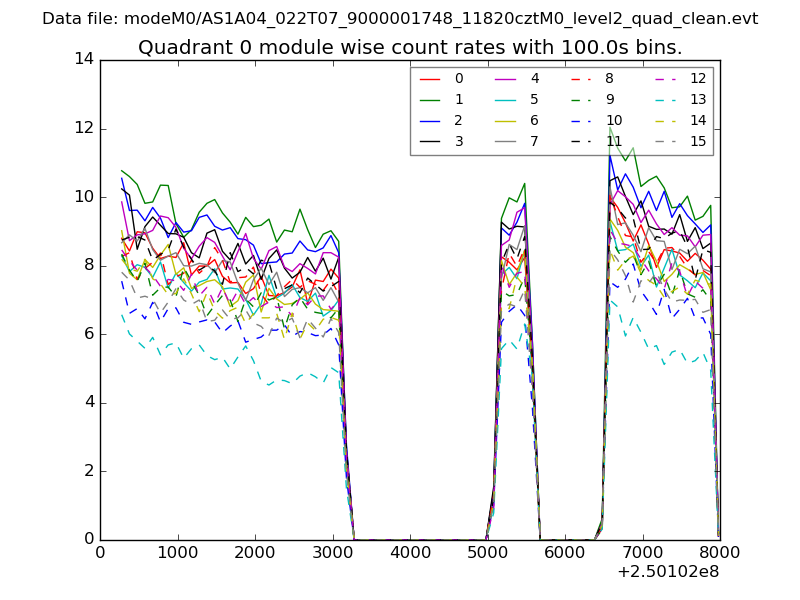 |
 |
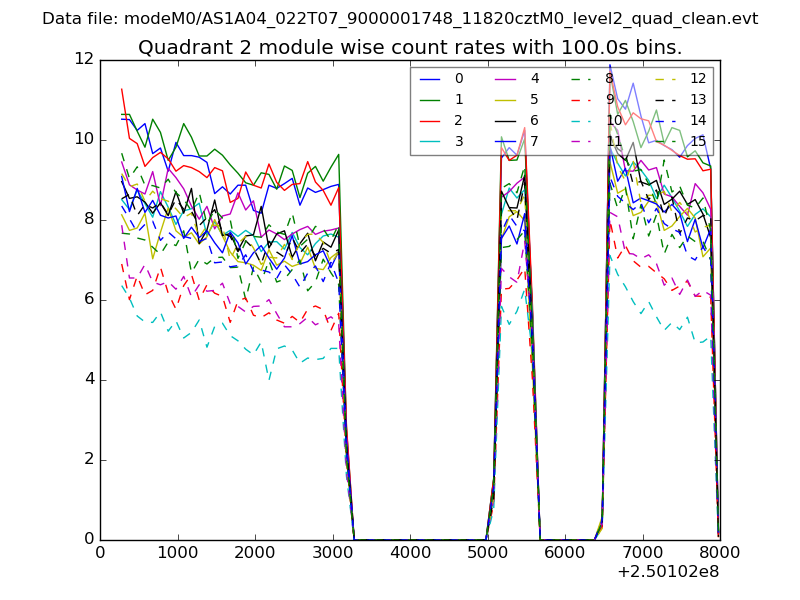
| Module-wise count rates for Quadrant B Data is divided into 100 sec bins |
 |
 |
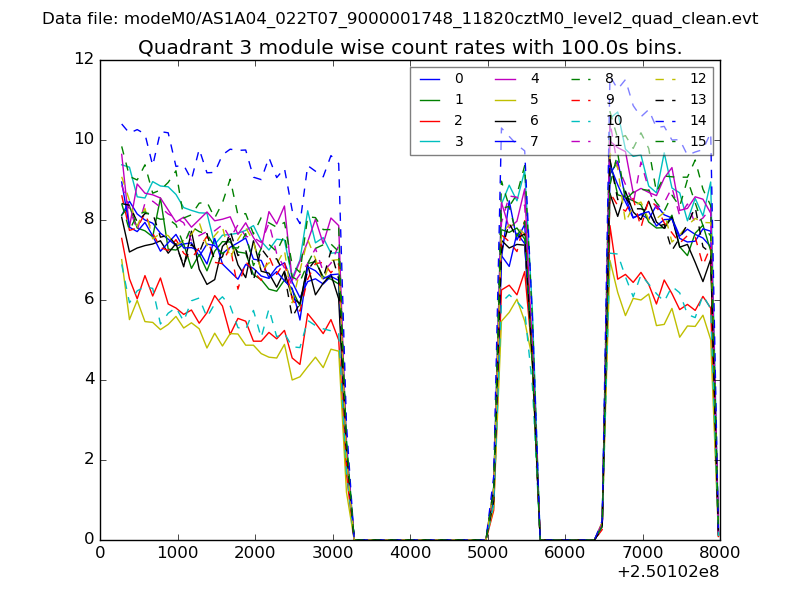
| Module-wise count rates for Quadrant C Data is divided into 100 sec bins |
 |
 |
| Module-wise count rates for Quadrant D Data is divided into 100 sec bins |
 |
 |
| Parameter | Plot |
|---|---|
| CZT HV Monitor | 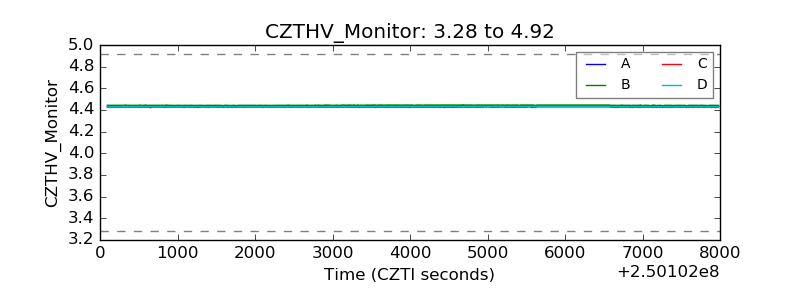 |
| D_VDD | 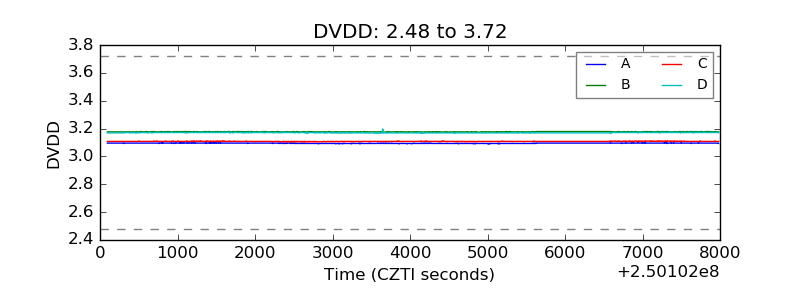 |
| Temperature 1 | 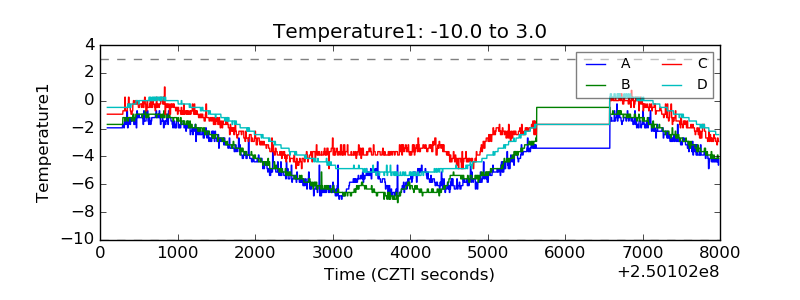 |
| Veto HV Monitor |  |
| Veto LLD | 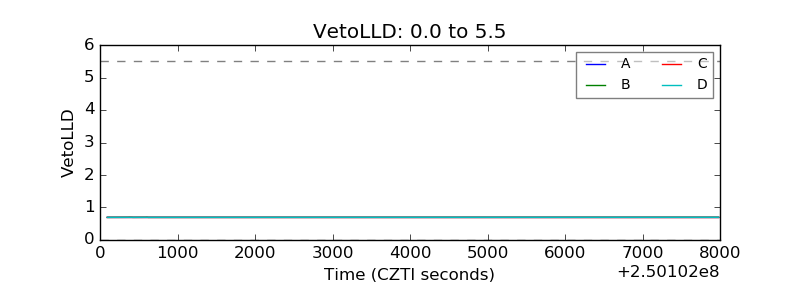 |
| Alpha Counter | 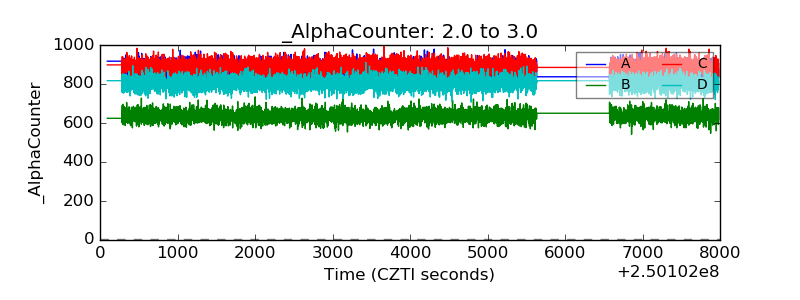 |
| _CPM_Rate | 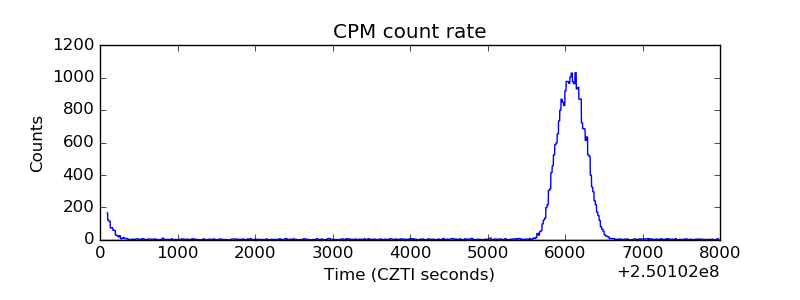 |
| CZT Counter | 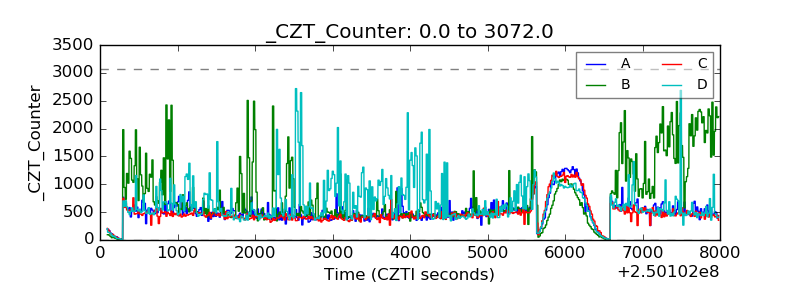 |
| +2.5 Volts monitor |  |
| +5 Volts monitor |  |
| _ROLL_ROT | 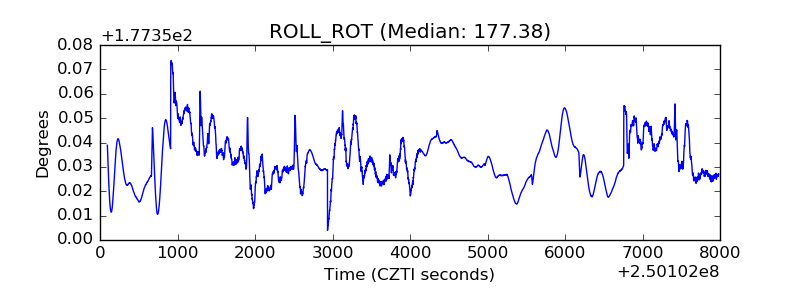 |
| _Roll_DEC | 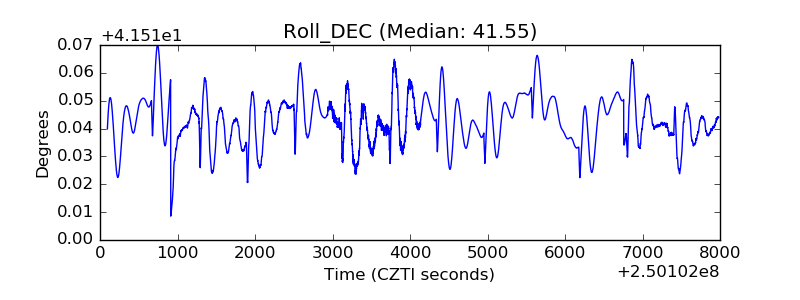 |
| _Roll_RA | 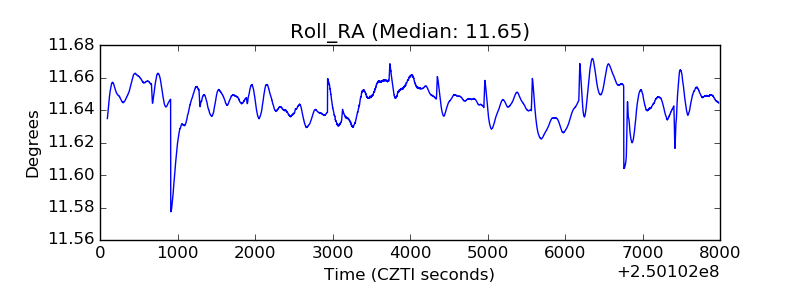 |
| Veto Counter | 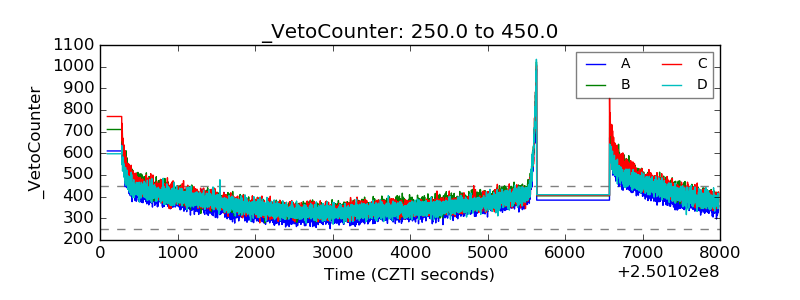 |