| Param | Original file | Final file |
|---|---|---|
| Filename | modeM0/AS1A04_022T07_9000001748_11823cztM0_level2.evt | modeM0/AS1A04_022T07_9000001748_11823cztM0_level2_quad_clean.evt |
| Size (bytes) | 588,588,480 | 94,576,320 |
| Size | 561.3 MB | 90.2 MB |
| Events in quadrant A | 3,287,963 | 622,202 |
| Events in quadrant B | 7,516,433 | 588,964 |
| Events in quadrant C | 2,968,613 | 623,370 |
| Events in quadrant D | 3,622,261 | 586,329 |
| Mode SS | |||
|---|---|---|---|
| Quadrant | BADHDUFLAG | Total packets | Discarded packets |
| A | 0 | 130 | 0 |
| B | 0 | 130 | 0 |
| C | 0 | 130 | 0 |
| D | 0 | 130 | 0 |
| Mode M9 | |||
|---|---|---|---|
| Quadrant | BADHDUFLAG | Total packets | Discarded packets |
| A | 0 | 19 | 0 |
| B | 0 | 19 | 0 |
| C | 0 | 19 | 0 |
| D | 0 | 20 | 0 |
| Mode M0 | |||
|---|---|---|---|
| Quadrant | BADHDUFLAG | Total packets | Discarded packets |
| A | 0 | 14052 | 3 |
| B | 0 | 26798 | 2 |
| C | 0 | 13083 | 2 |
| D | 0 | 15260 | 2 |
| Quadrant | Total seconds | Saturated seconds | Saturation percentage |
|---|---|---|---|
| A | 6344 | 51 | 0.803909% |
| B | 6344 | 1377 | 21.705549% |
| C | 6344 | 19 | 0.299496% |
| D | 6344 | 178 | 2.805801% |
Noise dominated data is calculated using 1-second bins in cleaned event files. If a bin has >2000 counts, and if more than 50% of those come from <1% of pixels, then it is considered to be noise-dominated and hence unusable.
| Quadrant | # 1 sec bins | Bins with >0 counts | Bins with >2000 counts | High rate bins dominated by noise | Noise dominated (total time) | Noise dominated (detector-on time) | Marked lightcurve |
|---|---|---|---|---|---|---|---|
| A | 7565 | 6346 | 3 | 3 | 0.04% | 0.05% | 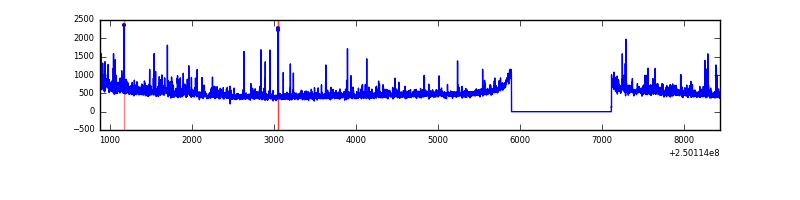 |
| B | 7565 | 6346 | 1112 | 1112 | 14.70% | 17.52% | 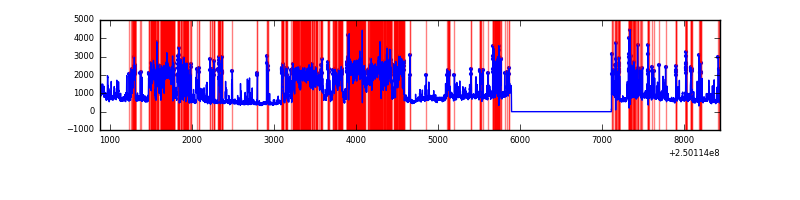 |
| C | 7565 | 6346 | 0 | 0 | 0.00% | 0.00% | 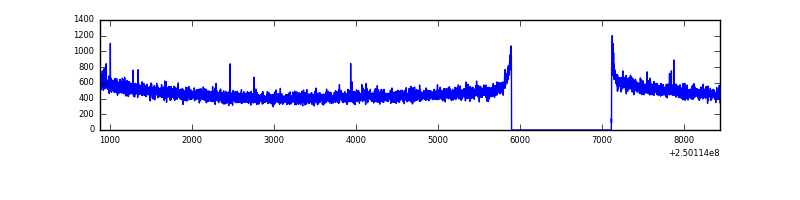 |
| D | 7565 | 6346 | 153 | 153 | 2.02% | 2.41% | 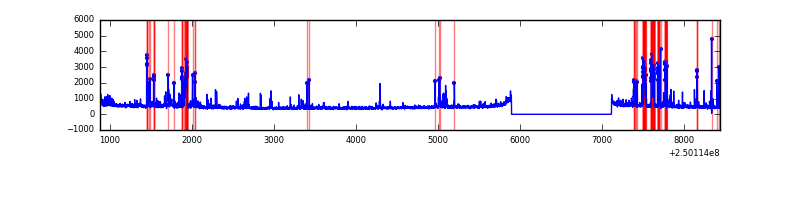 |
Top three noisy pixels from each quadrant. If the there are fewer than three noisy pixels in the level2.evt file, extra rows are filled as -1
| Pixel properties | Quadrant properties | ||||||
|---|---|---|---|---|---|---|---|
| Quadrant | DetID | PixID | Counts | Sigma | Mean | Median | Sigma |
| A | 1 | 162 | 121760 | 777.91 | 769 | 754 | 155.6 |
| A | 1 | 178 | 60293 | 382.76 | 769 | 754 | 155.6 |
| A | 1 | 161 | 53745 | 340.66 | 769 | 754 | 155.6 |
| B | 10 | 16 | 2227559 | 16456.81 | 722 | 704 | 135.3 |
| B | 3 | 64 | 1154119 | 8523.92 | 722 | 704 | 135.3 |
| B | 4 | 239 | 994265 | 7342.57 | 722 | 704 | 135.3 |
| C | 1 | 16 | 6315 | 31.25 | 758 | 763 | 177.7 |
| C | 13 | 61 | 5569 | 27.05 | 758 | 763 | 177.7 |
| C | 0 | 207 | 4004 | 18.24 | 758 | 763 | 177.7 |
| D | 9 | 85 | 293574 | 1651.25 | 742 | 722 | 177.4 |
| D | 1 | 52 | 225006 | 1264.63 | 742 | 722 | 177.4 |
| D | 10 | 253 | 102790 | 575.51 | 742 | 722 | 177.4 |
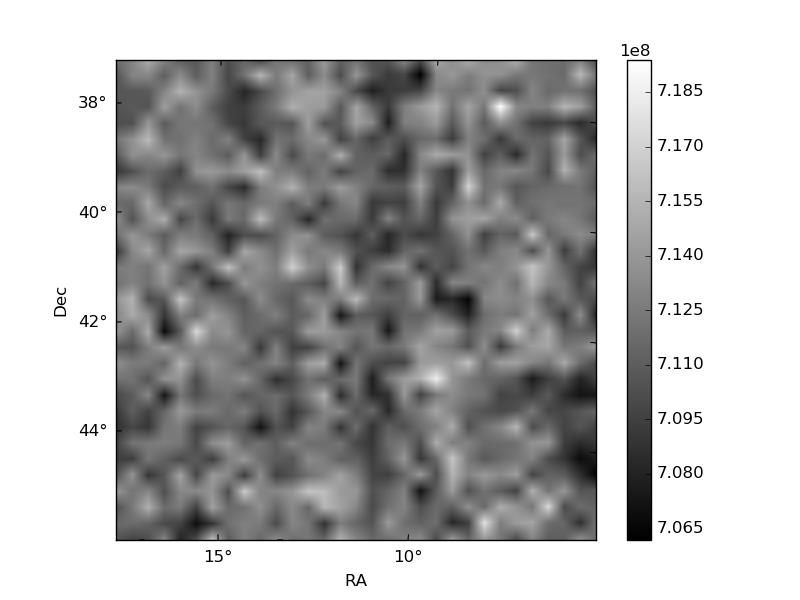
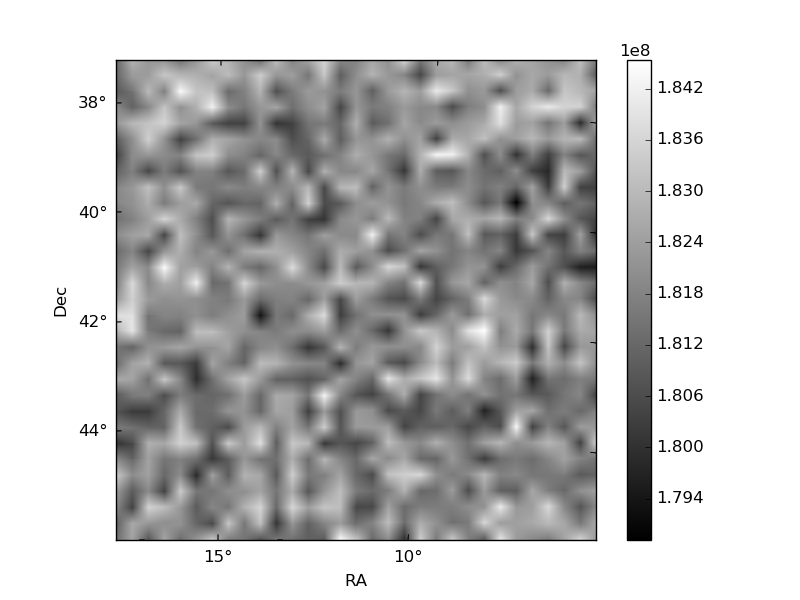
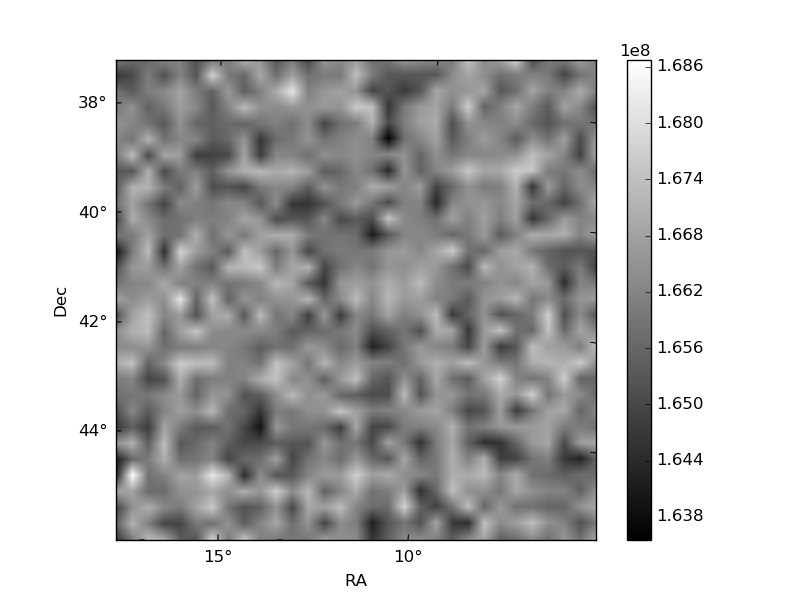
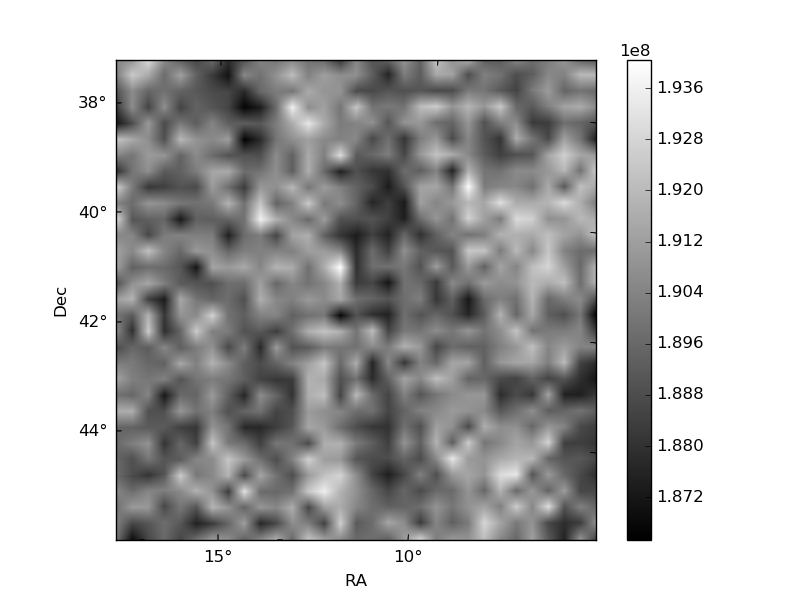
Histogram calculated using DETX and DETY for each event in the final _common_clean file
| Quadrant A | 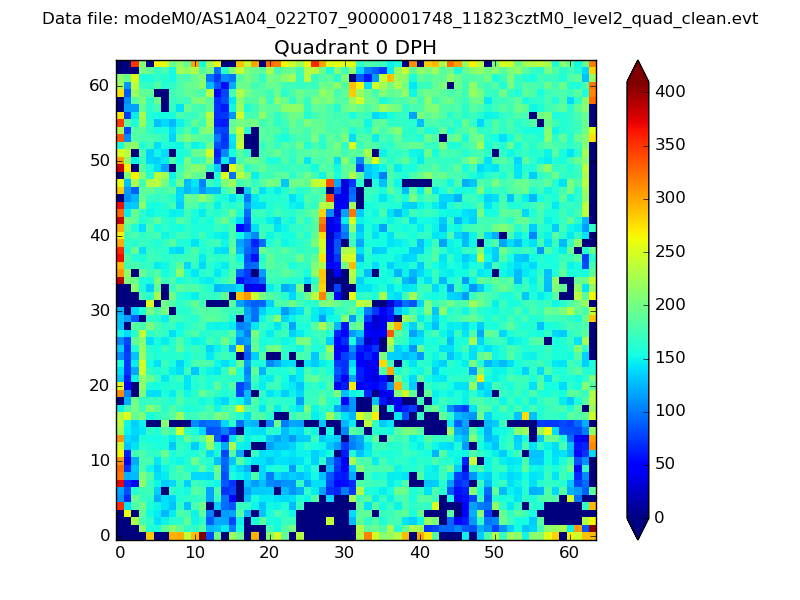 |
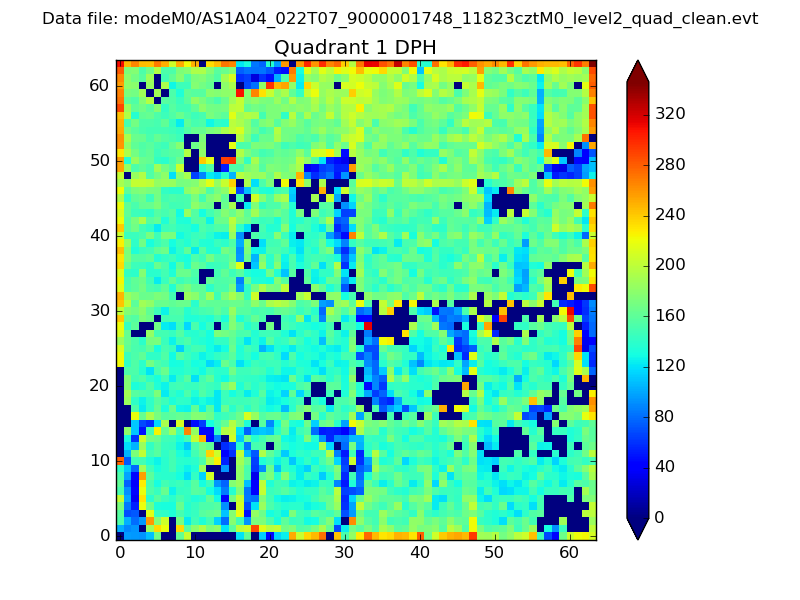 |
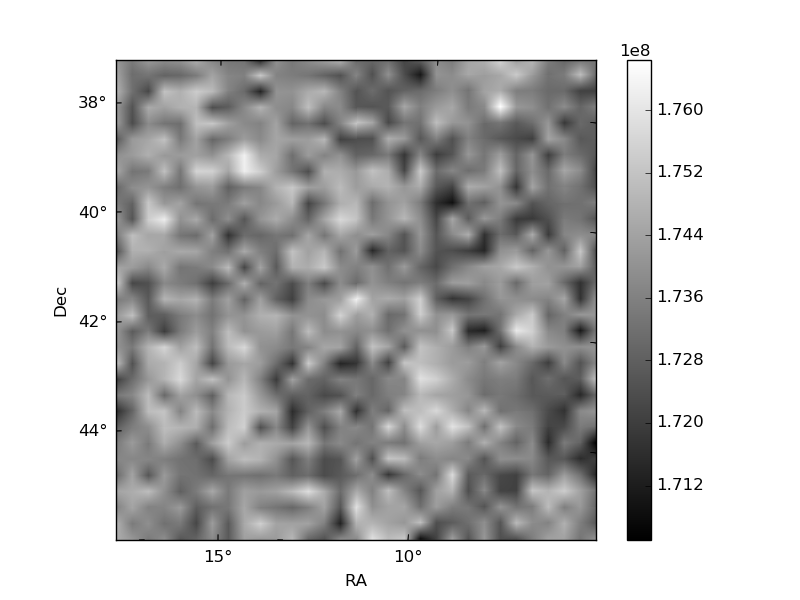
Quadrant B |
|---|---|---|---|
| Quadrant D | 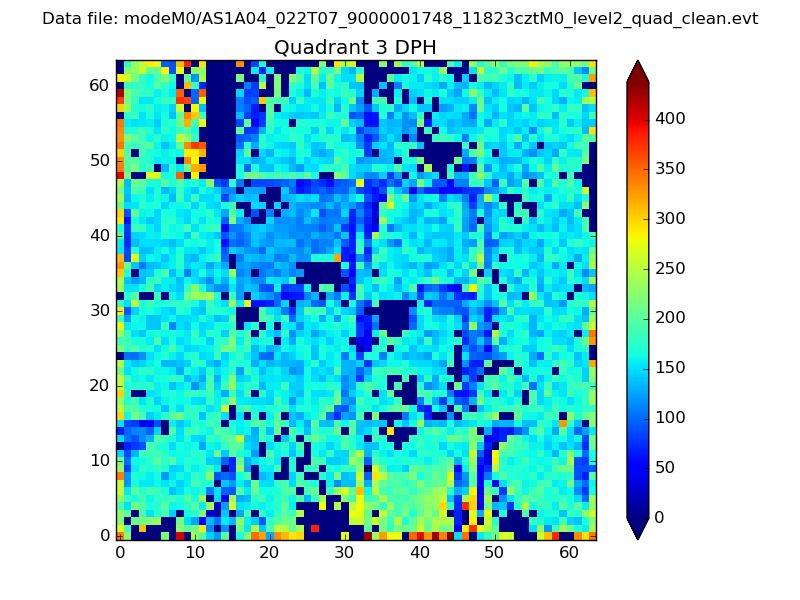 |
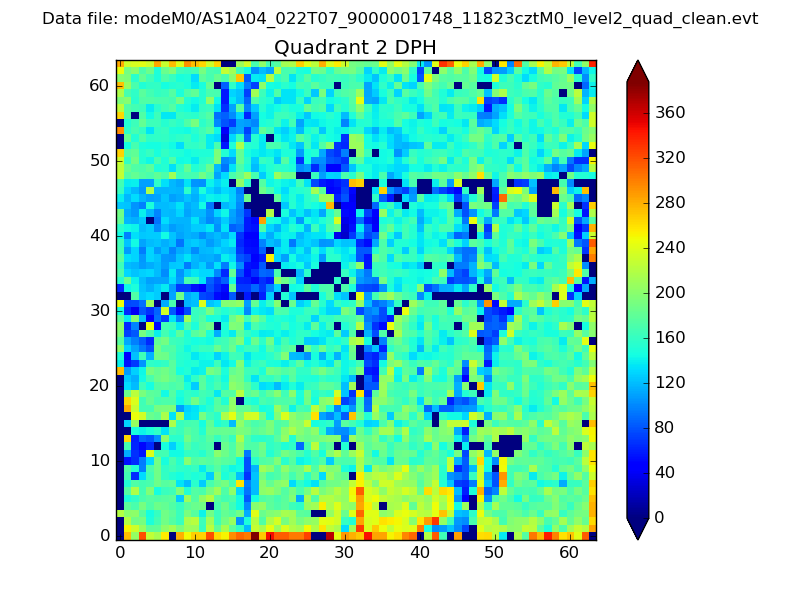 |
Quadrant C |
| Plot type | Count rate plots | Images |
|---|---|---|
| Comparison with Poisson distribution Blue bars denote a histogram of data divided into 1 sec bins. Red curve is a Poisson curve with rate = median count rate of data. |
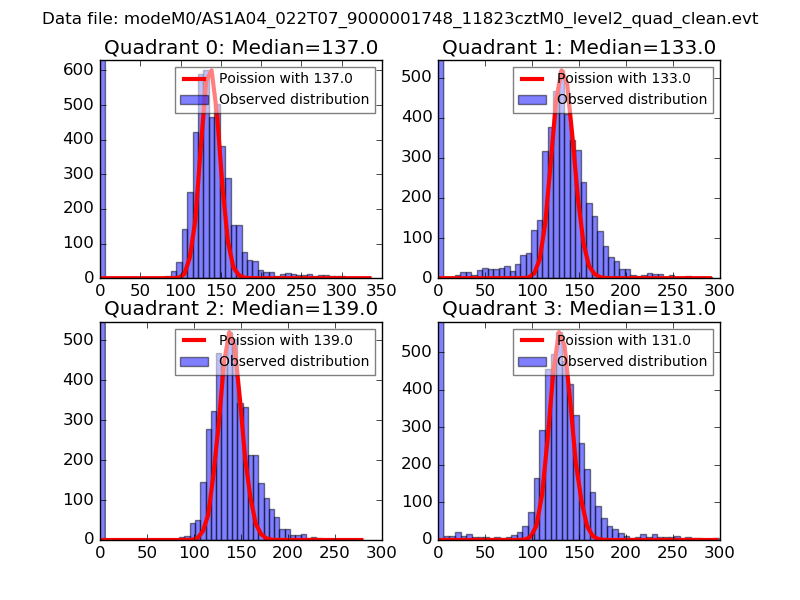 |
 |
| Quadrant-wise count rates Data is divided into 100 sec bins |
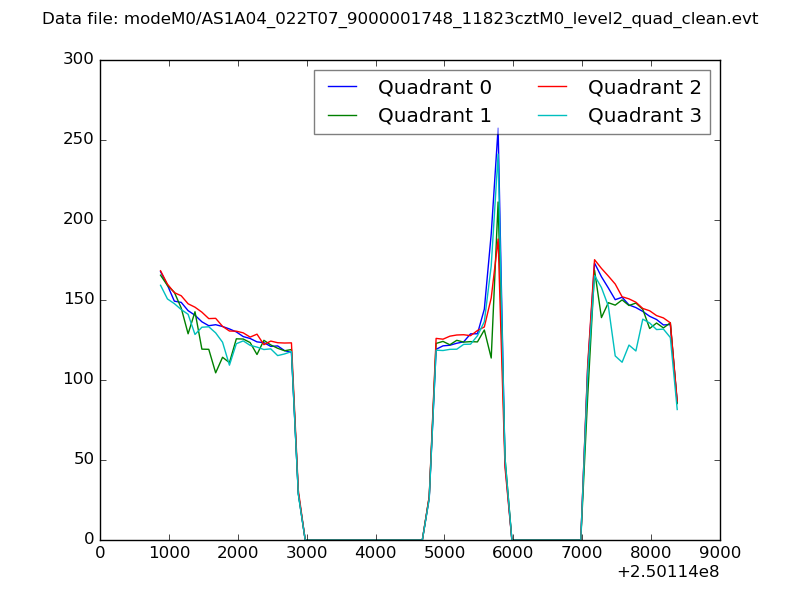 |
|
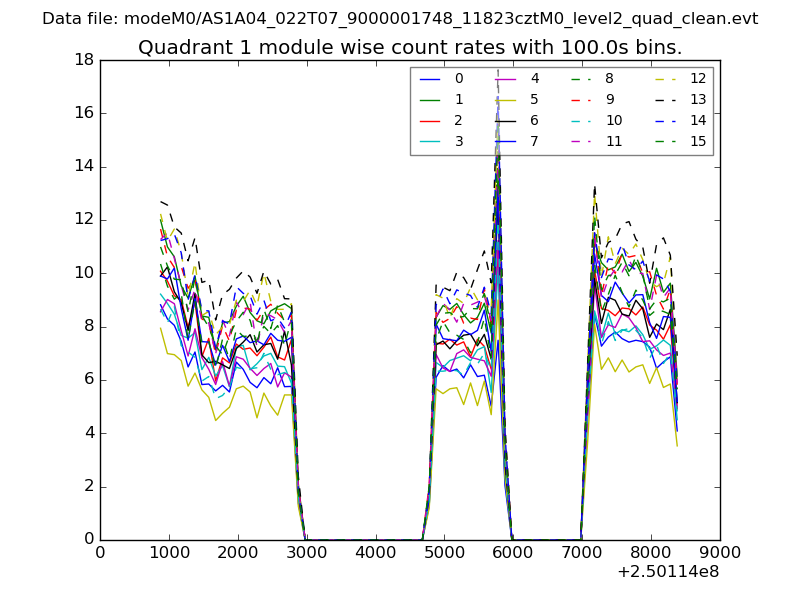
| Module-wise count rates for Quadrant A Data is divided into 100 sec bins |
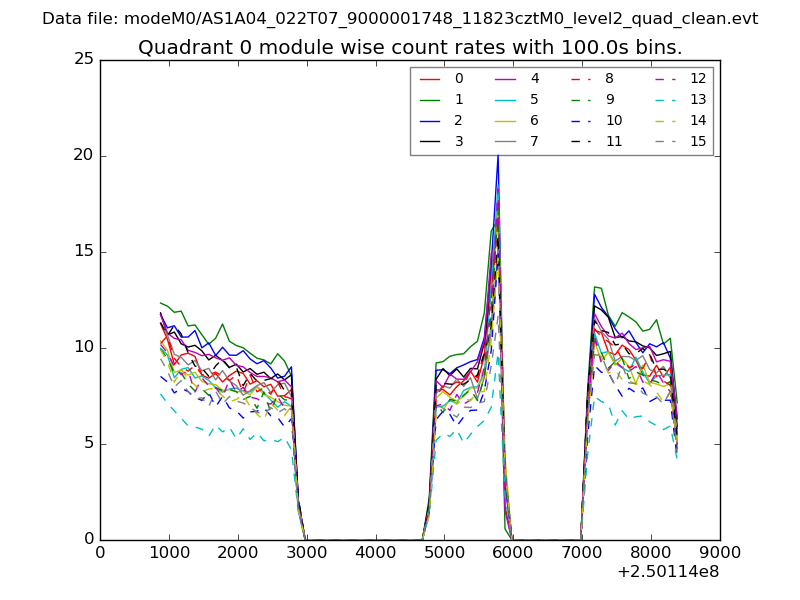 |
 |
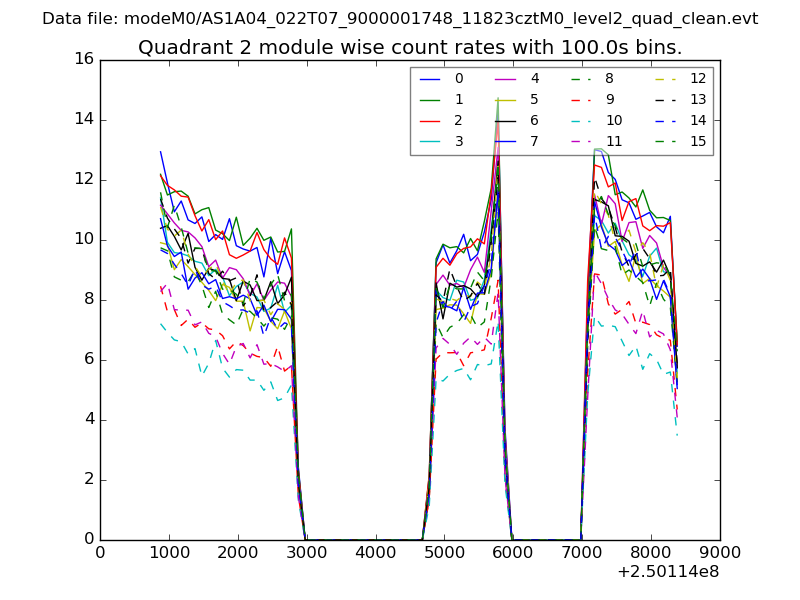
| Module-wise count rates for Quadrant B Data is divided into 100 sec bins |
 |
 |
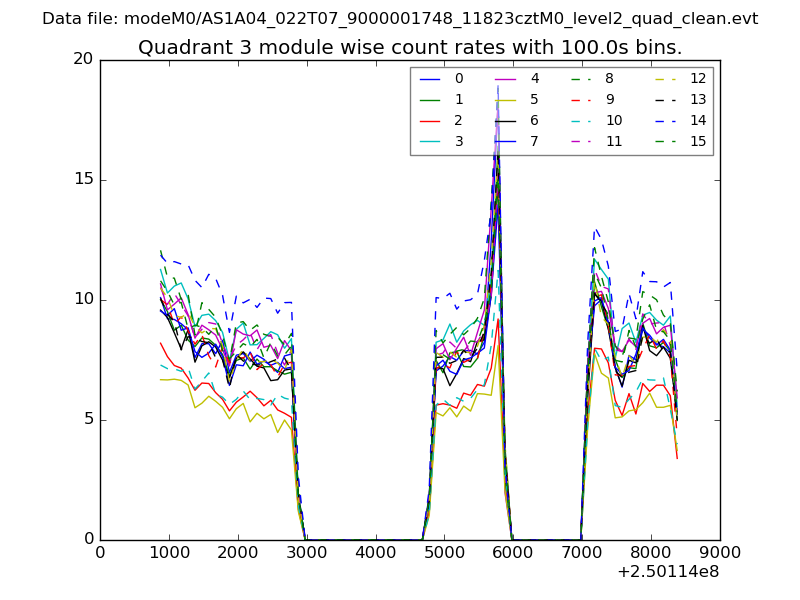
| Module-wise count rates for Quadrant C Data is divided into 100 sec bins |
 |
 |
| Module-wise count rates for Quadrant D Data is divided into 100 sec bins |
 |
 |
| Parameter | Plot |
|---|---|
| CZT HV Monitor | 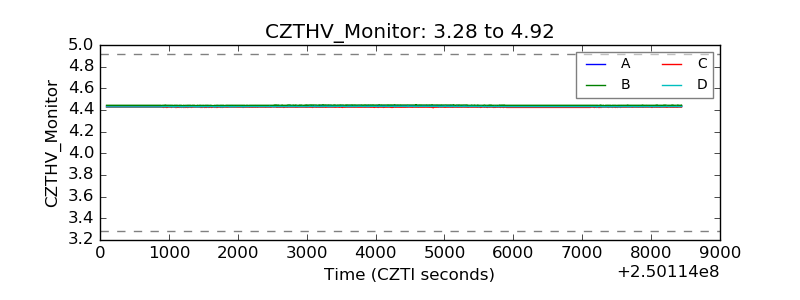 |
| D_VDD | 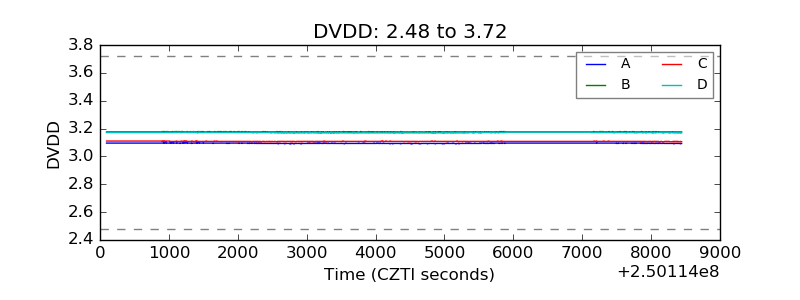 |
| Temperature 1 | 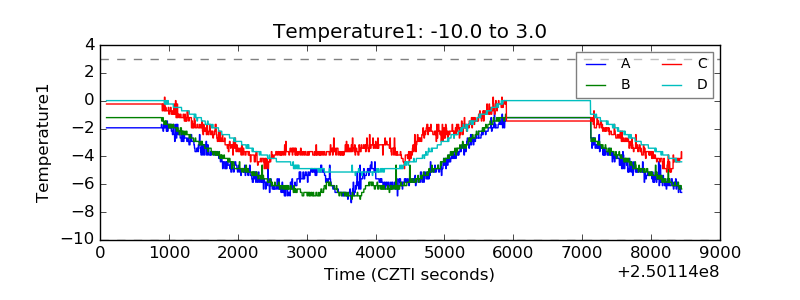 |
| Veto HV Monitor | 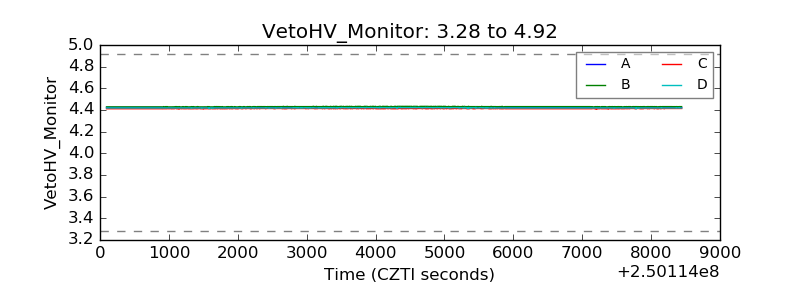 |
| Veto LLD | 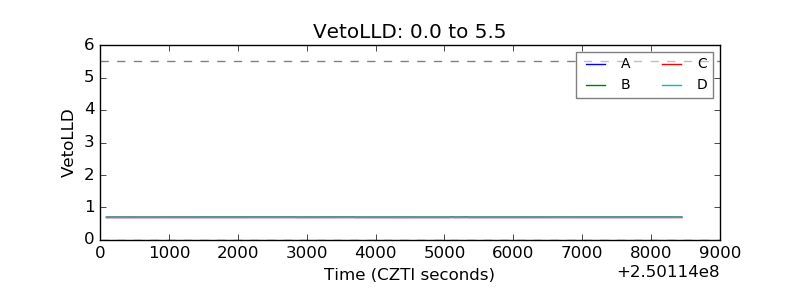 |
| Alpha Counter | 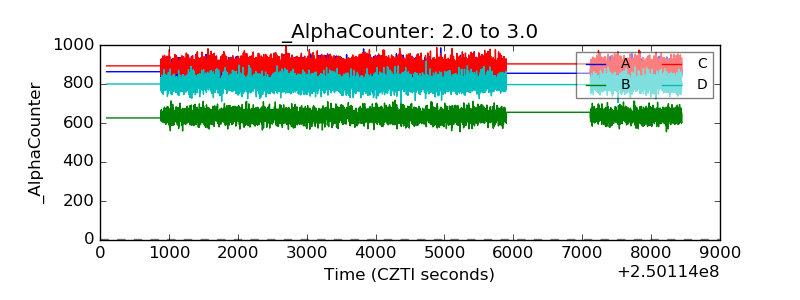 |
| _CPM_Rate | 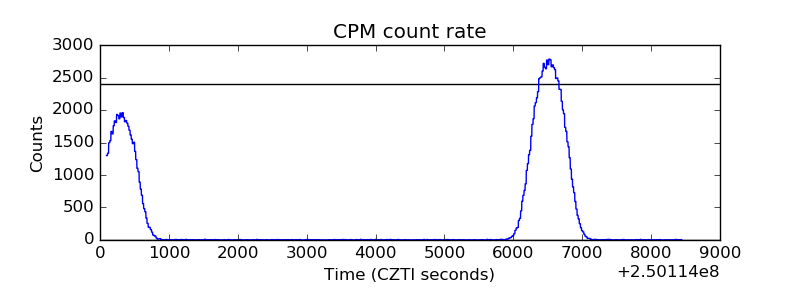 |
| CZT Counter | 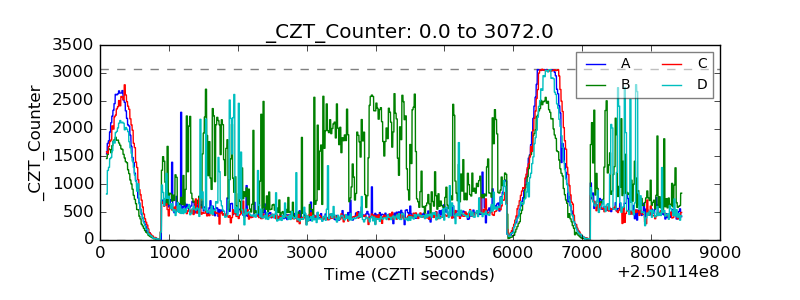 |
| +2.5 Volts monitor | 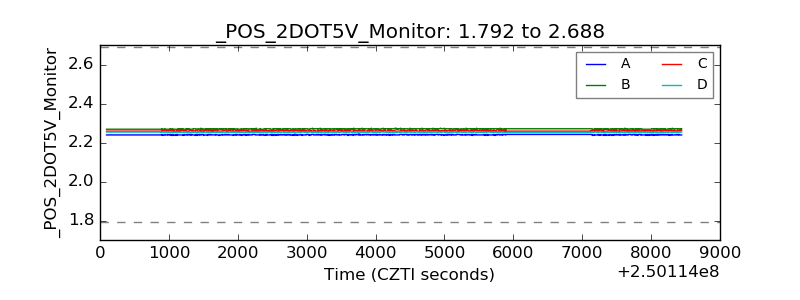 |
| +5 Volts monitor | 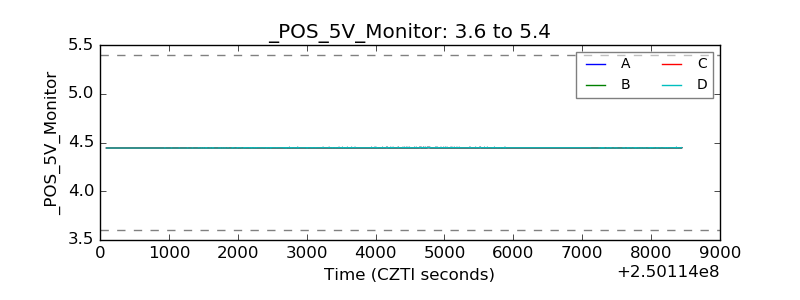 |
| _ROLL_ROT | 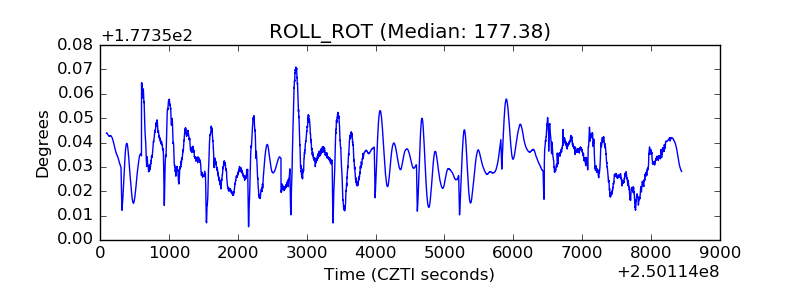 |
| _Roll_DEC | 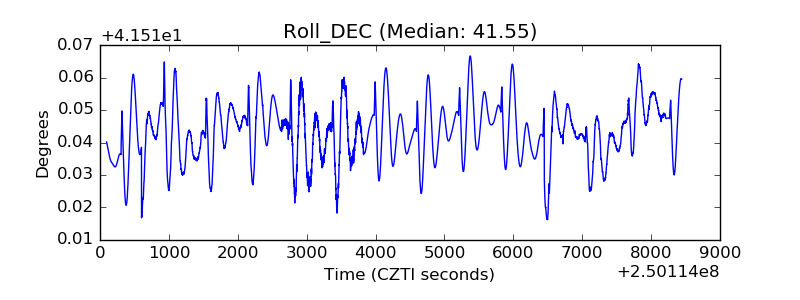 |
| _Roll_RA | 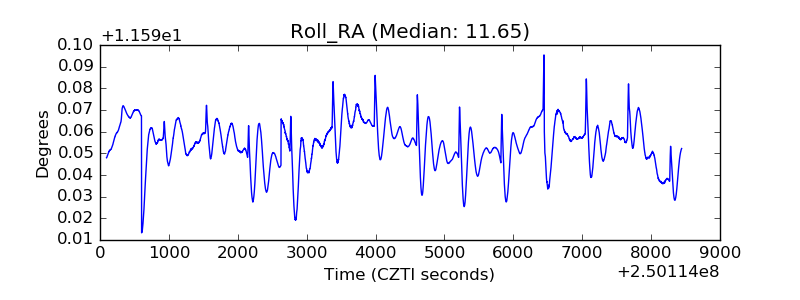 |
| Veto Counter | 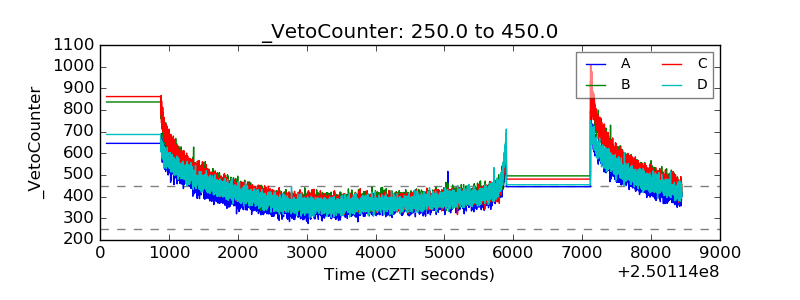 |