| Param | Original file | Final file |
|---|---|---|
| Filename | modeM0/AS1A04_022T07_9000001748_11825cztM0_level2.evt | modeM0/AS1A04_022T07_9000001748_11825cztM0_level2_quad_clean.evt |
| Size (bytes) | 472,772,160 | 84,375,360 |
| Size | 450.9 MB | 80.5 MB |
| Events in quadrant A | 3,133,799 | 535,017 |
| Events in quadrant B | 4,080,274 | 539,594 |
| Events in quadrant C | 2,939,307 | 545,744 |
| Events in quadrant D | 3,745,535 | 503,896 |
| Mode SS | |||
|---|---|---|---|
| Quadrant | BADHDUFLAG | Total packets | Discarded packets |
| A | 0 | 126 | 0 |
| B | 0 | 126 | 0 |
| C | 0 | 126 | 0 |
| D | 0 | 126 | 0 |
| Mode M9 | |||
|---|---|---|---|
| Quadrant | BADHDUFLAG | Total packets | Discarded packets |
| A | 0 | 20 | 0 |
| B | 0 | 20 | 0 |
| C | 0 | 20 | 0 |
| D | 0 | 21 | 0 |
| Mode M0 | |||
|---|---|---|---|
| Quadrant | BADHDUFLAG | Total packets | Discarded packets |
| A | 0 | 13350 | 3 |
| B | 0 | 16135 | 2 |
| C | 0 | 12702 | 2 |
| D | 0 | 15338 | 2 |
| Quadrant | Total seconds | Saturated seconds | Saturation percentage |
|---|---|---|---|
| A | 6169 | 37 | 0.599773% |
| B | 6169 | 275 | 4.457773% |
| C | 6169 | 12 | 0.194521% |
| D | 6169 | 128 | 2.074891% |
Noise dominated data is calculated using 1-second bins in cleaned event files. If a bin has >2000 counts, and if more than 50% of those come from <1% of pixels, then it is considered to be noise-dominated and hence unusable.
| Quadrant | # 1 sec bins | Bins with >0 counts | Bins with >2000 counts | High rate bins dominated by noise | Noise dominated (total time) | Noise dominated (detector-on time) | Marked lightcurve |
|---|---|---|---|---|---|---|---|
| A | 7545 | 6171 | 0 | 0 | 0.00% | 0.00% | 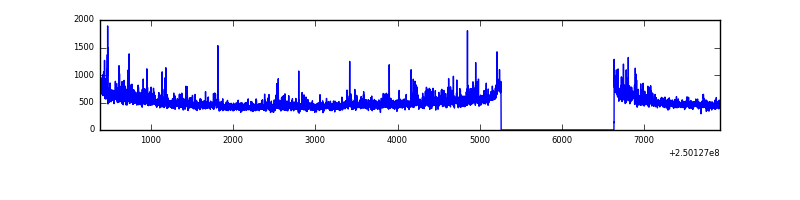 |
| B | 7545 | 6171 | 141 | 141 | 1.87% | 2.28% | 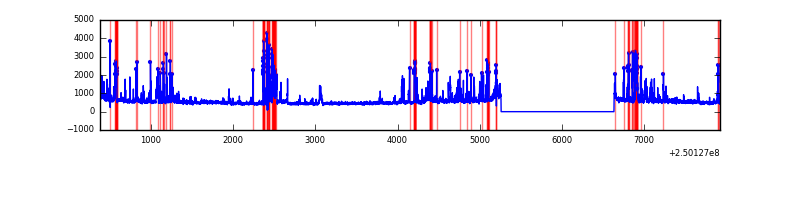 |
| C | 7545 | 6171 | 0 | 0 | 0.00% | 0.00% | 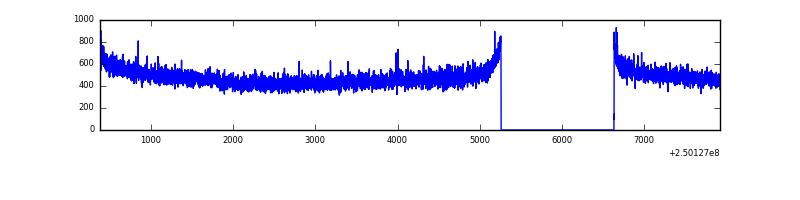 |
| D | 7545 | 6171 | 92 | 92 | 1.22% | 1.49% | 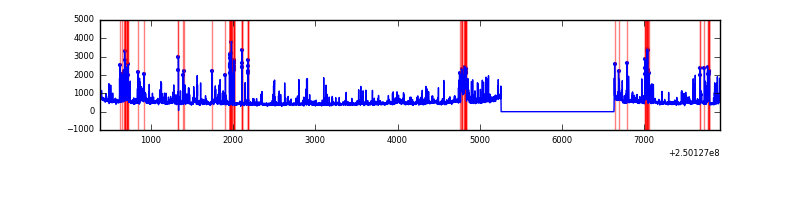 |
Top three noisy pixels from each quadrant. If the there are fewer than three noisy pixels in the level2.evt file, extra rows are filled as -1
| Pixel properties | Quadrant properties | ||||||
|---|---|---|---|---|---|---|---|
| Quadrant | DetID | PixID | Counts | Sigma | Mean | Median | Sigma |
| A | 1 | 162 | 79173 | 514.2 | 760 | 746 | 152.5 |
| A | 1 | 178 | 41805 | 269.2 | 760 | 746 | 152.5 |
| A | 1 | 161 | 37023 | 237.84 | 760 | 746 | 152.5 |
| B | 4 | 239 | 667901 | 4706.0 | 761 | 745 | 141.8 |
| B | 3 | 64 | 259613 | 1826.01 | 761 | 745 | 141.8 |
| B | 0 | 214 | 53066 | 369.06 | 761 | 745 | 141.8 |
| C | 13 | 61 | 5467 | 27.05 | 752 | 758 | 174.1 |
| C | 14 | 234 | 2716 | 11.25 | 752 | 758 | 174.1 |
| C | 8 | 222 | 2553 | 10.31 | 752 | 758 | 174.1 |
| D | 1 | 52 | 480317 | 2714.36 | 732 | 712 | 176.7 |
| D | 13 | 104 | 197530 | 1113.91 | 732 | 712 | 176.7 |
| D | 5 | 222 | 71943 | 403.14 | 732 | 712 | 176.7 |
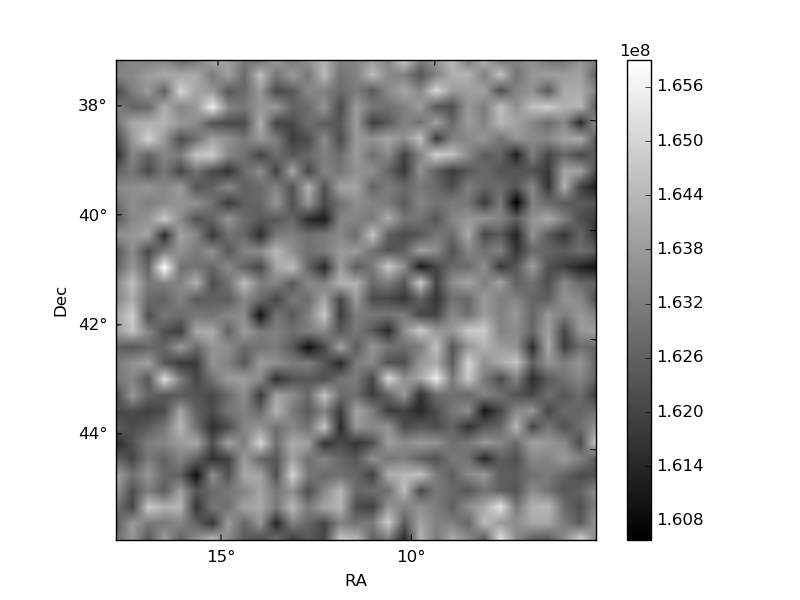
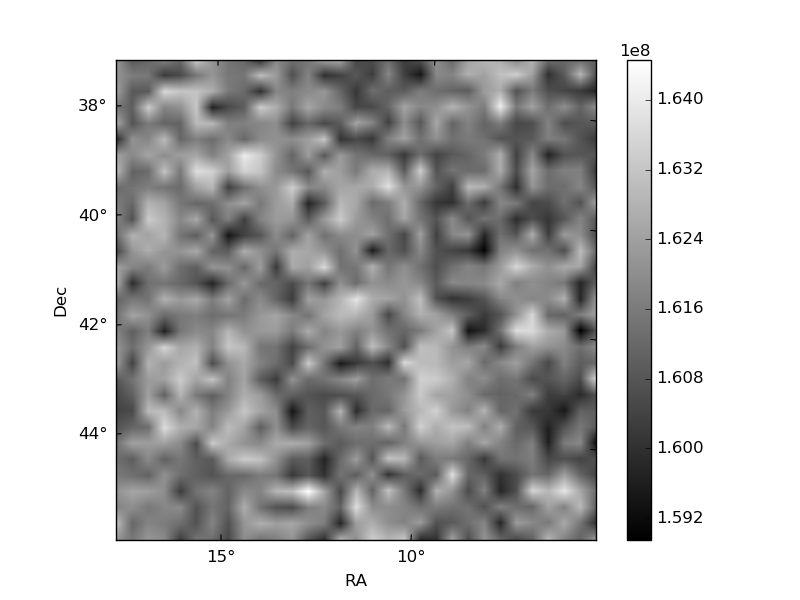
Histogram calculated using DETX and DETY for each event in the final _common_clean file
| Quadrant A | 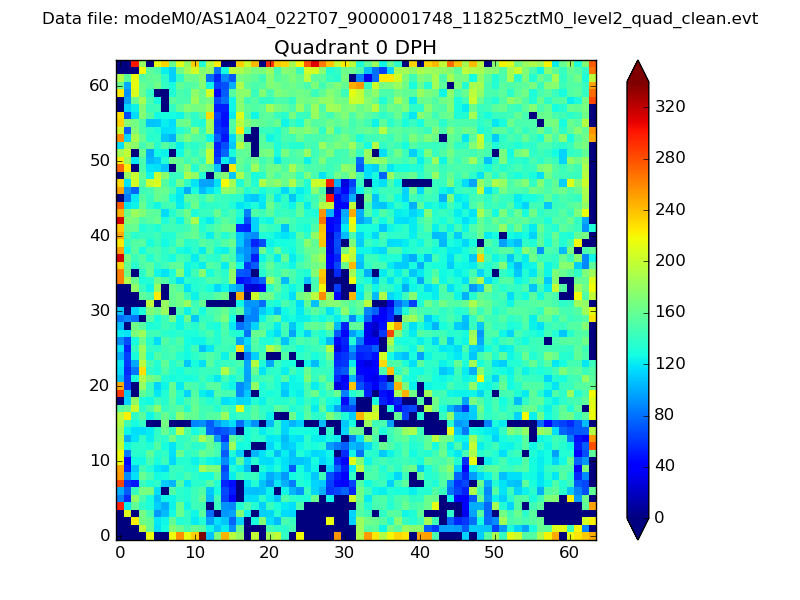 |
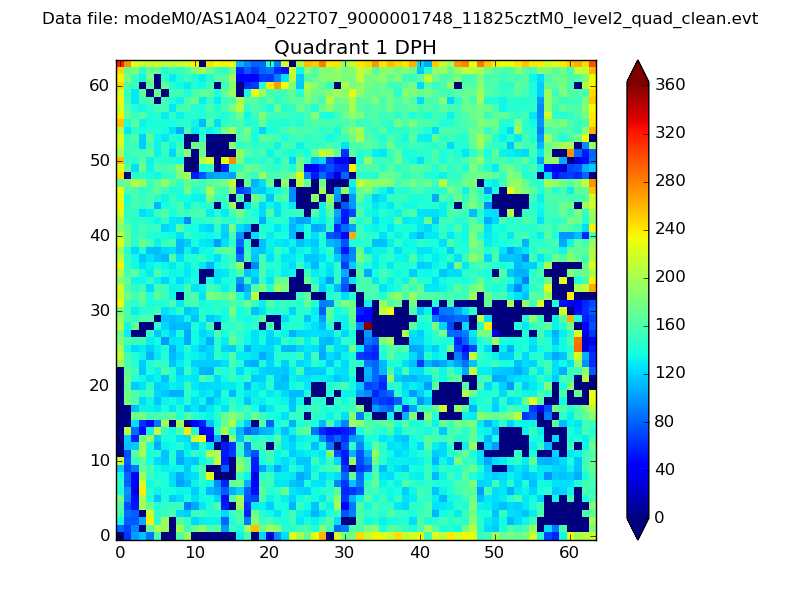 |
Quadrant B |
|---|---|---|---|
| Quadrant D | 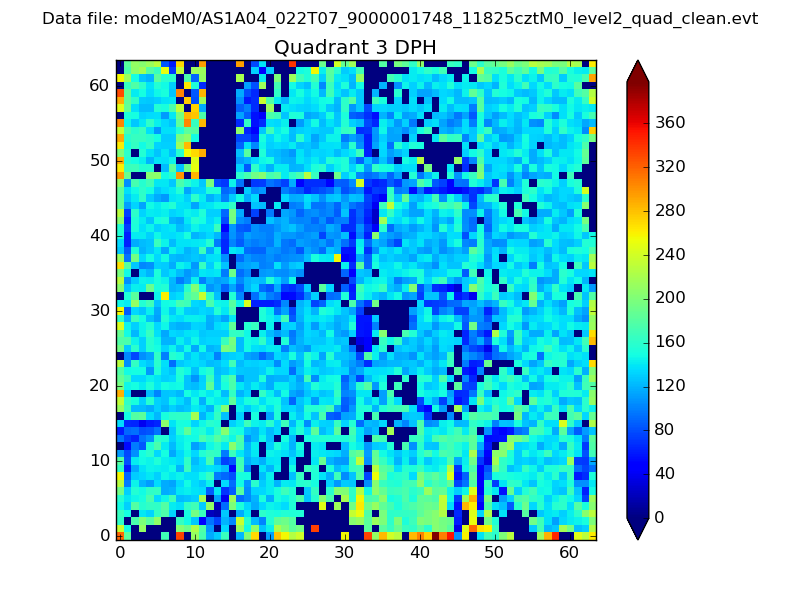 |
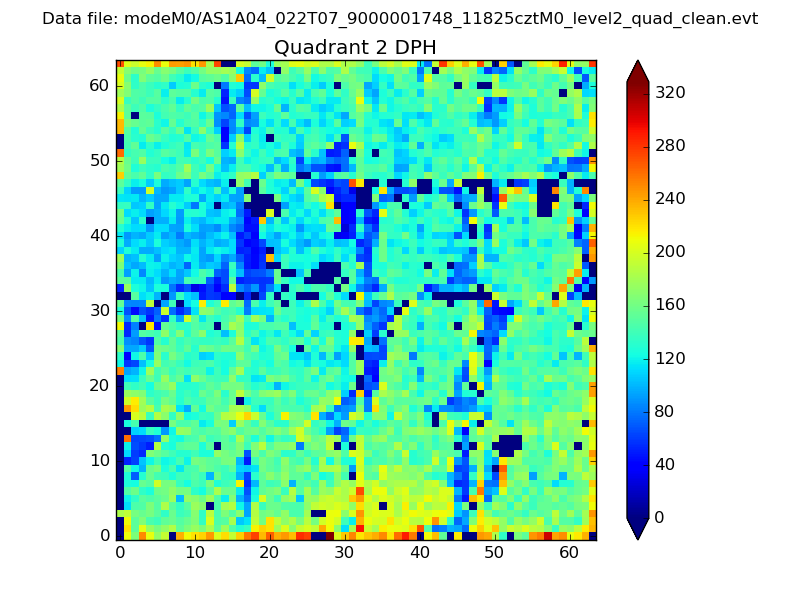 |
Quadrant C |
| Plot type | Count rate plots | Images |
|---|---|---|
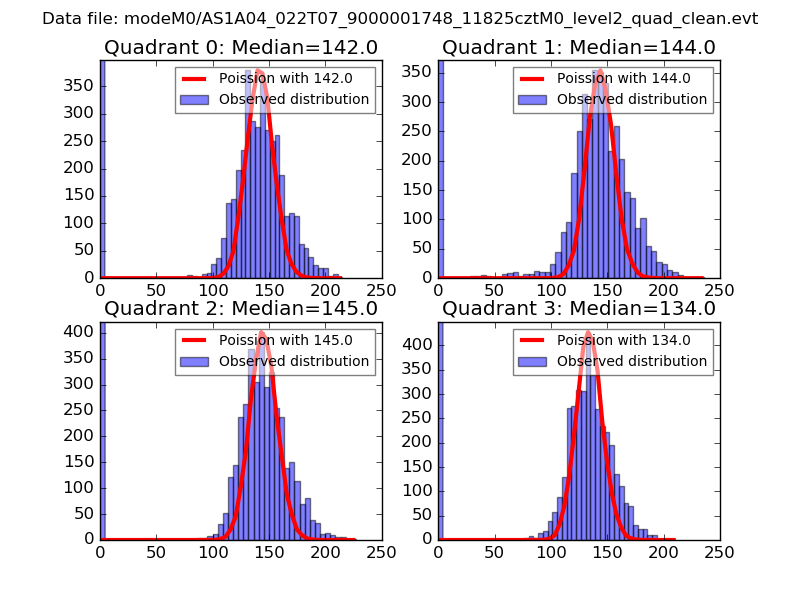
| Comparison with Poisson distribution Blue bars denote a histogram of data divided into 1 sec bins. Red curve is a Poisson curve with rate = median count rate of data. |
 |
 |
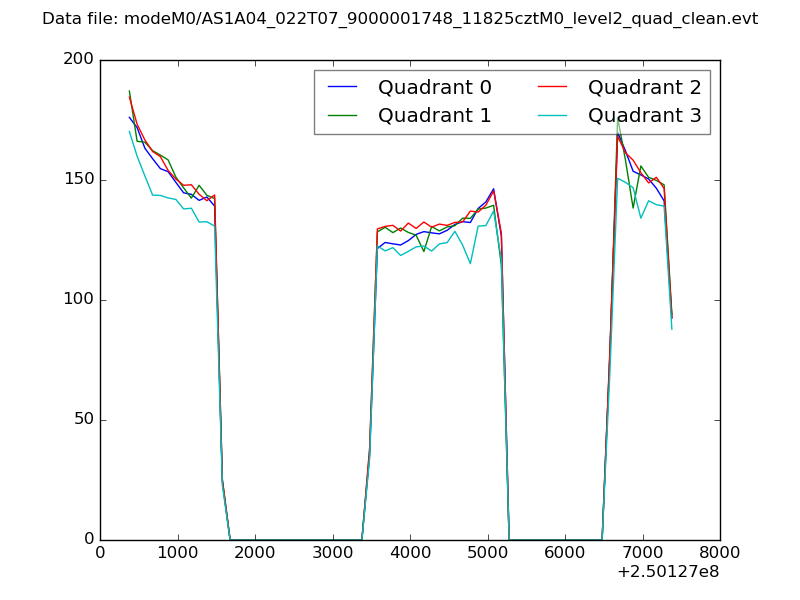
| Quadrant-wise count rates Data is divided into 100 sec bins |
 |
|
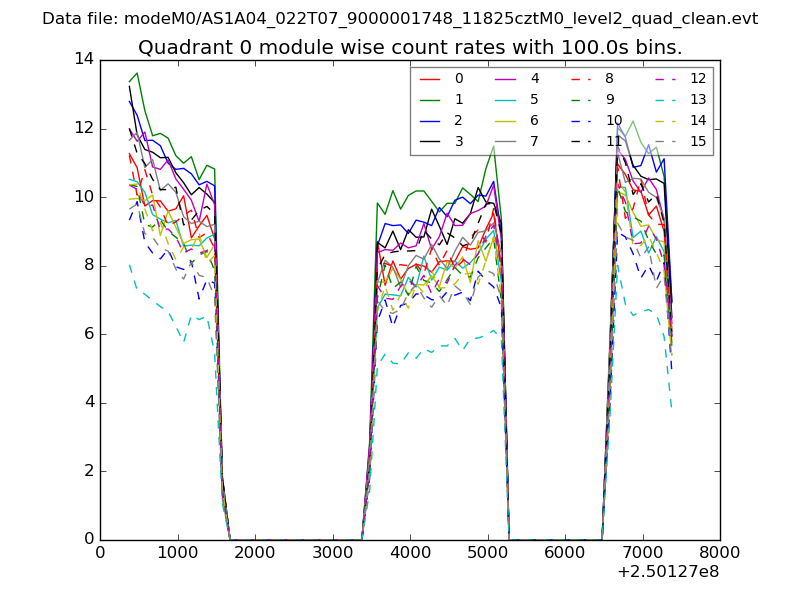
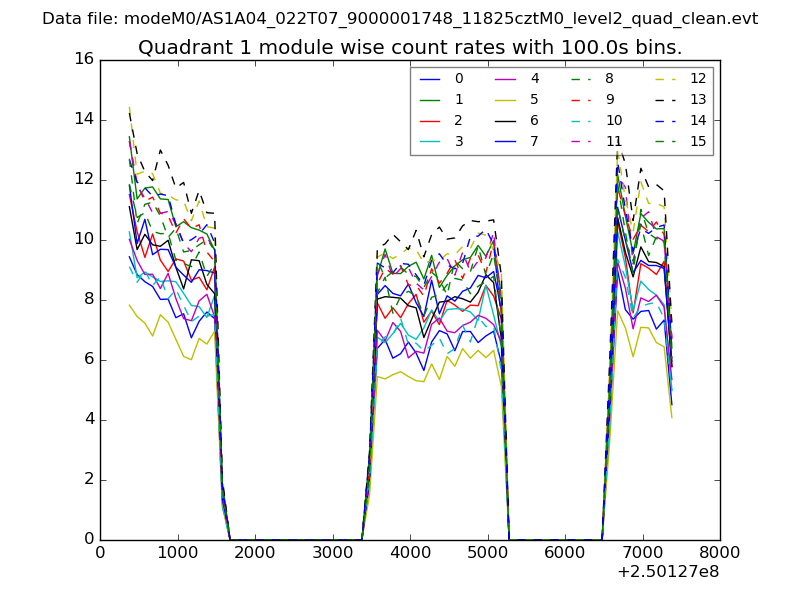
| Module-wise count rates for Quadrant A Data is divided into 100 sec bins |
 |
 |
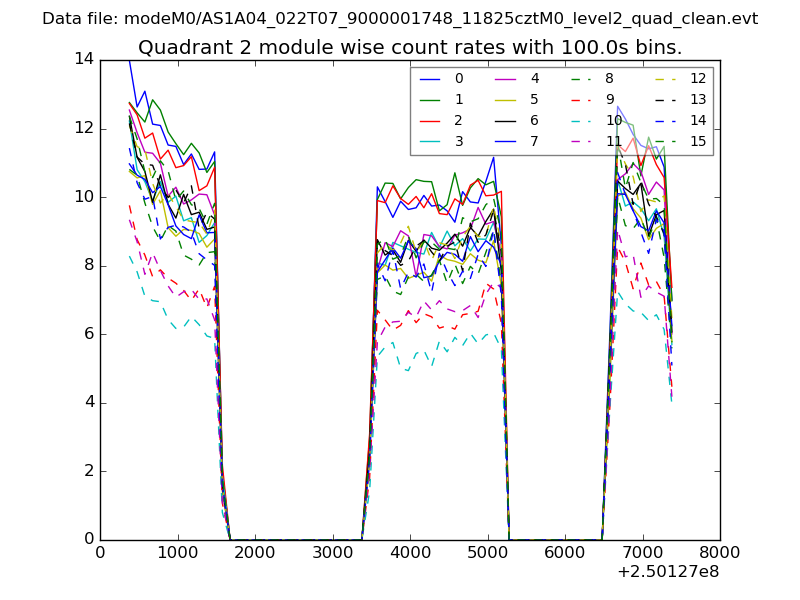
| Module-wise count rates for Quadrant B Data is divided into 100 sec bins |
 |
 |
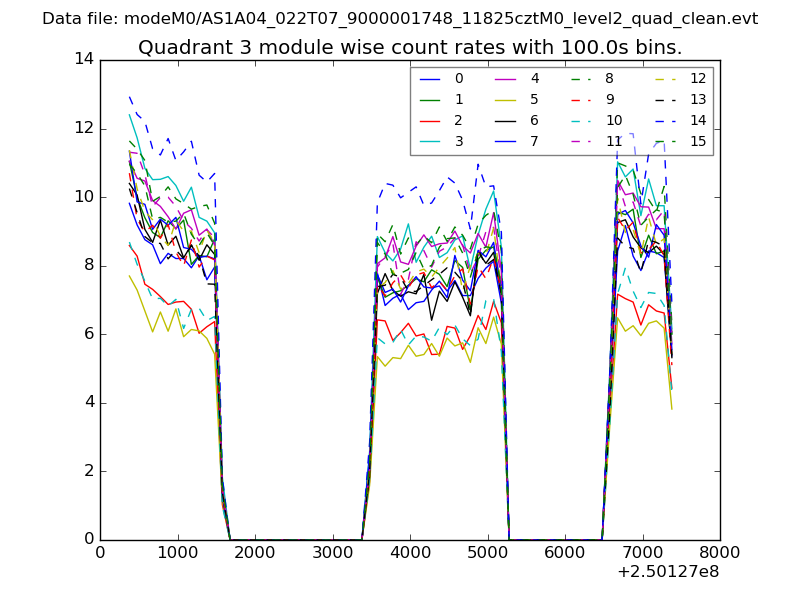
| Module-wise count rates for Quadrant C Data is divided into 100 sec bins |
 |
 |
| Module-wise count rates for Quadrant D Data is divided into 100 sec bins |
 |
 |
| Parameter | Plot |
|---|---|
| CZT HV Monitor |  |
| D_VDD | 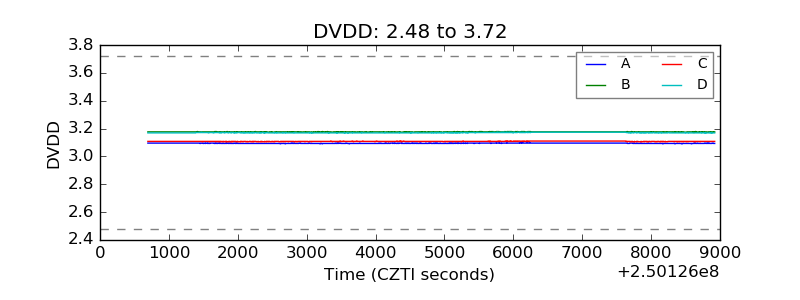 |
| Temperature 1 | 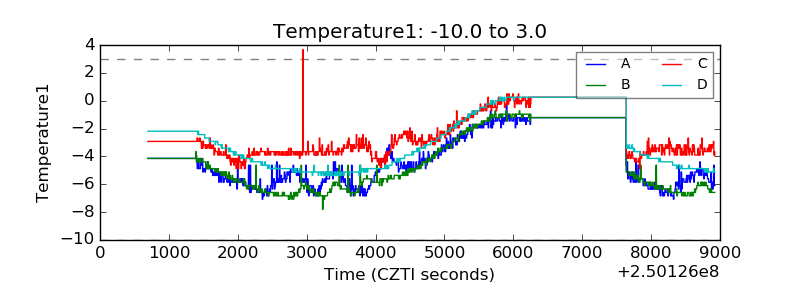 |
| Veto HV Monitor | 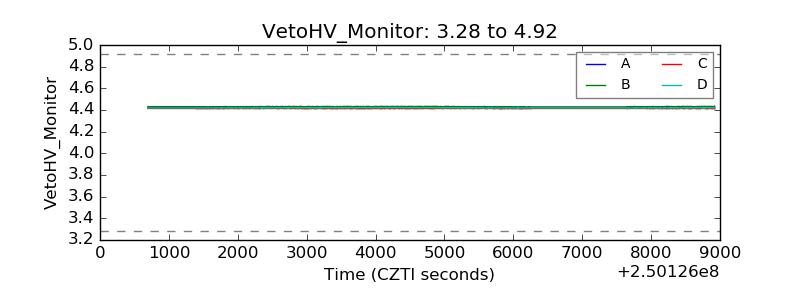 |
| Veto LLD | 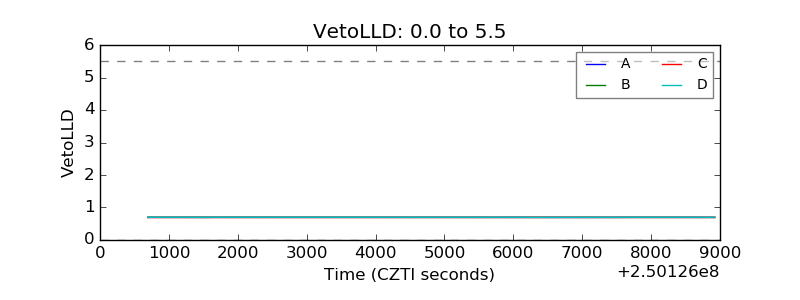 |
| Alpha Counter | 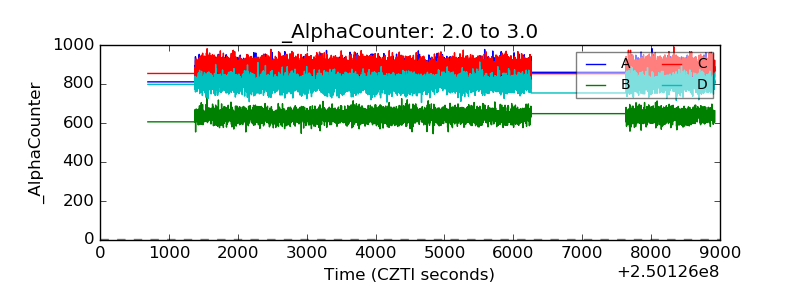 |
| _CPM_Rate | 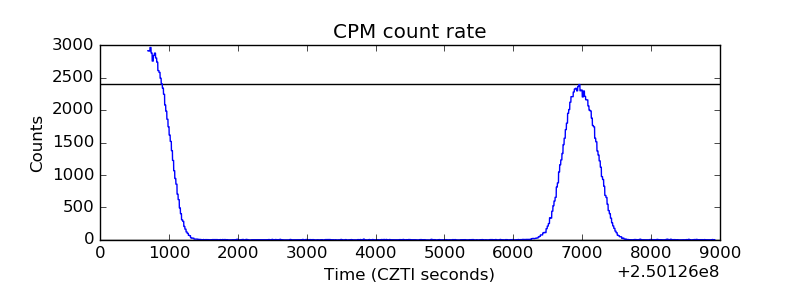 |
| CZT Counter | 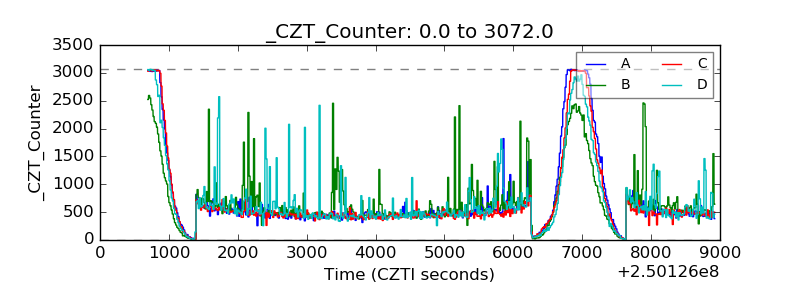 |
| +2.5 Volts monitor |  |
| +5 Volts monitor |  |
| _ROLL_ROT | 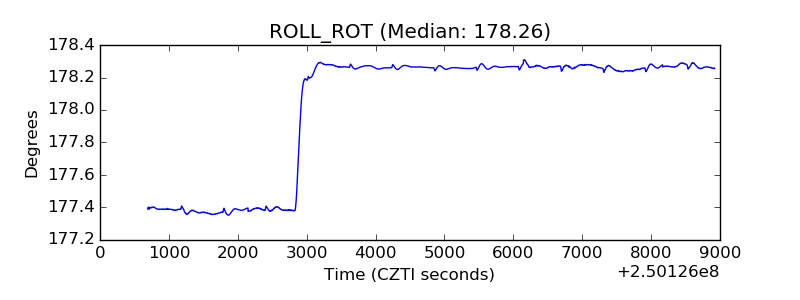 |
| _Roll_DEC | 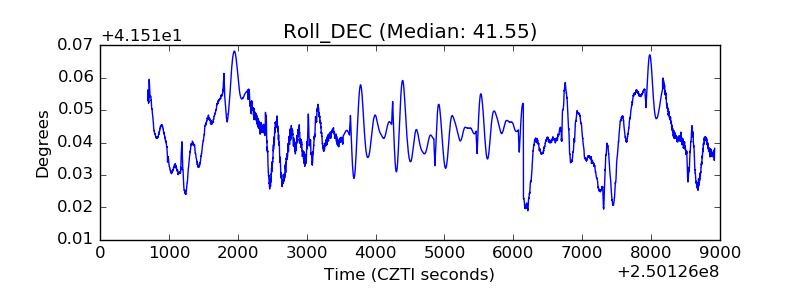 |
| _Roll_RA | 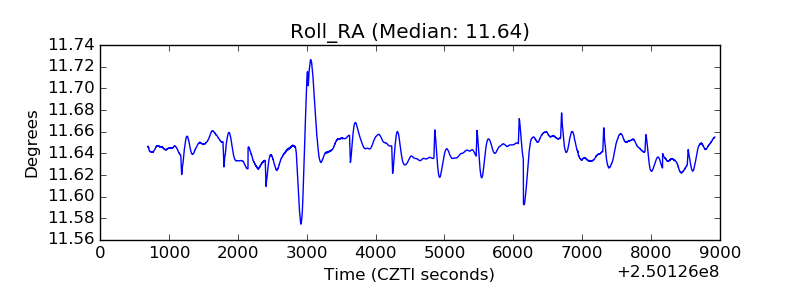 |
| Veto Counter | 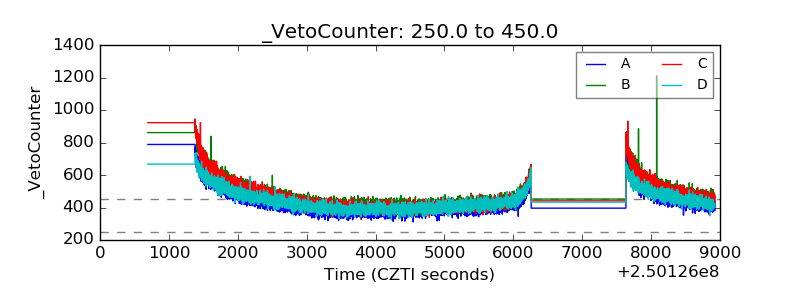 |