| Param | Original file | Final file |
|---|---|---|
| Filename | modeM0/AS1A04_022T07_9000001748_11827cztM0_level2.evt | modeM0/AS1A04_022T07_9000001748_11827cztM0_level2_quad_clean.evt |
| Size (bytes) | 483,753,600 | 61,240,320 |
| Size | 461.3 MB | 58.4 MB |
| Events in quadrant A | 3,024,760 | 360,825 |
| Events in quadrant B | 5,130,669 | 350,525 |
| Events in quadrant C | 2,820,823 | 366,869 |
| Events in quadrant D | 3,258,089 | 347,735 |
| Mode SS | |||
|---|---|---|---|
| Quadrant | BADHDUFLAG | Total packets | Discarded packets |
| A | 0 | 124 | 0 |
| B | 0 | 124 | 0 |
| C | 0 | 124 | 0 |
| D | 0 | 124 | 0 |
| Mode M9 | |||
|---|---|---|---|
| Quadrant | BADHDUFLAG | Total packets | Discarded packets |
| A | 0 | 11 | 0 |
| B | 0 | 11 | 0 |
| C | 0 | 11 | 0 |
| D | 0 | 11 | 0 |
| Mode M0 | |||
|---|---|---|---|
| Quadrant | BADHDUFLAG | Total packets | Discarded packets |
| A | 0 | 13078 | 2 |
| B | 0 | 19219 | 1 |
| C | 0 | 12590 | 1 |
| D | 0 | 14059 | 1 |
| Quadrant | Total seconds | Saturated seconds | Saturation percentage |
|---|---|---|---|
| A | 6131 | 93 | 1.516881% |
| B | 6131 | 746 | 12.167672% |
| C | 6131 | 24 | 0.391453% |
| D | 6131 | 48 | 0.782907% |
Noise dominated data is calculated using 1-second bins in cleaned event files. If a bin has >2000 counts, and if more than 50% of those come from <1% of pixels, then it is considered to be noise-dominated and hence unusable.
| Quadrant | # 1 sec bins | Bins with >0 counts | Bins with >2000 counts | High rate bins dominated by noise | Noise dominated (total time) | Noise dominated (detector-on time) | Marked lightcurve |
|---|---|---|---|---|---|---|---|
| A | 7237 | 6133 | 0 | 0 | 0.00% | 0.00% |  |
| B | 7237 | 6133 | 488 | 488 | 6.74% | 7.96% | 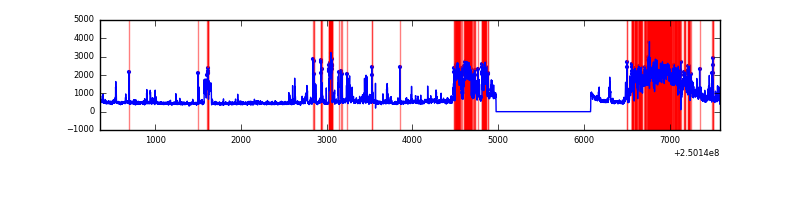 |
| C | 7237 | 6133 | 1 | 1 | 0.01% | 0.02% | 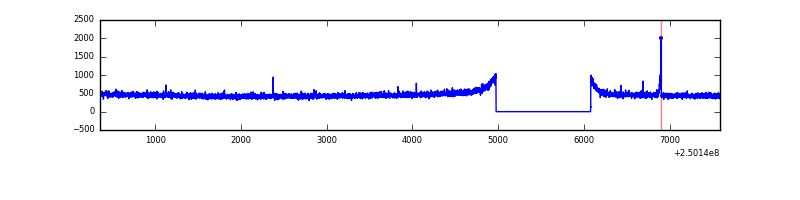 |
| D | 7237 | 6133 | 20 | 20 | 0.28% | 0.33% | 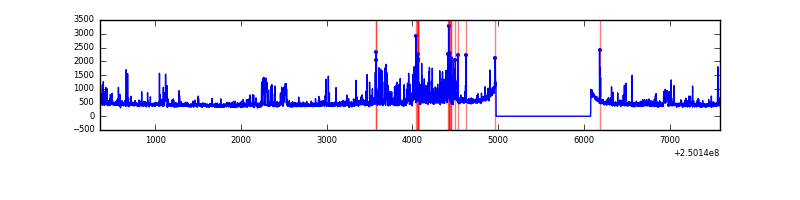 |
Top three noisy pixels from each quadrant. If the there are fewer than three noisy pixels in the level2.evt file, extra rows are filled as -1
| Pixel properties | Quadrant properties | ||||||
|---|---|---|---|---|---|---|---|
| Quadrant | DetID | PixID | Counts | Sigma | Mean | Median | Sigma |
| A | 1 | 162 | 79379 | 523.12 | 735 | 720 | 150.4 |
| A | 1 | 178 | 41503 | 271.23 | 735 | 720 | 150.4 |
| A | 1 | 161 | 36485 | 237.85 | 735 | 720 | 150.4 |
| B | 10 | 16 | 1557085 | 11507.09 | 718 | 700 | 135.3 |
| B | 4 | 239 | 467682 | 3452.62 | 718 | 700 | 135.3 |
| B | 3 | 64 | 172871 | 1272.94 | 718 | 700 | 135.3 |
| C | 7 | 238 | 13067 | 73.83 | 719 | 723 | 167.2 |
| C | 13 | 61 | 5389 | 27.91 | 719 | 723 | 167.2 |
| C | 12 | 4 | 2405 | 10.06 | 719 | 723 | 167.2 |
| D | 1 | 52 | 319932 | 1765.13 | 704 | 688 | 180.9 |
| D | 13 | 249 | 64019 | 350.16 | 704 | 688 | 180.9 |
| D | 7 | 80 | 58404 | 319.11 | 704 | 688 | 180.9 |
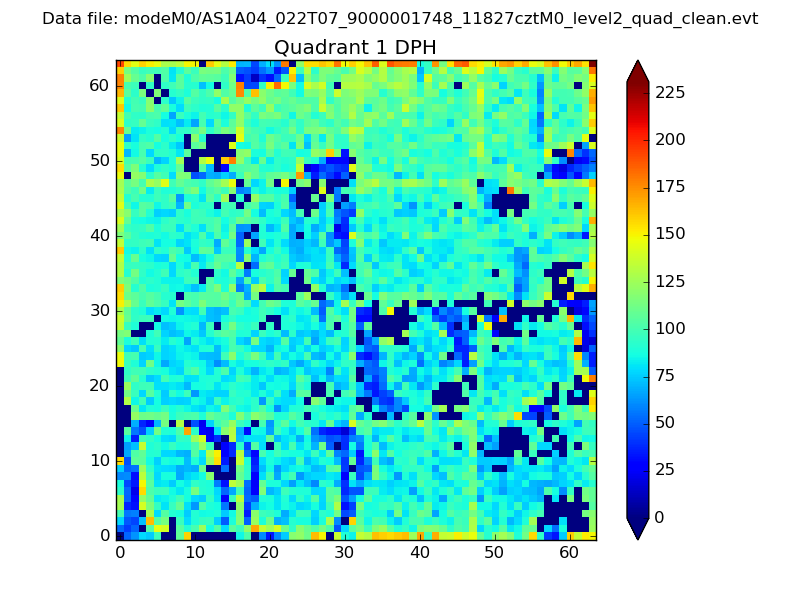
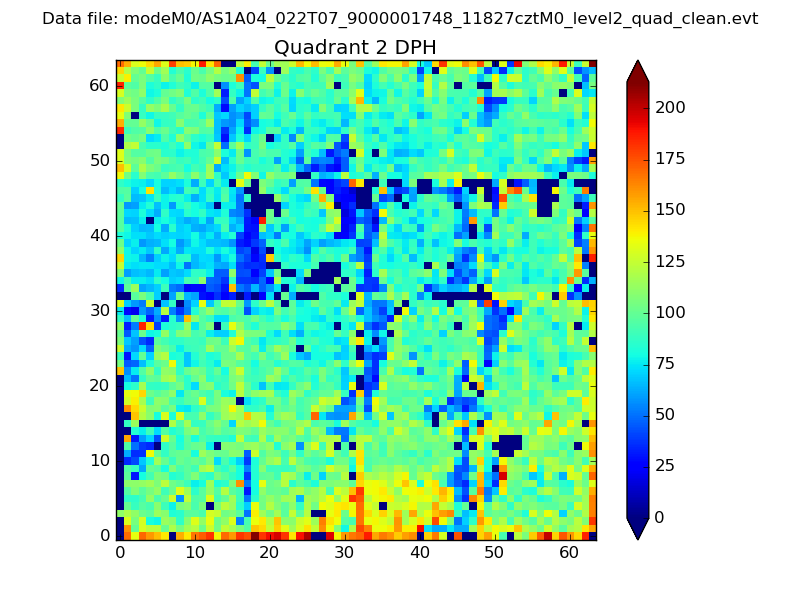
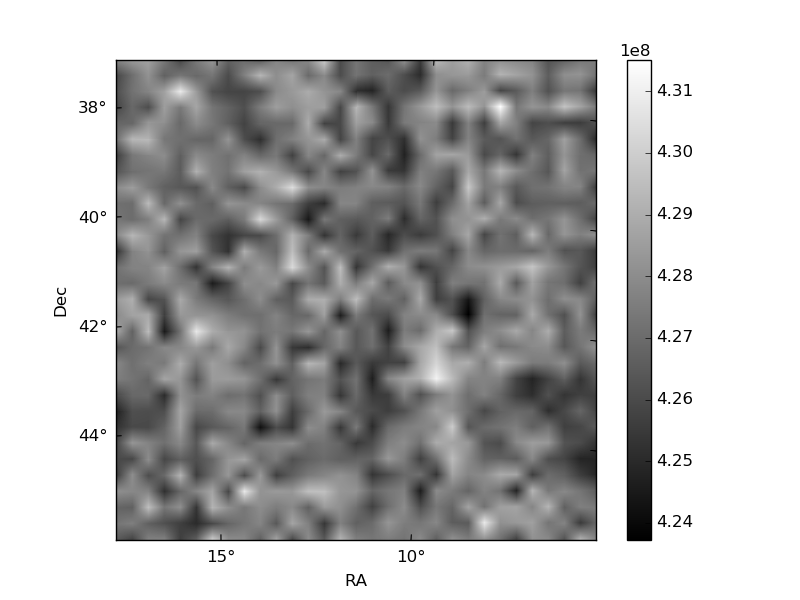
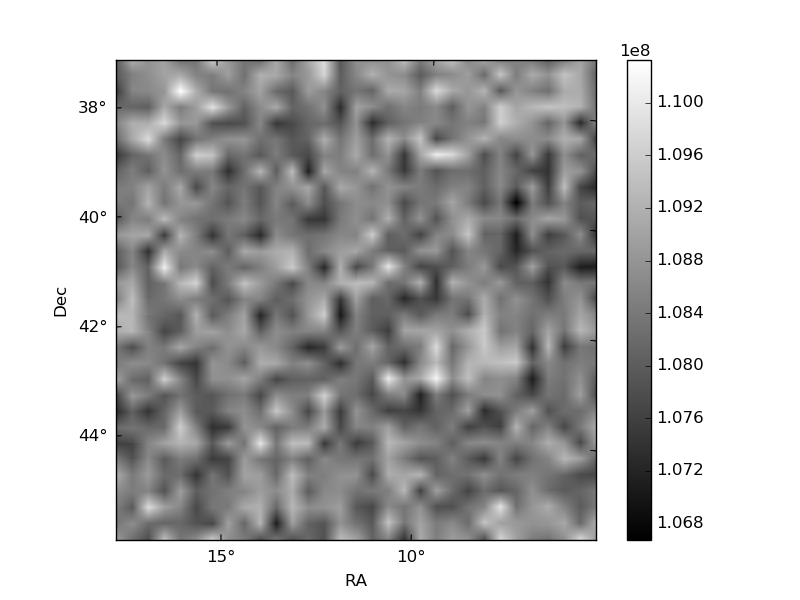
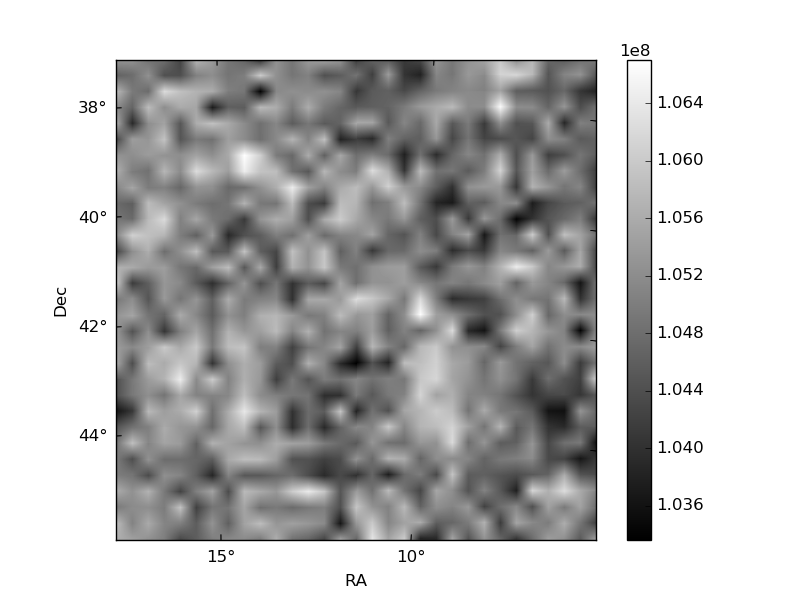
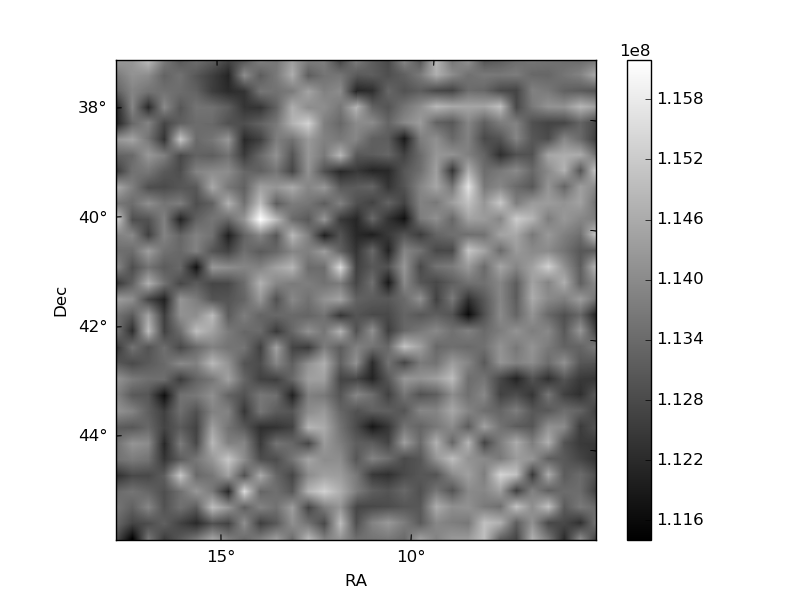
Histogram calculated using DETX and DETY for each event in the final _common_clean file
| Quadrant A | 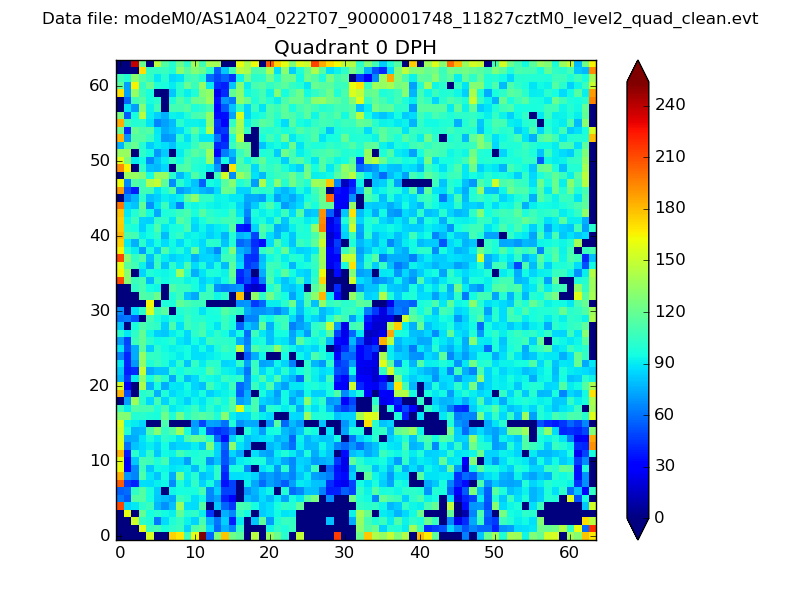 |
 |
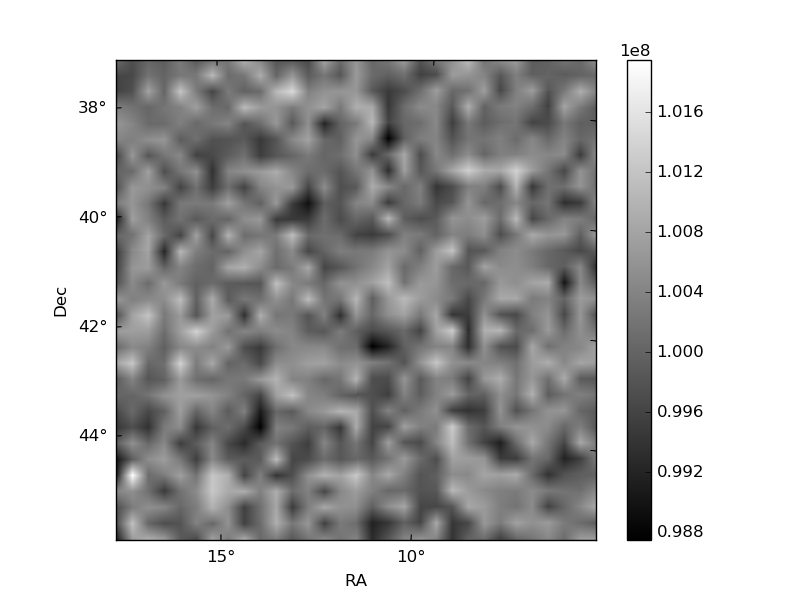
Quadrant B |
|---|---|---|---|
| Quadrant D | 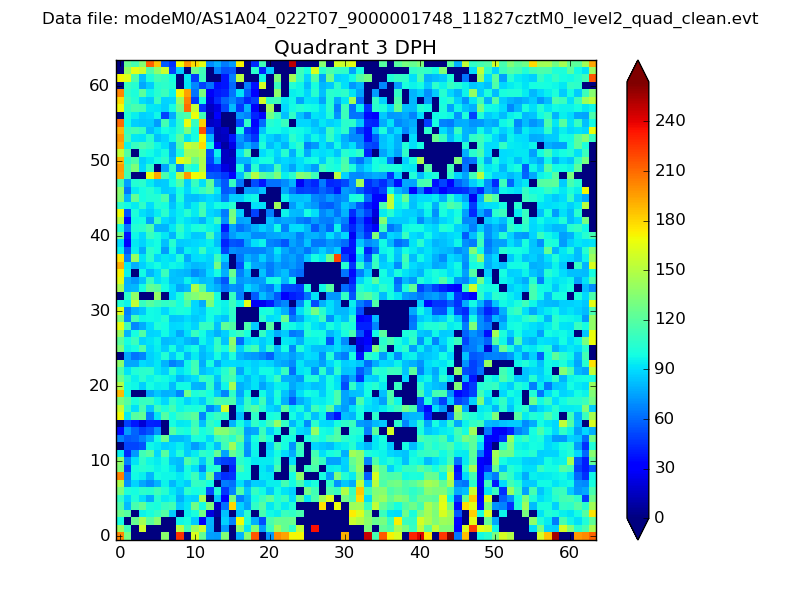 |
 |
Quadrant C |
| Plot type | Count rate plots | Images |
|---|---|---|
| Comparison with Poisson distribution Blue bars denote a histogram of data divided into 1 sec bins. Red curve is a Poisson curve with rate = median count rate of data. |
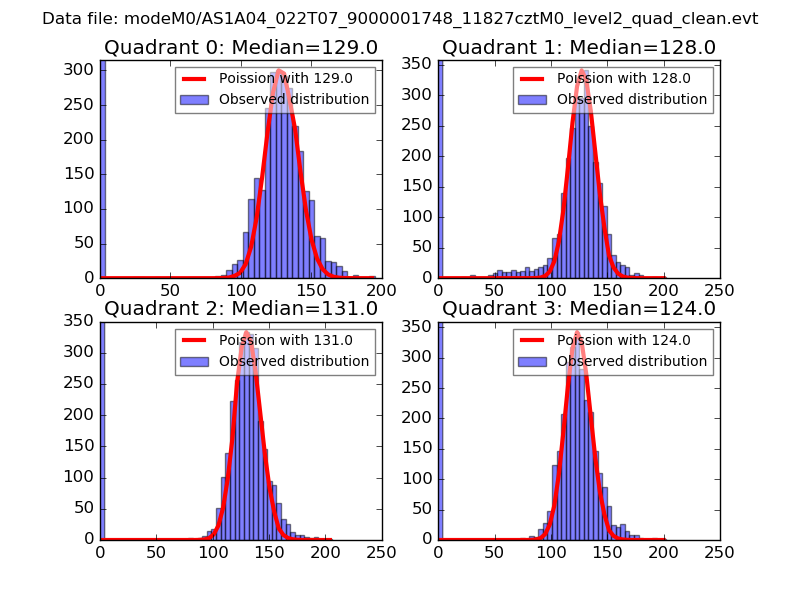 |
 |
| Quadrant-wise count rates Data is divided into 100 sec bins |
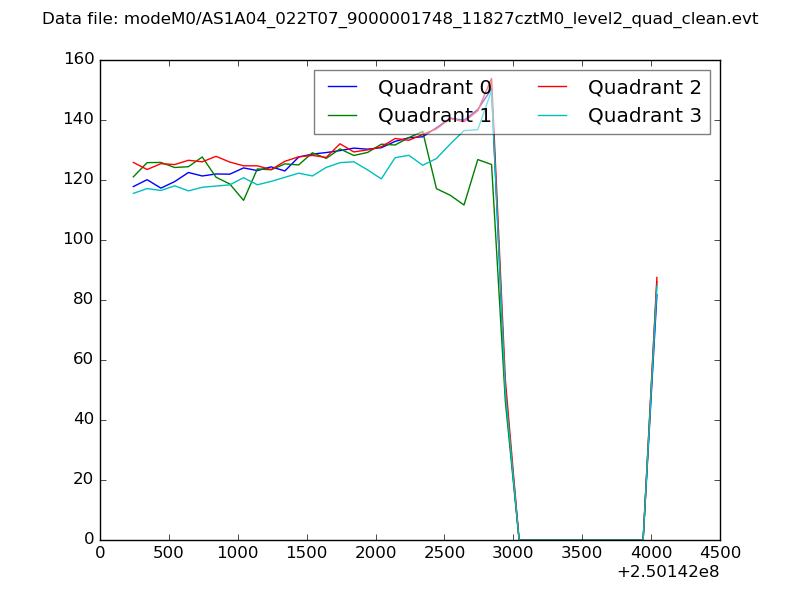 |
|
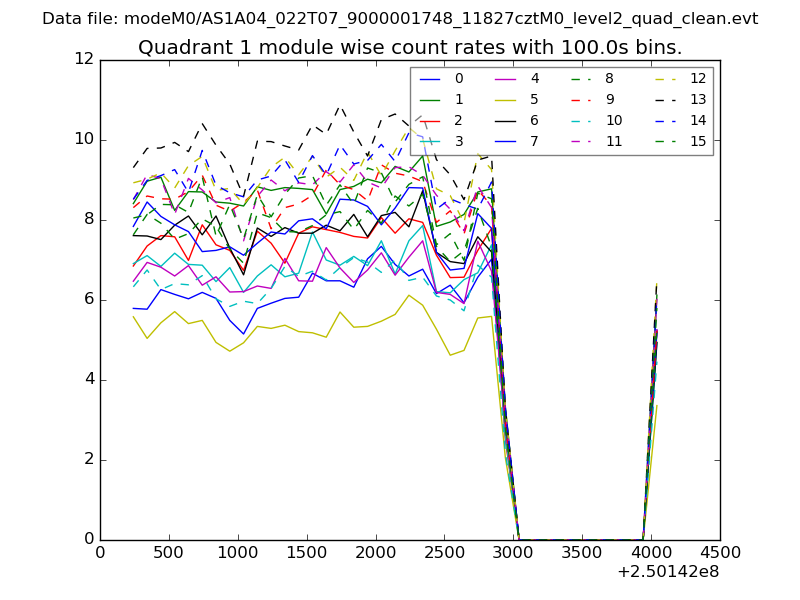
| Module-wise count rates for Quadrant A Data is divided into 100 sec bins |
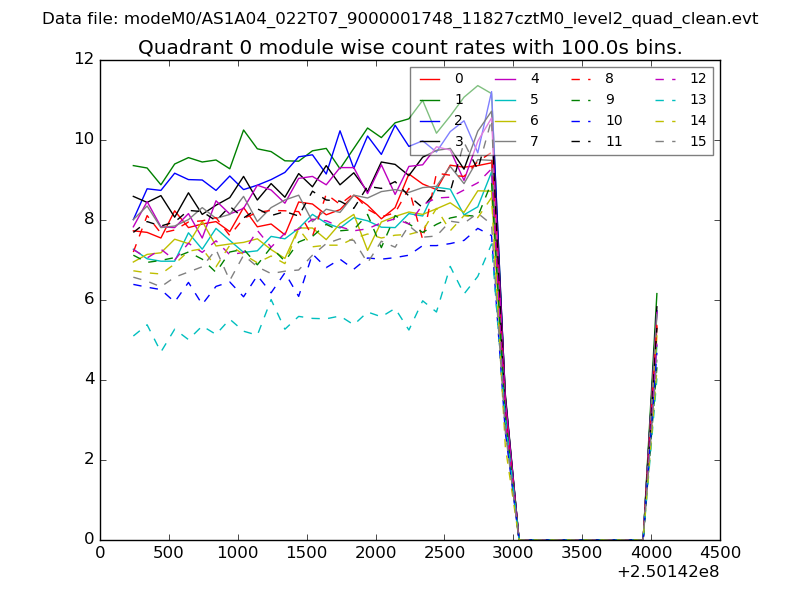 |
 |
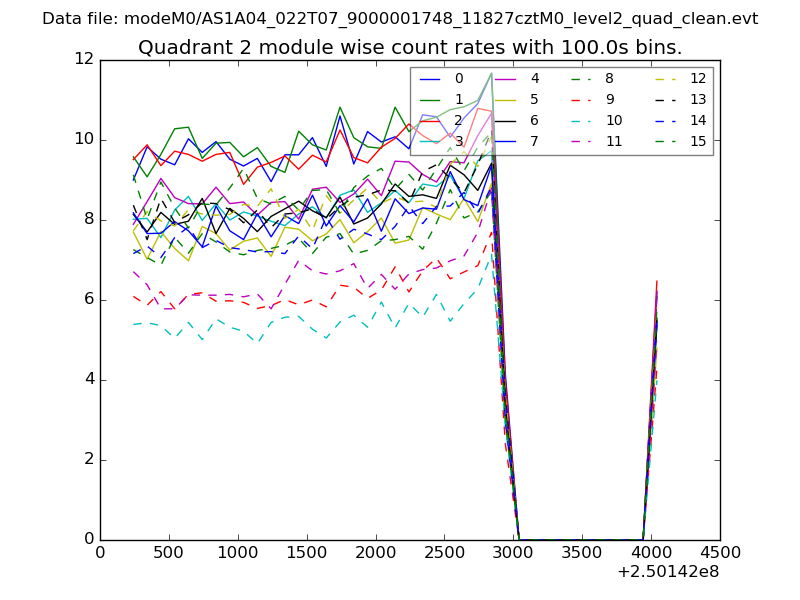
| Module-wise count rates for Quadrant B Data is divided into 100 sec bins |
 |
 |
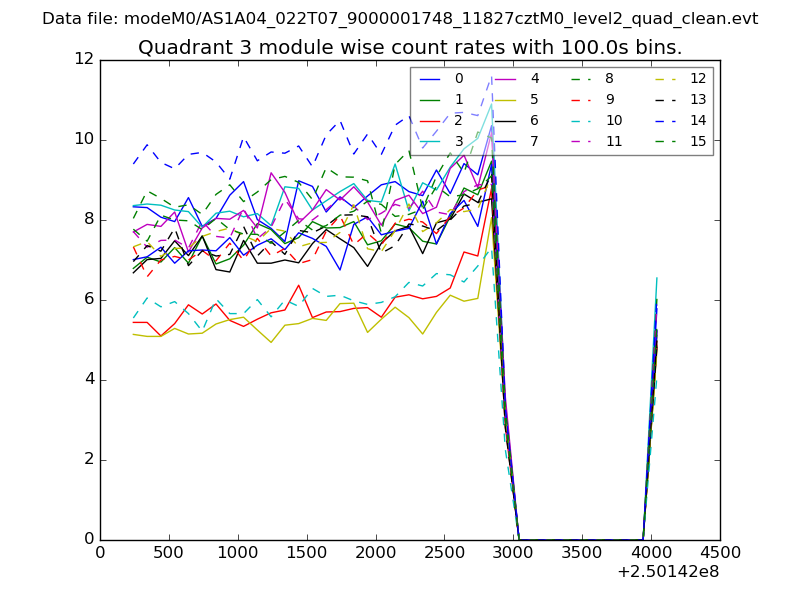
| Module-wise count rates for Quadrant C Data is divided into 100 sec bins |
 |
 |
| Module-wise count rates for Quadrant D Data is divided into 100 sec bins |
 |
 |
| Parameter | Plot |
|---|---|
| CZT HV Monitor |  |
| D_VDD | 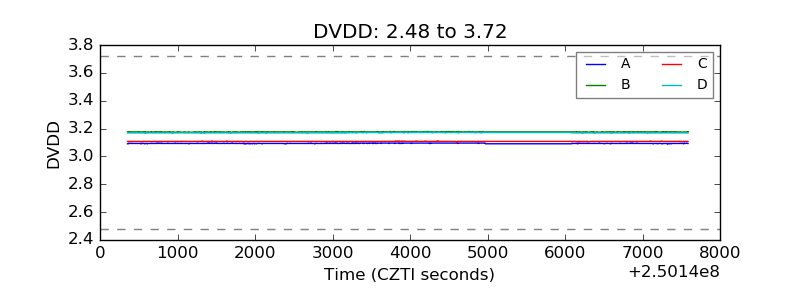 |
| Temperature 1 | 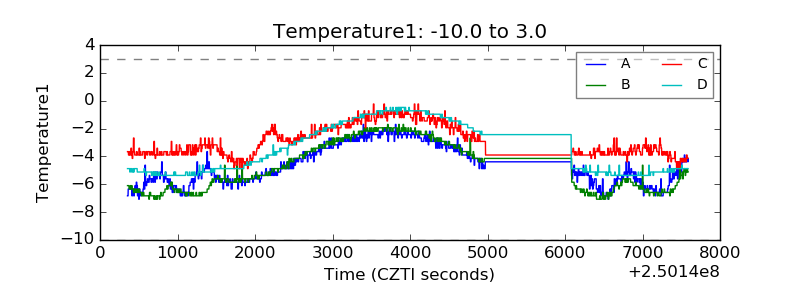 |
| Veto HV Monitor |  |
| Veto LLD | 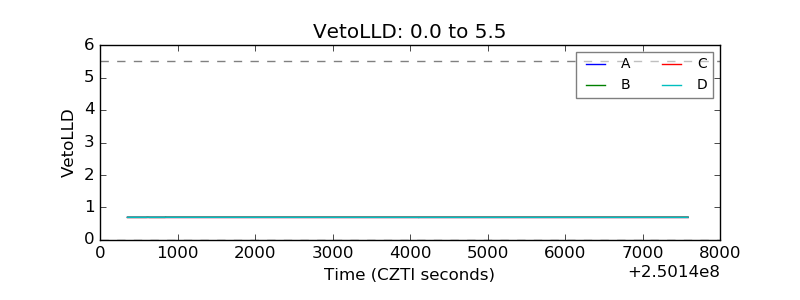 |
| Alpha Counter | 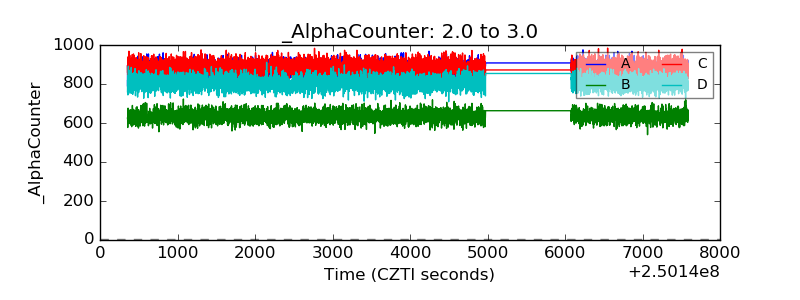 |
| _CPM_Rate | 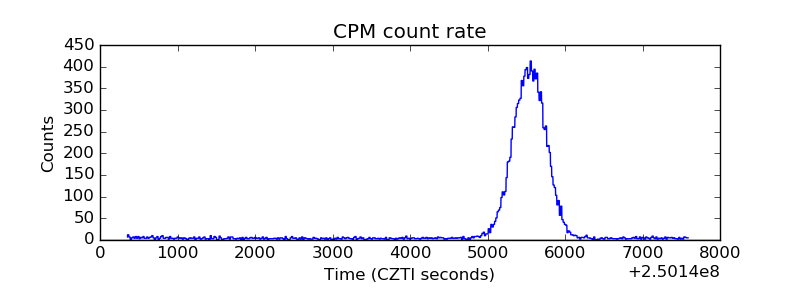 |
| CZT Counter | 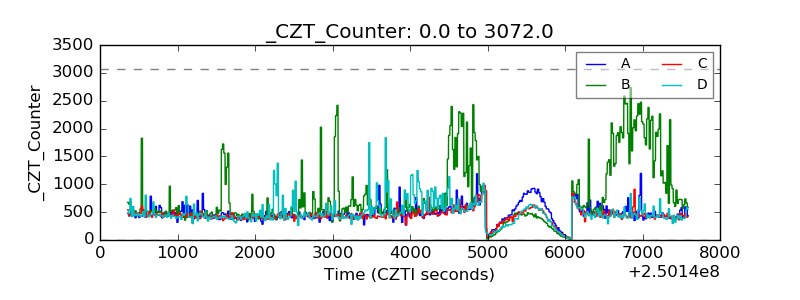 |
| +2.5 Volts monitor | 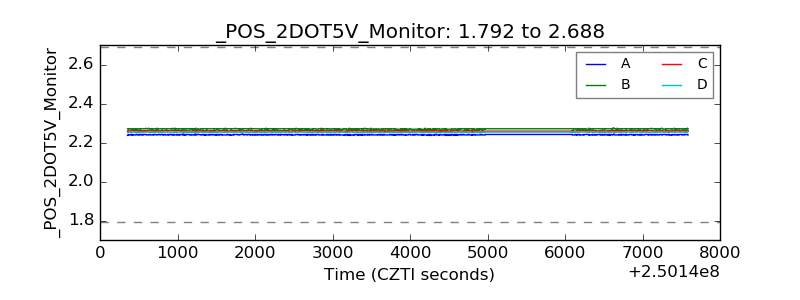 |
| +5 Volts monitor |  |
| _ROLL_ROT | 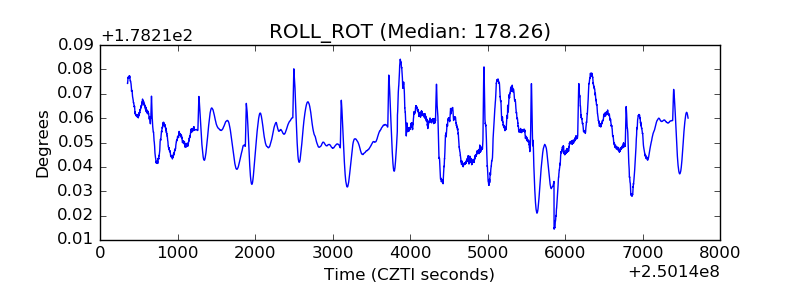 |
| _Roll_DEC | 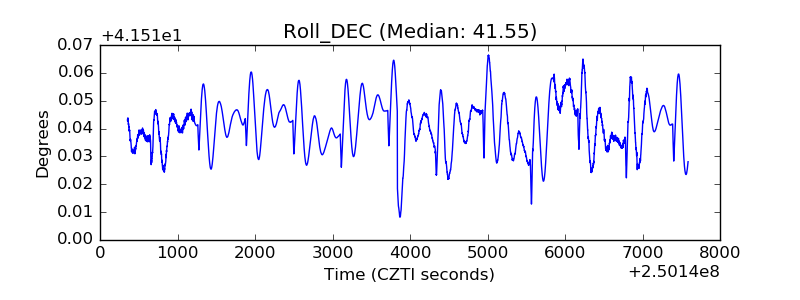 |
| _Roll_RA | 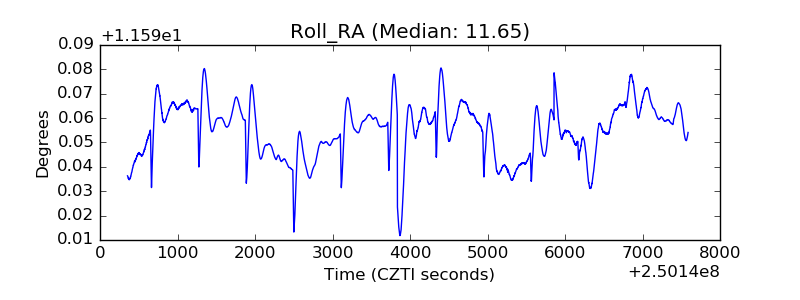 |
| Veto Counter | 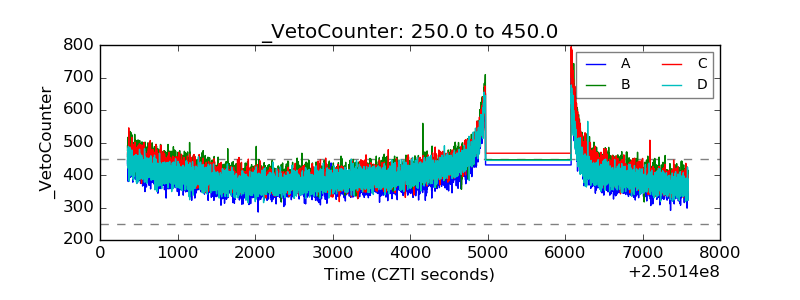 |