| Param | Original file | Final file |
|---|---|---|
| Filename | modeM0/AS1A04_022T07_9000001748_11828cztM0_level2.evt | modeM0/AS1A04_022T07_9000001748_11828cztM0_level2_quad_clean.evt |
| Size (bytes) | 615,677,760 | 75,479,040 |
| Size | 587.2 MB | 72.0 MB |
| Events in quadrant A | 3,255,270 | 476,128 |
| Events in quadrant B | 8,238,140 | 435,685 |
| Events in quadrant C | 3,003,803 | 464,468 |
| Events in quadrant D | 3,704,406 | 452,180 |
| Mode SS | |||
|---|---|---|---|
| Quadrant | BADHDUFLAG | Total packets | Discarded packets |
| A | 0 | 138 | 2 |
| B | 0 | 138 | 4 |
| C | 0 | 138 | 2 |
| D | 0 | 138 | 6 |
| Mode M9 | |||
|---|---|---|---|
| Quadrant | BADHDUFLAG | Total packets | Discarded packets |
| A | 0 | 6 | 0 |
| B | 0 | 6 | 0 |
| C | 0 | 6 | 0 |
| D | 0 | 6 | 0 |
| Mode M0 | |||
|---|---|---|---|
| Quadrant | BADHDUFLAG | Total packets | Discarded packets |
| A | 0 | 14377 | 328 |
| B | 0 | 30211 | 1397 |
| C | 0 | 13918 | 360 |
| D | 0 | 16061 | 329 |
| Quadrant | Total seconds | Saturated seconds | Saturation percentage |
|---|---|---|---|
| A | 6574 | 152 | 2.312139% |
| B | 6460 | 1990 | 30.804954% |
| C | 6566 | 103 | 1.568687% |
| D | 6574 | 177 | 2.692425% |
Noise dominated data is calculated using 1-second bins in cleaned event files. If a bin has >2000 counts, and if more than 50% of those come from <1% of pixels, then it is considered to be noise-dominated and hence unusable.
| Quadrant | # 1 sec bins | Bins with >0 counts | Bins with >2000 counts | High rate bins dominated by noise | Noise dominated (total time) | Noise dominated (detector-on time) | Marked lightcurve |
|---|---|---|---|---|---|---|---|
| A | 7398 | 6661 | 0 | 0 | 0.00% | 0.00% | 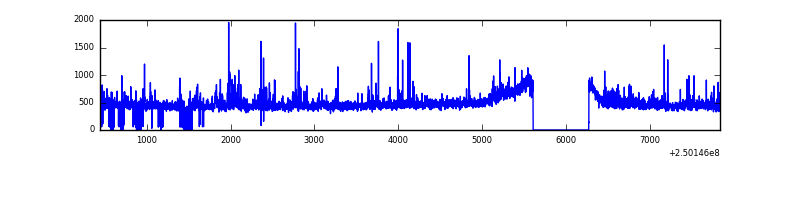 |
| B | 7398 | 6563 | 1517 | 1517 | 20.51% | 23.11% | 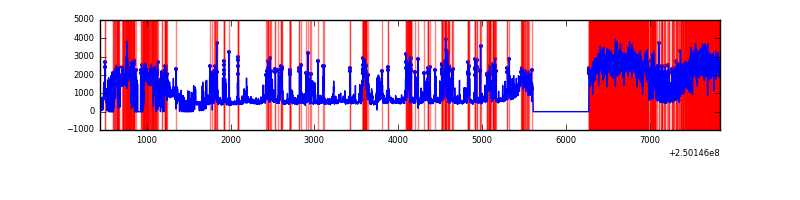 |
| C | 7398 | 6657 | 0 | 0 | 0.00% | 0.00% | 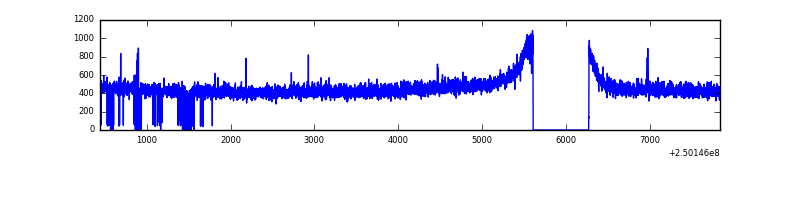 |
| D | 7398 | 6660 | 70 | 70 | 0.95% | 1.05% | 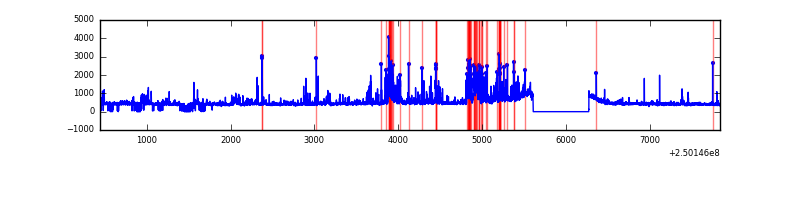 |
Top three noisy pixels from each quadrant. If the there are fewer than three noisy pixels in the level2.evt file, extra rows are filled as -1
| Pixel properties | Quadrant properties | ||||||
|---|---|---|---|---|---|---|---|
| Quadrant | DetID | PixID | Counts | Sigma | Mean | Median | Sigma |
| A | 1 | 162 | 83809 | 516.33 | 789 | 771 | 160.8 |
| A | 1 | 178 | 43150 | 263.51 | 789 | 771 | 160.8 |
| A | 1 | 161 | 38305 | 233.39 | 789 | 771 | 160.8 |
| B | 10 | 16 | 4501857 | 36338.41 | 651 | 636 | 123.9 |
| B | 4 | 239 | 644901 | 5201.16 | 651 | 636 | 123.9 |
| B | 3 | 64 | 419979 | 3385.36 | 651 | 636 | 123.9 |
| C | 13 | 61 | 5689 | 27.15 | 768 | 771 | 181.2 |
| C | 7 | 238 | 4425 | 20.17 | 768 | 771 | 181.2 |
| C | 12 | 4 | 3540 | 15.29 | 768 | 771 | 181.2 |
| D | 12 | 233 | 316255 | 1718.2 | 762 | 739 | 183.6 |
| D | 1 | 52 | 217850 | 1182.32 | 762 | 739 | 183.6 |
| D | 13 | 249 | 128018 | 693.12 | 762 | 739 | 183.6 |
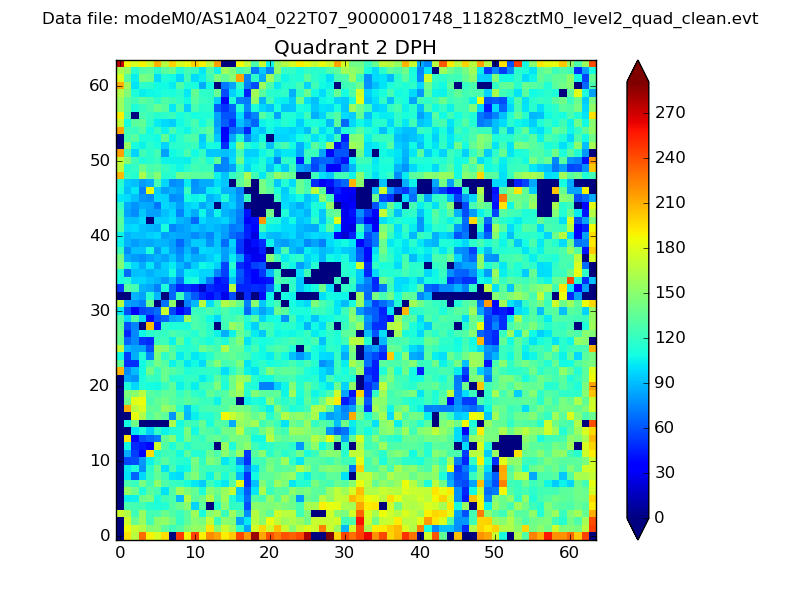
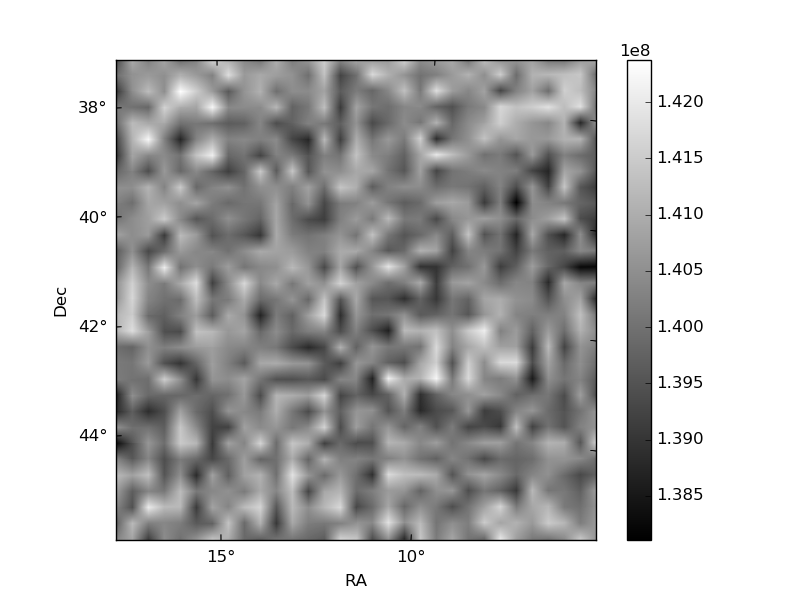
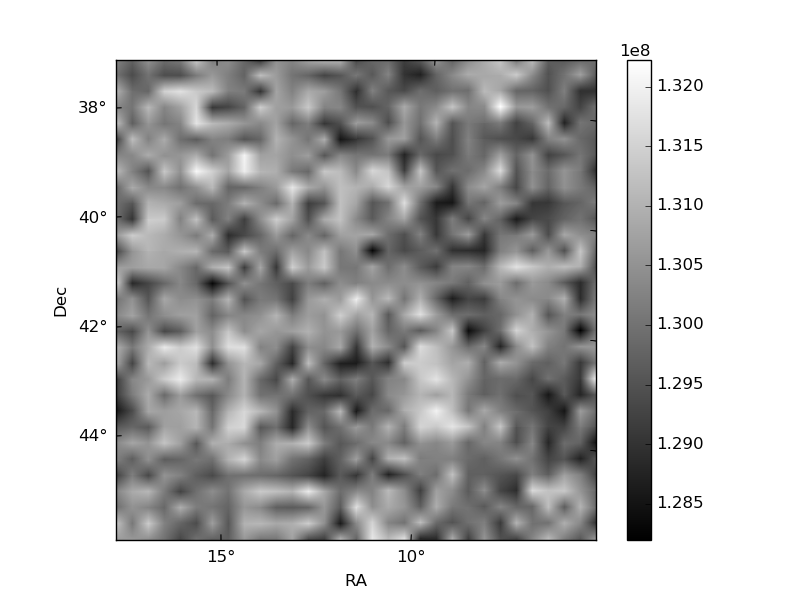
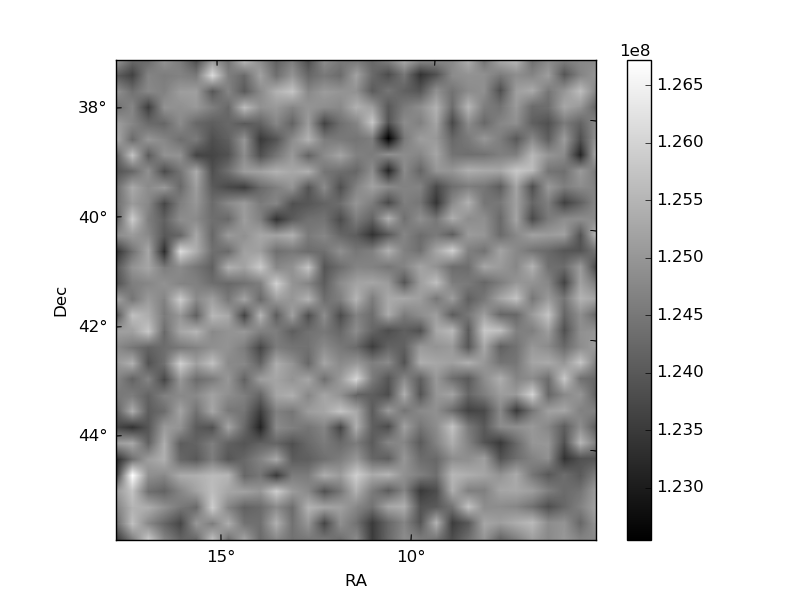
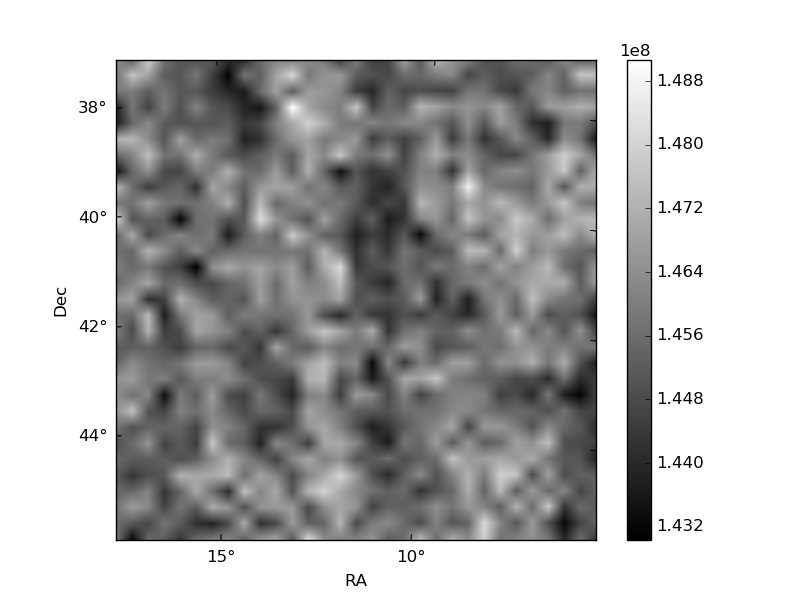
Histogram calculated using DETX and DETY for each event in the final _common_clean file
| Quadrant A | 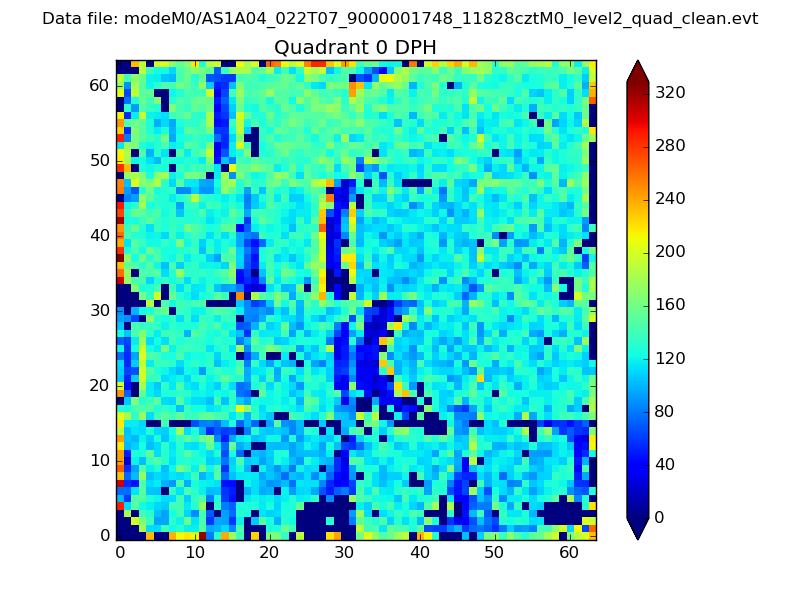 |
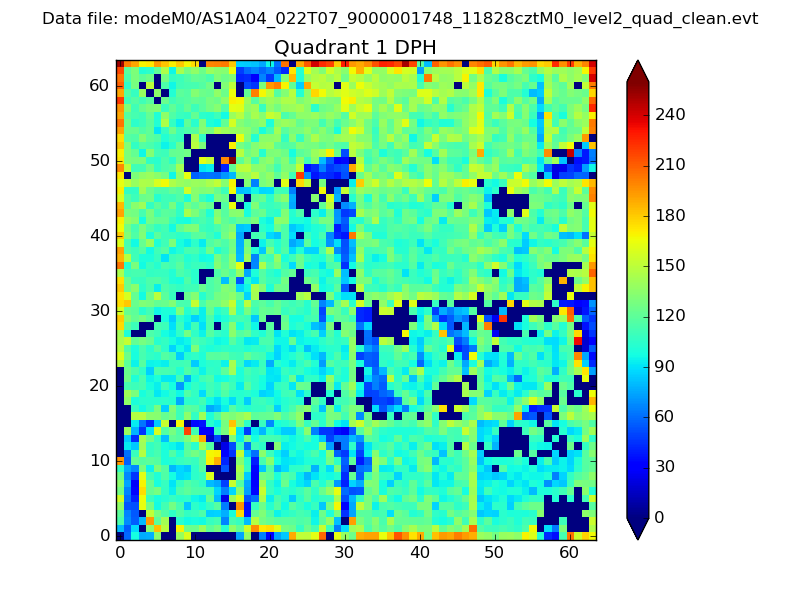 |
Quadrant B |
|---|---|---|---|
| Quadrant D | 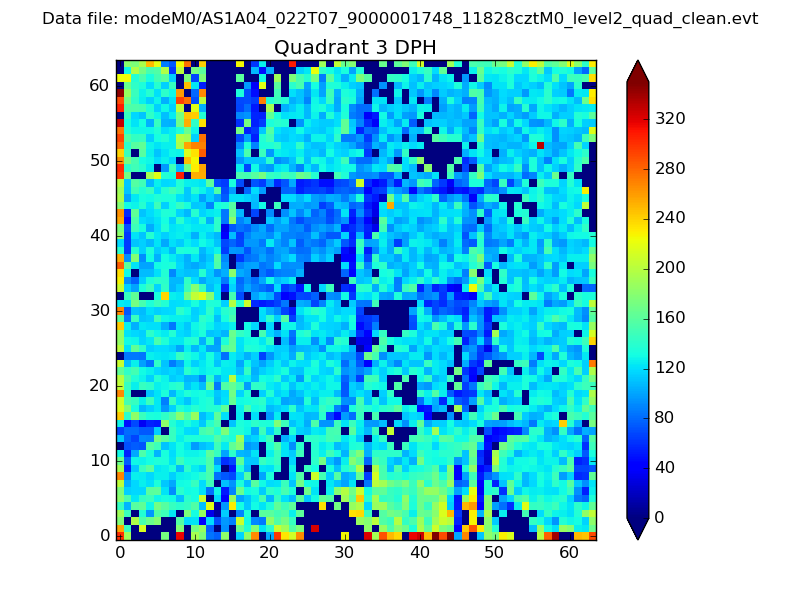 |
 |
Quadrant C |
| Plot type | Count rate plots | Images |
|---|---|---|
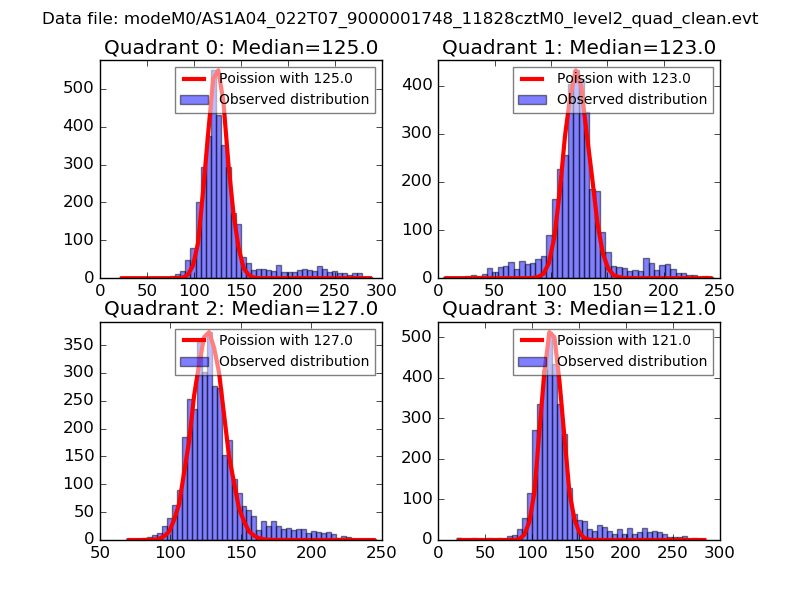
| Comparison with Poisson distribution Blue bars denote a histogram of data divided into 1 sec bins. Red curve is a Poisson curve with rate = median count rate of data. |
 |
 |
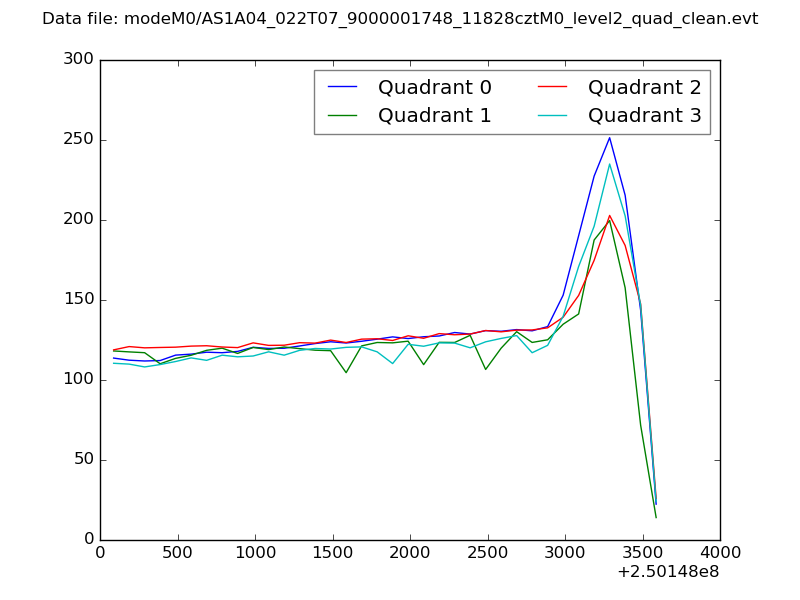
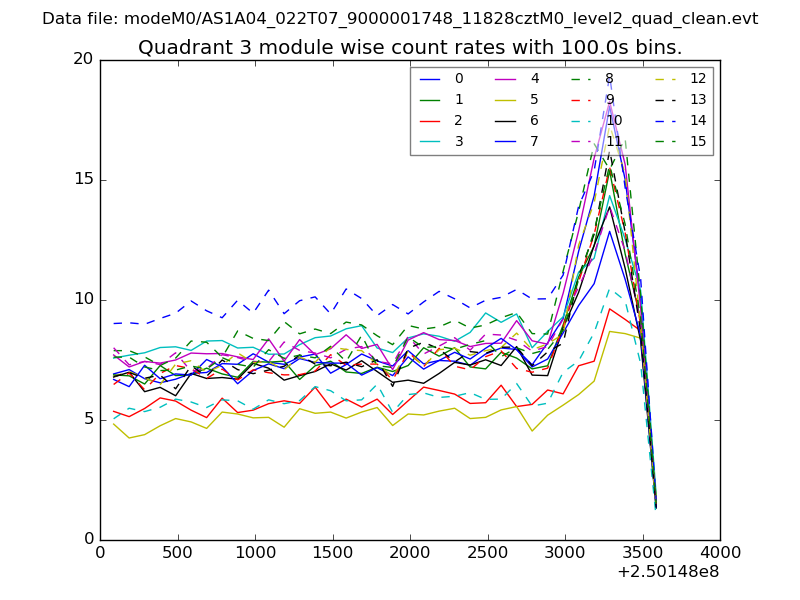
| Quadrant-wise count rates Data is divided into 100 sec bins |
 |
|
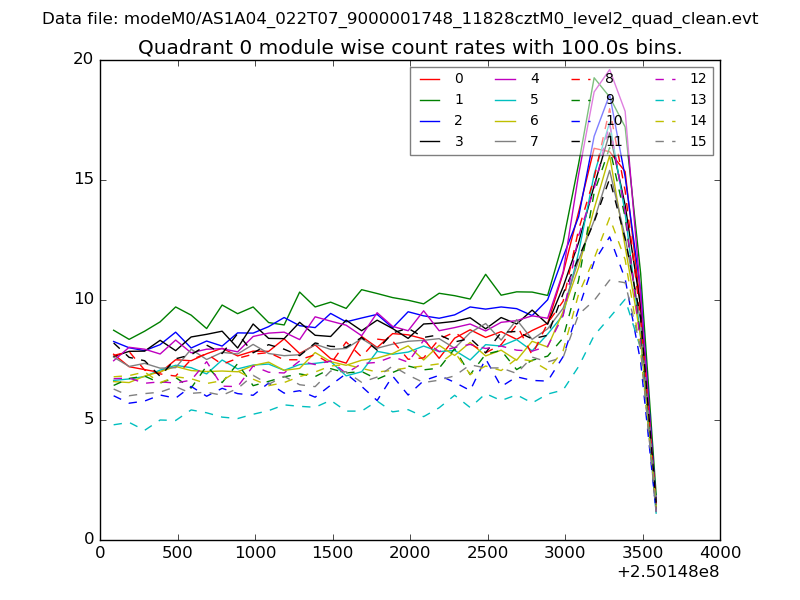
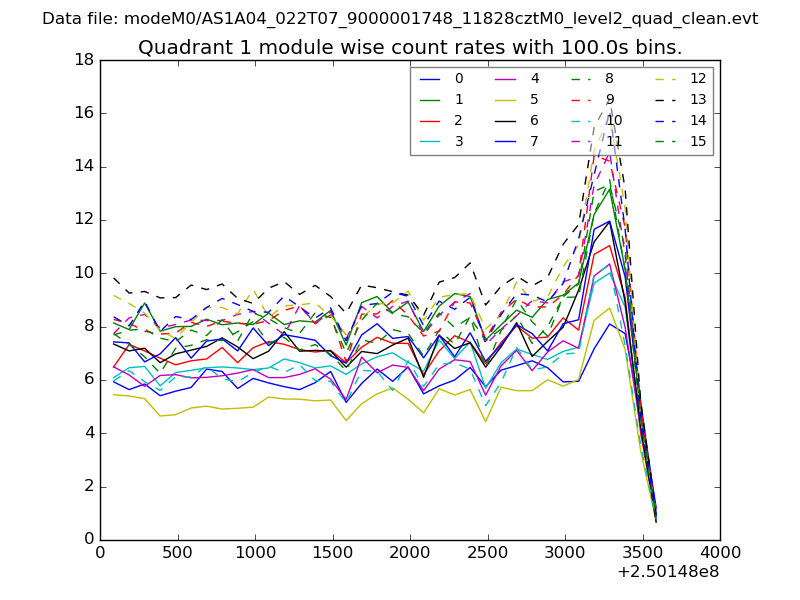
| Module-wise count rates for Quadrant A Data is divided into 100 sec bins |
 |
 |
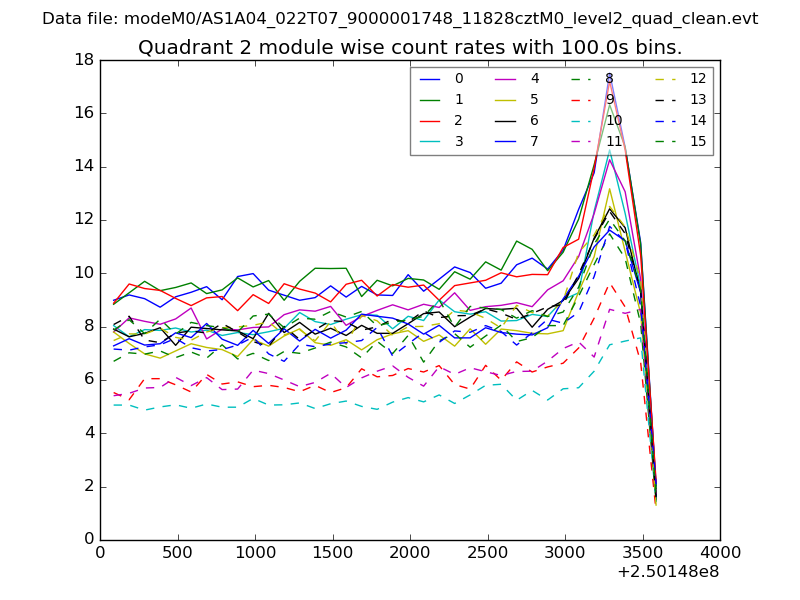
| Module-wise count rates for Quadrant B Data is divided into 100 sec bins |
 |
 |
| Module-wise count rates for Quadrant C Data is divided into 100 sec bins |
 |
 |
| Module-wise count rates for Quadrant D Data is divided into 100 sec bins |
 |
 |
| Parameter | Plot |
|---|---|
| CZT HV Monitor | 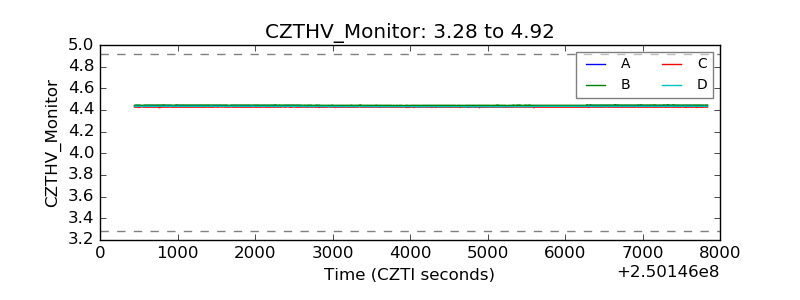 |
| D_VDD | 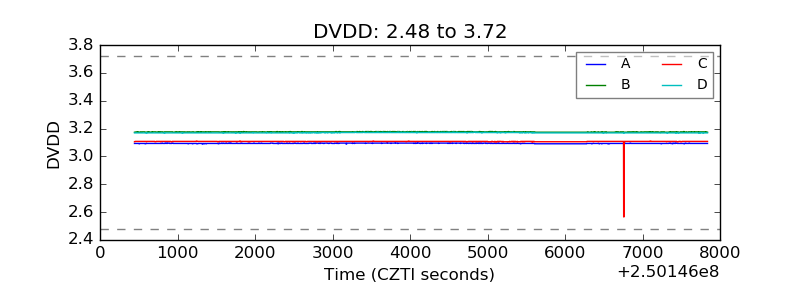 |
| Temperature 1 | 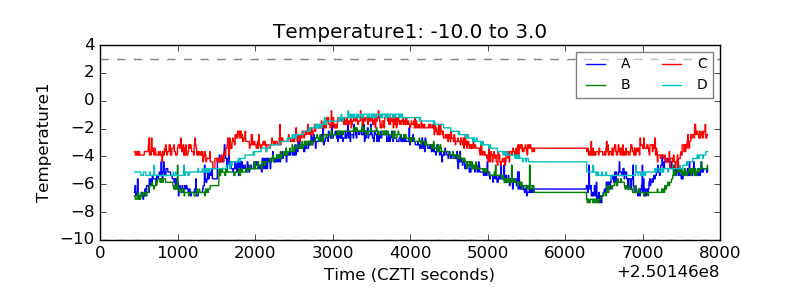 |
| Veto HV Monitor | 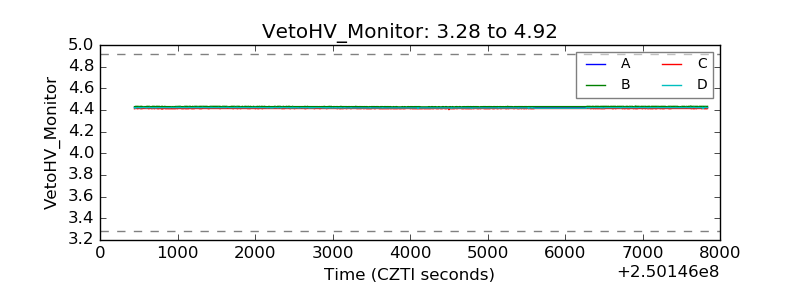 |
| Veto LLD |  |
| Alpha Counter | 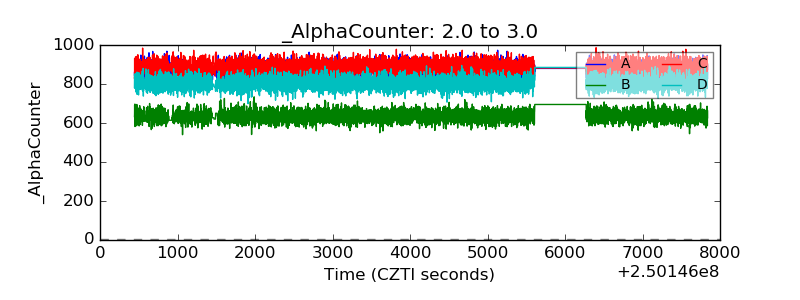 |
| _CPM_Rate | 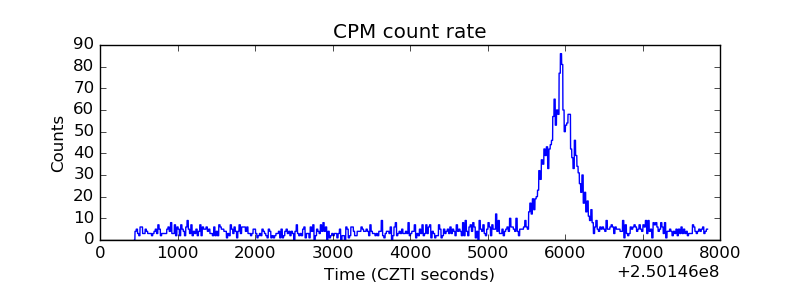 |
| CZT Counter | 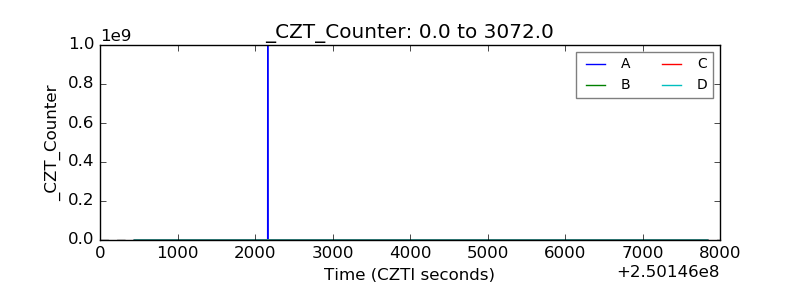 |
| +2.5 Volts monitor |  |
| +5 Volts monitor | 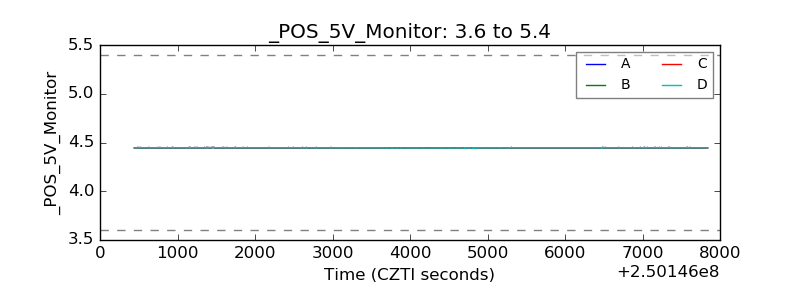 |
| _ROLL_ROT | 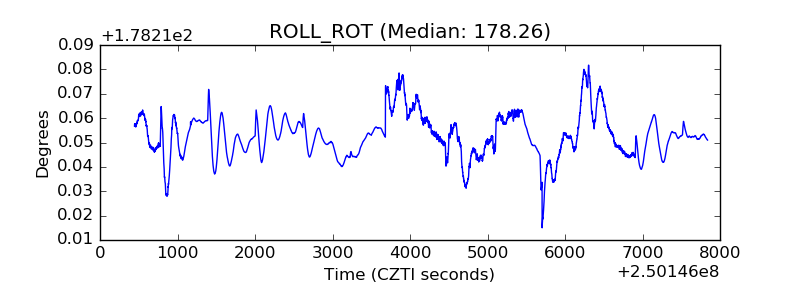 |
| _Roll_DEC | 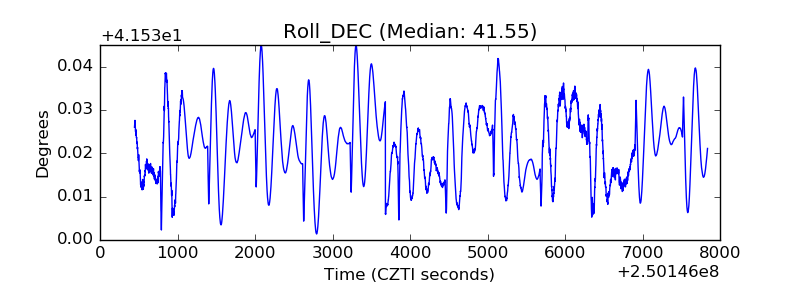 |
| _Roll_RA | 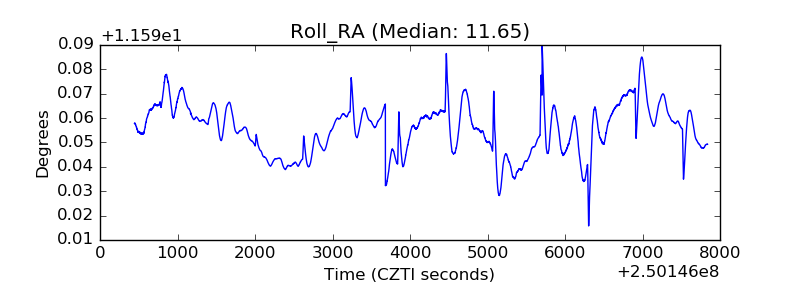 |
| Veto Counter | 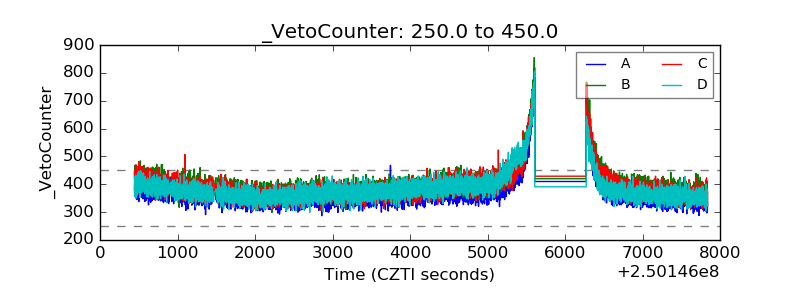 |