| Param | Original file | Final file |
|---|---|---|
| Filename | modeM0/AS1A04_022T07_9000001748_11829cztM0_level2.evt | modeM0/AS1A04_022T07_9000001748_11829cztM0_level2_quad_clean.evt |
| Size (bytes) | 1,024,902,720 | 73,644,480 |
| Size | 977.4 MB | 70.2 MB |
| Events in quadrant A | 3,772,656 | 531,756 |
| Events in quadrant B | 19,213,166 | 129,782 |
| Events in quadrant C | 3,530,902 | 521,389 |
| Events in quadrant D | 4,002,077 | 509,713 |
| Mode SS | |||
|---|---|---|---|
| Quadrant | BADHDUFLAG | Total packets | Discarded packets |
| A | 0 | 156 | 0 |
| B | 0 | 156 | 0 |
| C | 0 | 156 | 0 |
| D | 0 | 156 | 0 |
| Mode M9 | |||
|---|---|---|---|
| Quadrant | BADHDUFLAG | Total packets | Discarded packets |
| A | 0 | 1 | 0 |
| B | 0 | 1 | 0 |
| C | 0 | 1 | 0 |
| D | 0 | 1 | 0 |
| Mode M0 | |||
|---|---|---|---|
| Quadrant | BADHDUFLAG | Total packets | Discarded packets |
| A | 0 | 16335 | 0 |
| B | 0 | 62132 | 0 |
| C | 0 | 15939 | 0 |
| D | 0 | 17321 | 0 |
| Quadrant | Total seconds | Saturated seconds | Saturation percentage |
|---|---|---|---|
| A | 7695 | 309 | 4.015595% |
| B | 7695 | 7052 | 91.643925% |
| C | 7695 | 210 | 2.729045% |
| D | 7696 | 277 | 3.599272% |
Noise dominated data is calculated using 1-second bins in cleaned event files. If a bin has >2000 counts, and if more than 50% of those come from <1% of pixels, then it is considered to be noise-dominated and hence unusable.
| Quadrant | # 1 sec bins | Bins with >0 counts | Bins with >2000 counts | High rate bins dominated by noise | Noise dominated (total time) | Noise dominated (detector-on time) | Marked lightcurve |
|---|---|---|---|---|---|---|---|
| A | 7786 | 7699 | 2 | 2 | 0.03% | 0.03% |  |
| B | 7786 | 7699 | 6525 | 6525 | 83.80% | 84.75% | 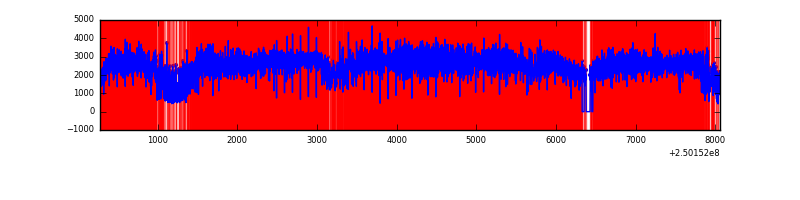 |
| C | 7786 | 7699 | 0 | 0 | 0.00% | 0.00% | 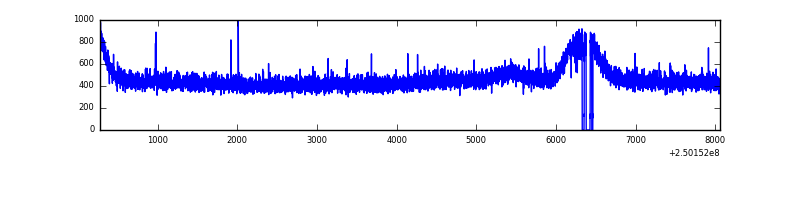 |
| D | 7787 | 7700 | 35 | 35 | 0.45% | 0.45% | 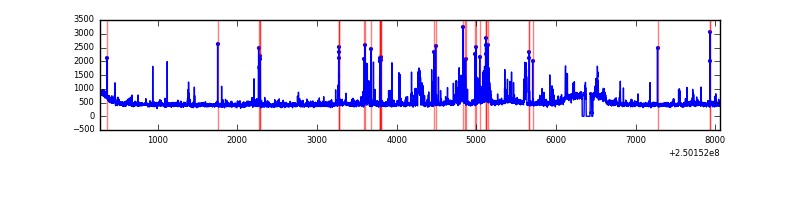 |
Top three noisy pixels from each quadrant. If the there are fewer than three noisy pixels in the level2.evt file, extra rows are filled as -1
| Pixel properties | Quadrant properties | ||||||
|---|---|---|---|---|---|---|---|
| Quadrant | DetID | PixID | Counts | Sigma | Mean | Median | Sigma |
| A | 1 | 162 | 81362 | 426.46 | 921 | 899 | 188.7 |
| A | 1 | 178 | 40580 | 210.31 | 921 | 899 | 188.7 |
| A | 1 | 161 | 35811 | 185.04 | 921 | 899 | 188.7 |
| B | 10 | 16 | 17484158 | 261521.83 | 343 | 335 | 66.9 |
| B | 4 | 239 | 238434 | 3561.47 | 343 | 335 | 66.9 |
| B | 3 | 64 | 75377 | 1122.47 | 343 | 335 | 66.9 |
| C | 13 | 61 | 6639 | 27.41 | 903 | 906 | 209.2 |
| C | 14 | 234 | 3912 | 14.37 | 903 | 906 | 209.2 |
| C | 8 | 222 | 3741 | 13.55 | 903 | 906 | 209.2 |
| D | 1 | 52 | 232742 | 1078.66 | 895 | 867 | 215.0 |
| D | 13 | 249 | 92781 | 427.57 | 895 | 867 | 215.0 |
| D | 13 | 104 | 55285 | 253.15 | 895 | 867 | 215.0 |
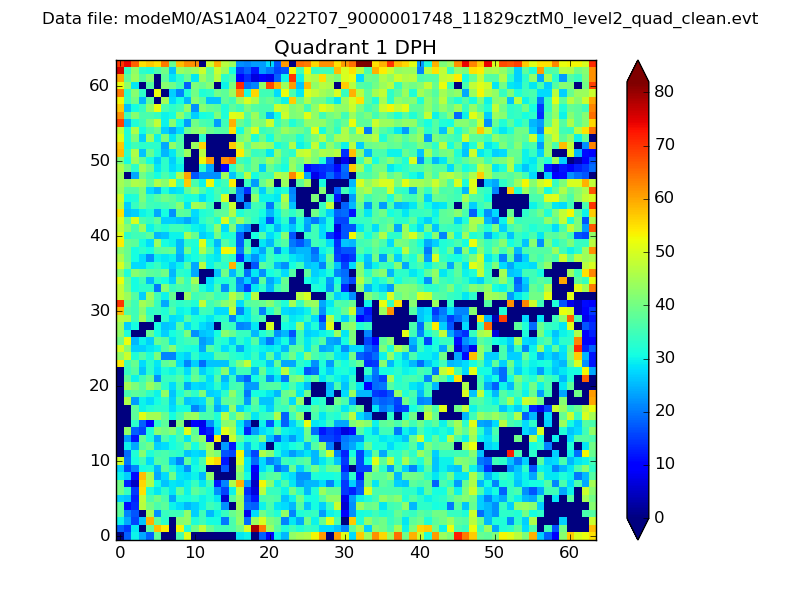
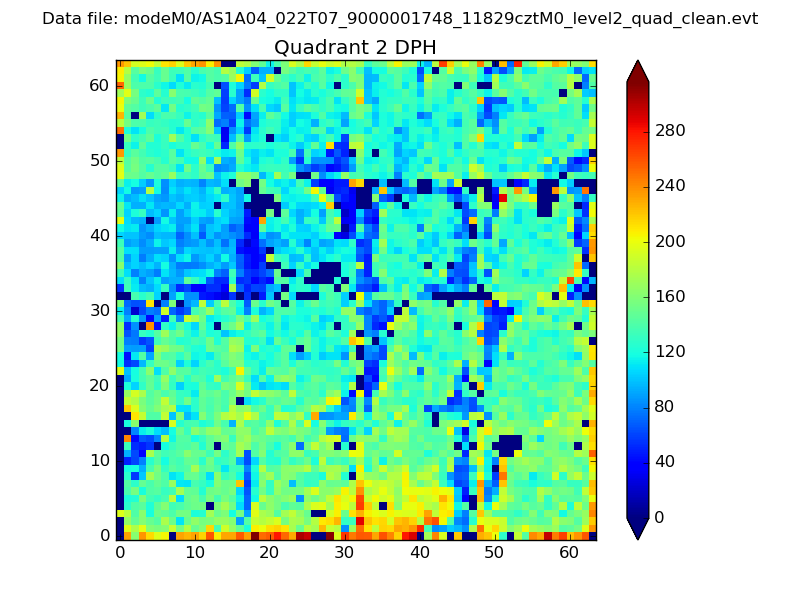
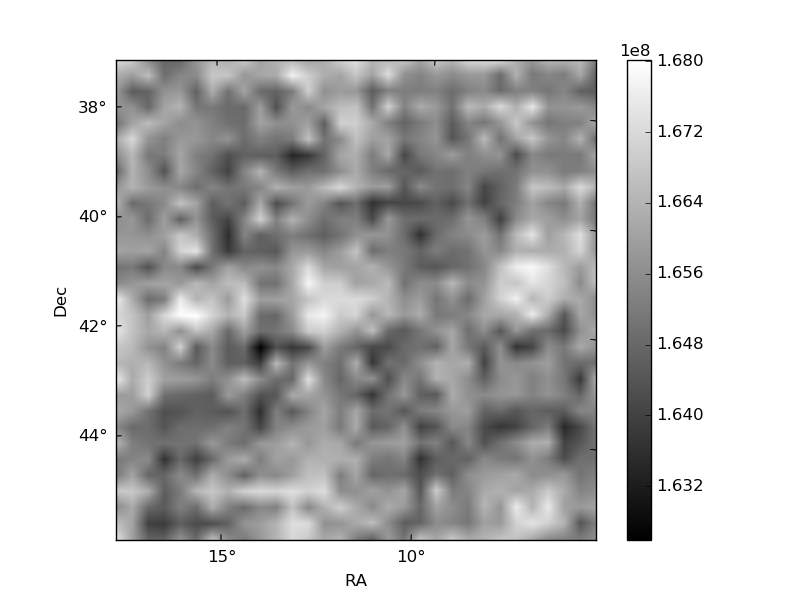
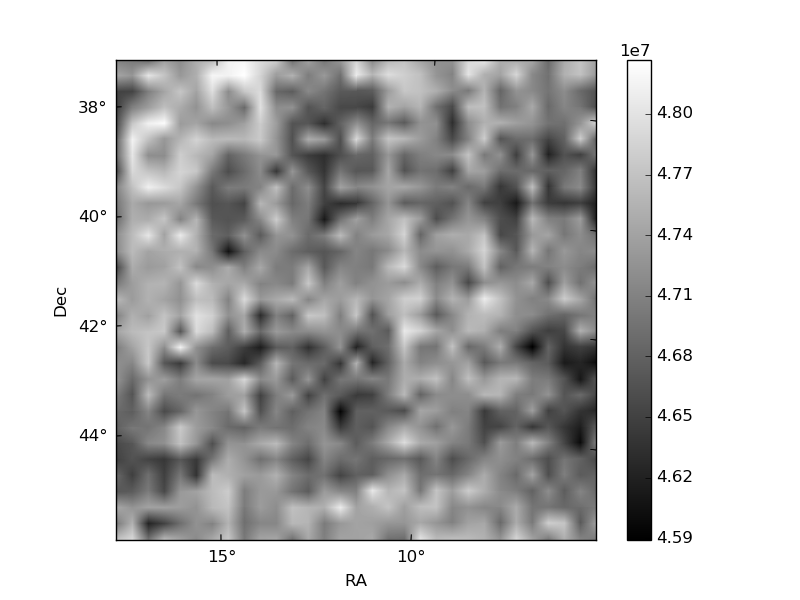
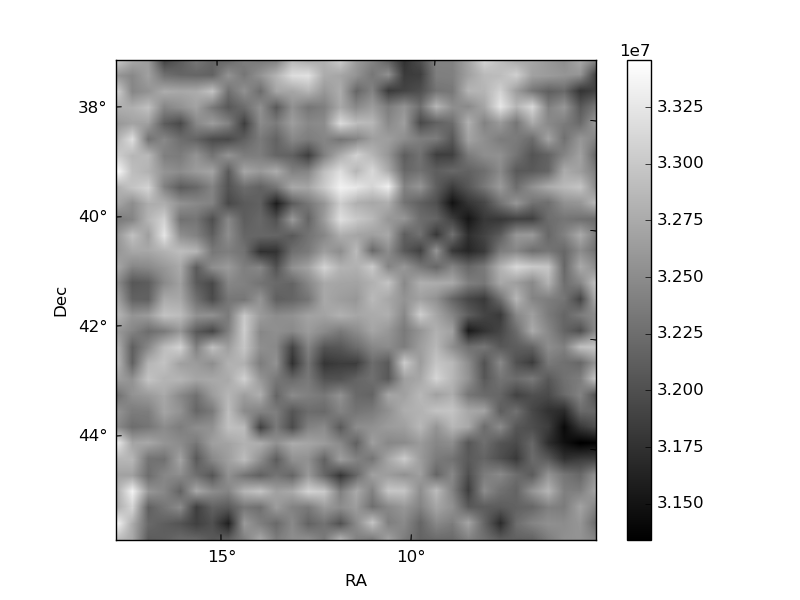
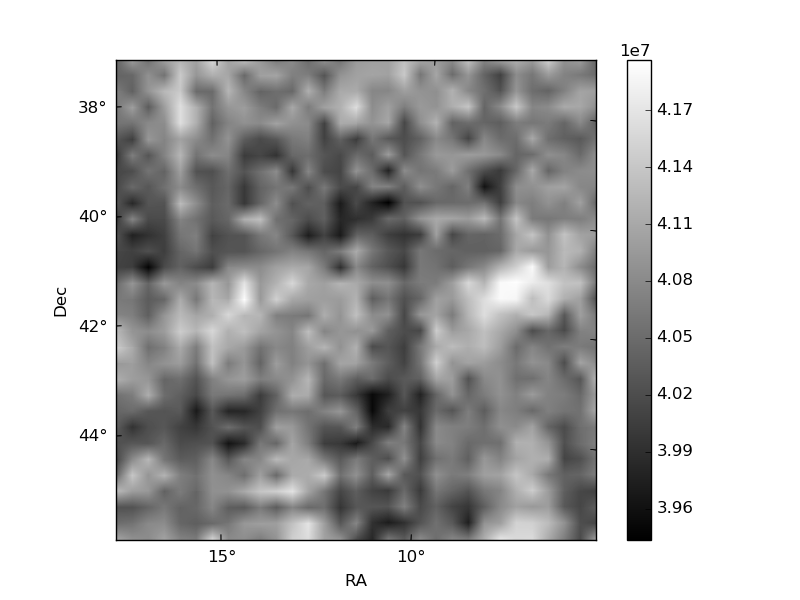
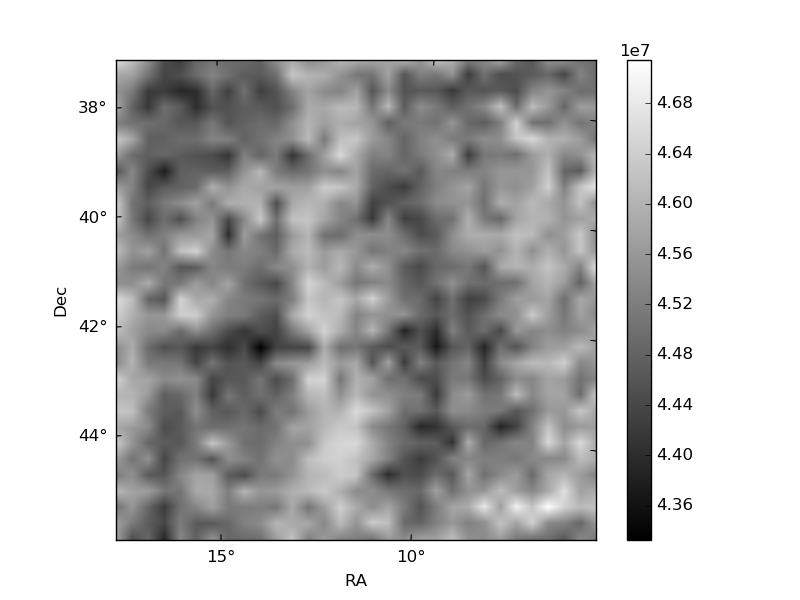
Histogram calculated using DETX and DETY for each event in the final _common_clean file
| Quadrant A | 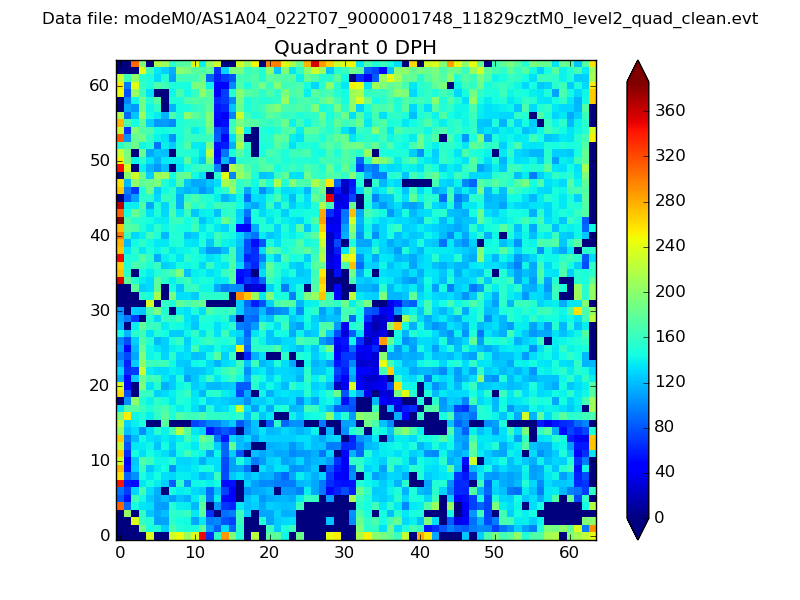 |
 |
Quadrant B |
|---|---|---|---|
| Quadrant D | 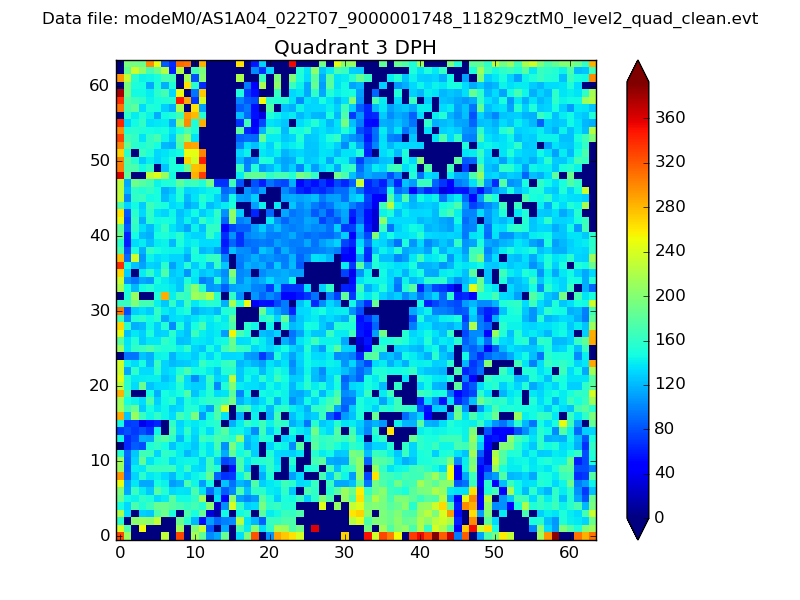 |
 |
Quadrant C |
| Plot type | Count rate plots | Images |
|---|---|---|
| Comparison with Poisson distribution Blue bars denote a histogram of data divided into 1 sec bins. Red curve is a Poisson curve with rate = median count rate of data. |
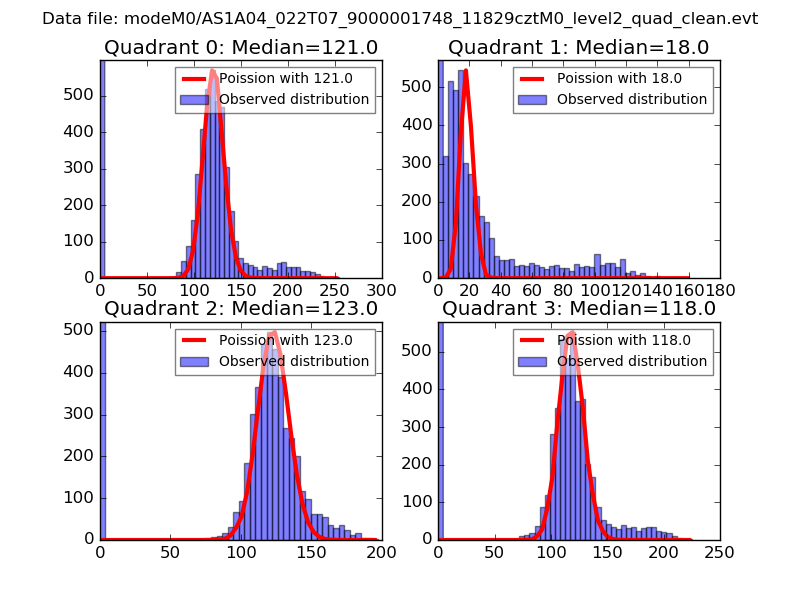 |
 |
| Quadrant-wise count rates Data is divided into 100 sec bins |
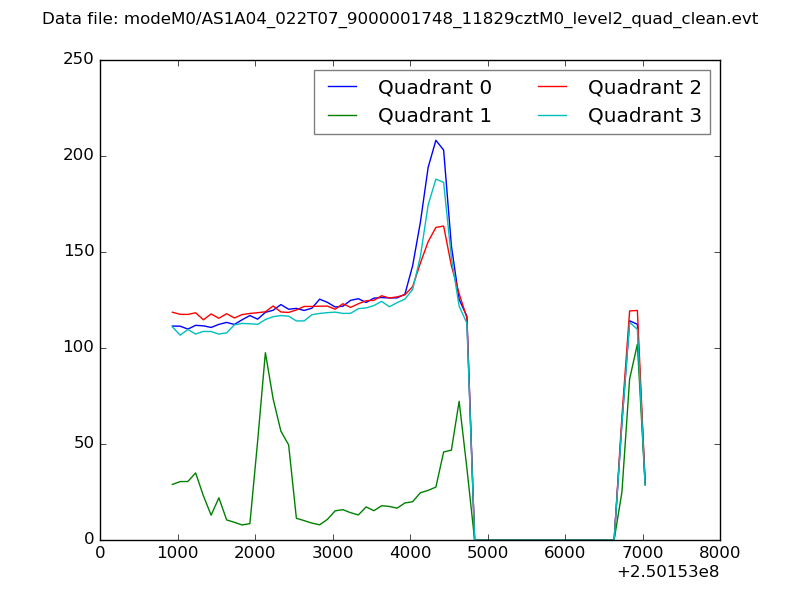 |
|
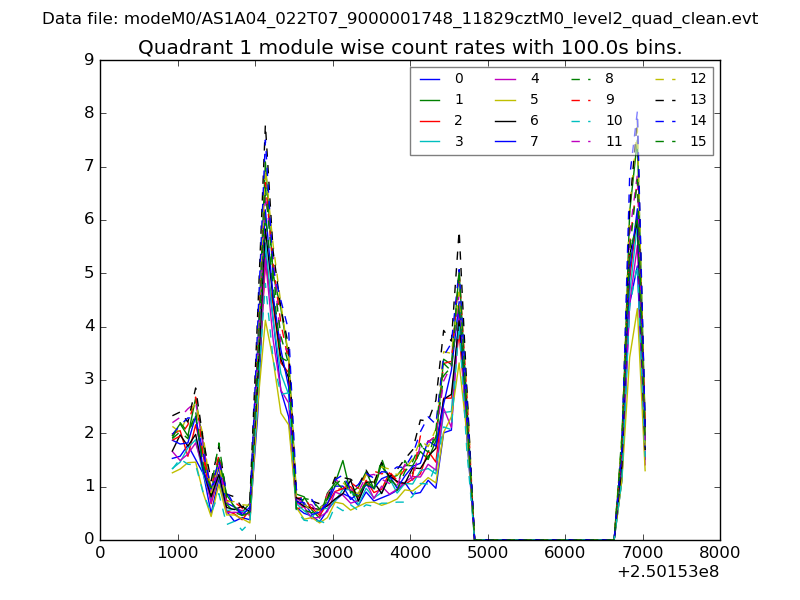
| Module-wise count rates for Quadrant A Data is divided into 100 sec bins |
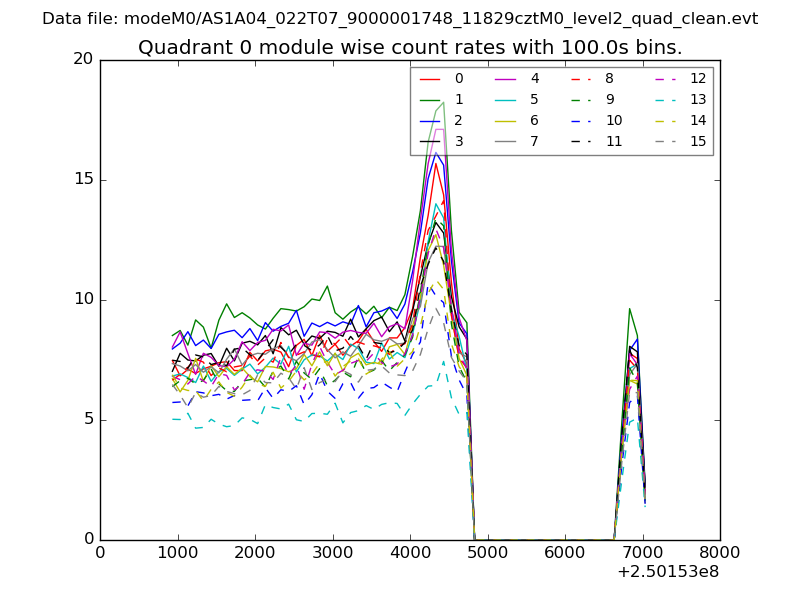 |
 |
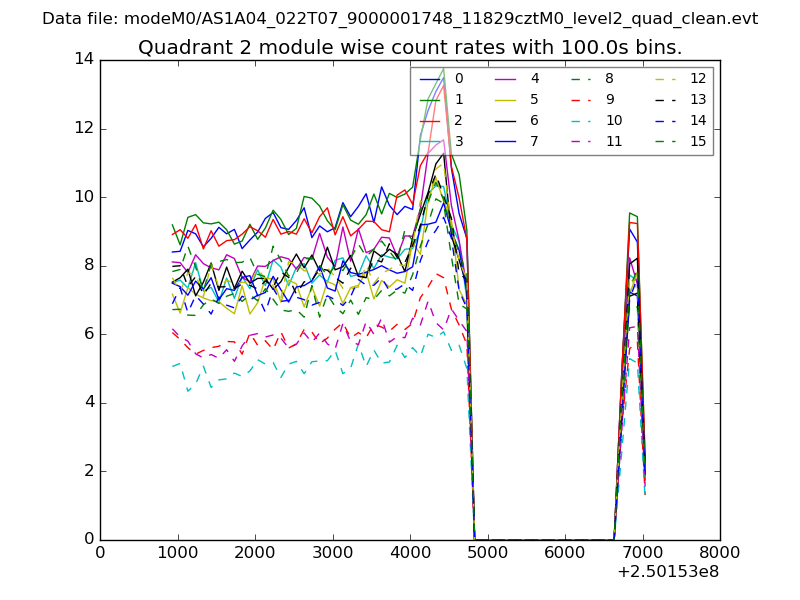
| Module-wise count rates for Quadrant B Data is divided into 100 sec bins |
 |
 |
| Module-wise count rates for Quadrant C Data is divided into 100 sec bins |
 |
 |
| Module-wise count rates for Quadrant D Data is divided into 100 sec bins |
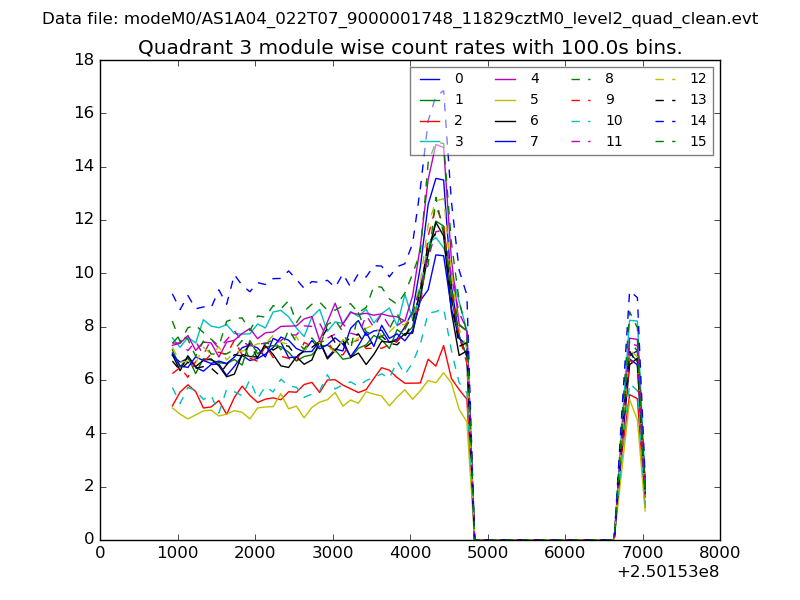 |
 |
| Parameter | Plot |
|---|---|
| CZT HV Monitor | 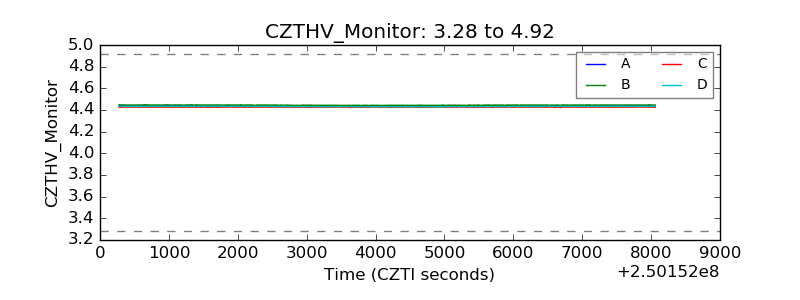 |
| D_VDD | 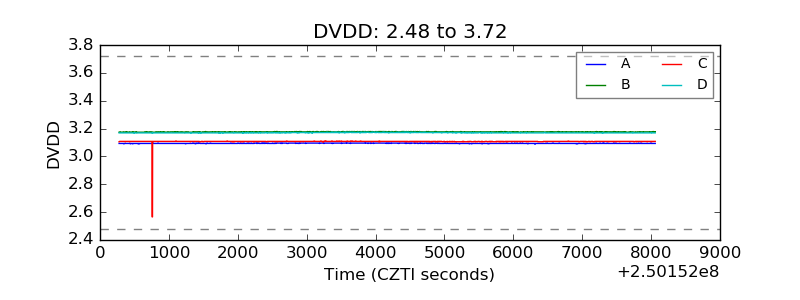 |
| Temperature 1 | 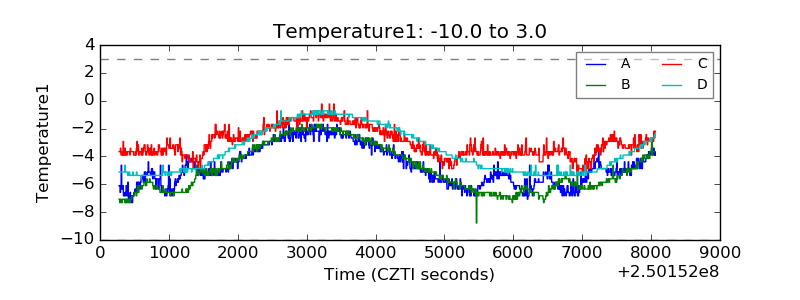 |
| Veto HV Monitor | 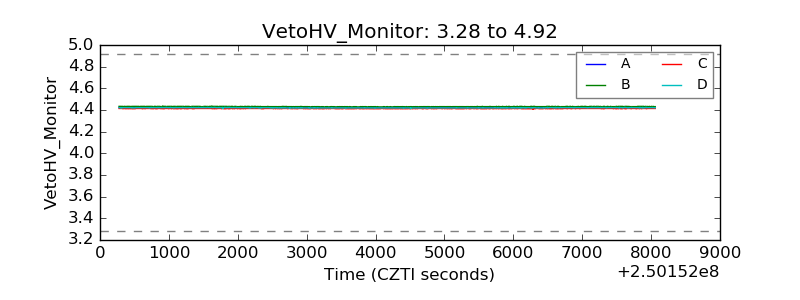 |
| Veto LLD | 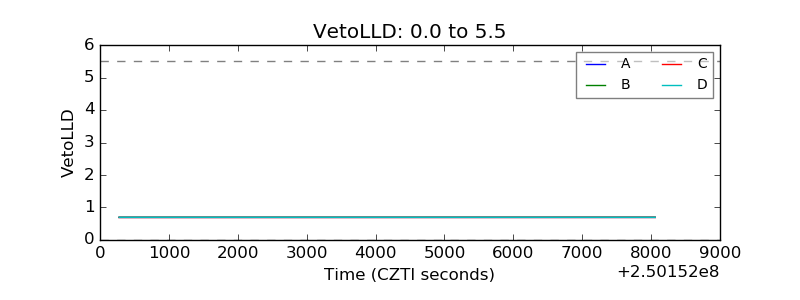 |
| Alpha Counter | 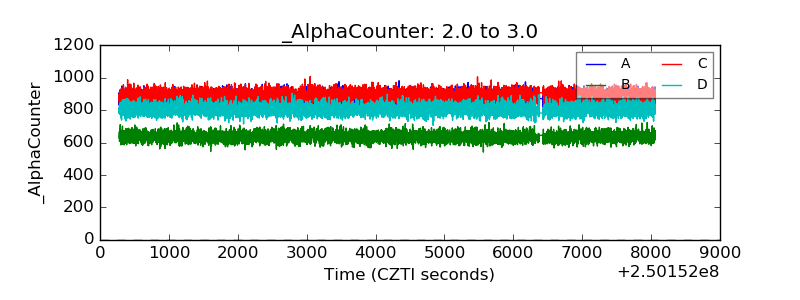 |
| _CPM_Rate | 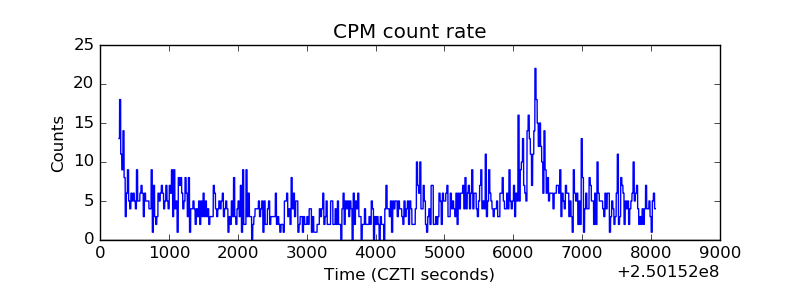 |
| CZT Counter | 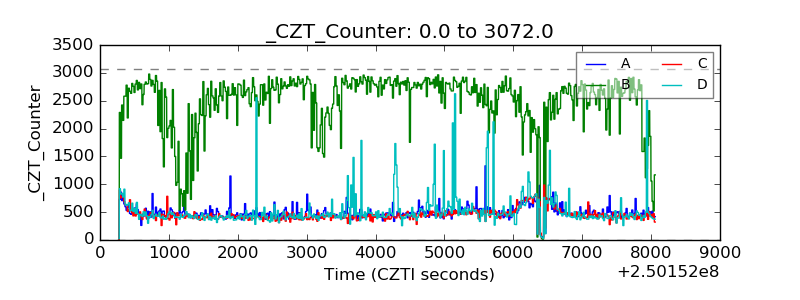 |
| +2.5 Volts monitor |  |
| +5 Volts monitor |  |
| _ROLL_ROT | 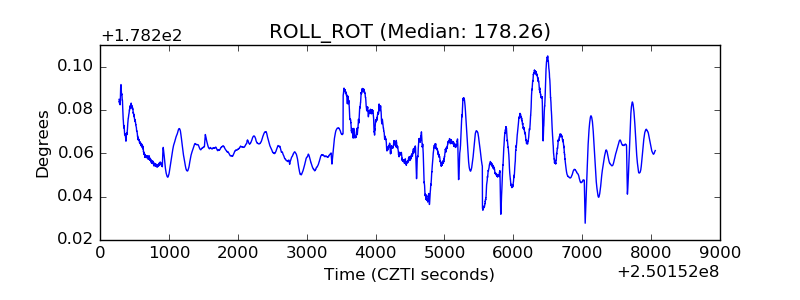 |
| _Roll_DEC | 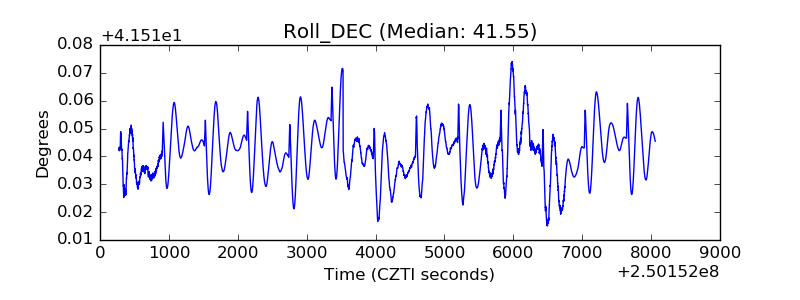 |
| _Roll_RA | 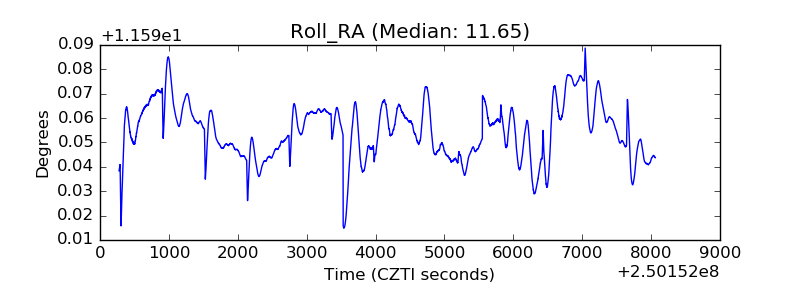 |
| Veto Counter | 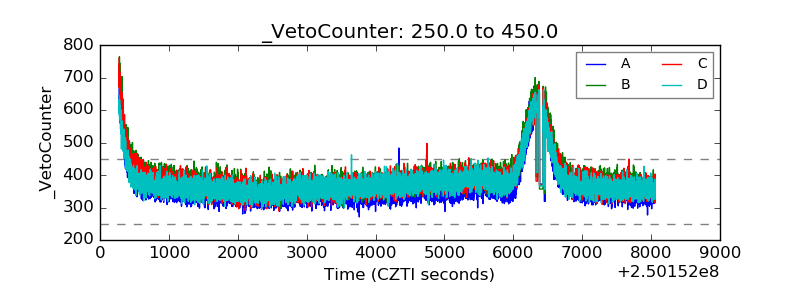 |