| Param | Original file | Final file |
|---|---|---|
| Filename | modeM0/AS1A04_022T07_9000001748_11830cztM0_level2.evt | modeM0/AS1A04_022T07_9000001748_11830cztM0_level2_quad_clean.evt |
| Size (bytes) | 872,746,560 | 83,505,600 |
| Size | 832.3 MB | 79.6 MB |
| Events in quadrant A | 3,667,271 | 551,966 |
| Events in quadrant B | 13,734,045 | 362,424 |
| Events in quadrant C | 3,412,371 | 563,912 |
| Events in quadrant D | 5,107,159 | 523,887 |
| Mode SS | |||
|---|---|---|---|
| Quadrant | BADHDUFLAG | Total packets | Discarded packets |
| A | 0 | 152 | 0 |
| B | 0 | 152 | 0 |
| C | 0 | 152 | 0 |
| D | 0 | 152 | 0 |
| Mode M0 | |||
|---|---|---|---|
| Quadrant | BADHDUFLAG | Total packets | Discarded packets |
| A | 0 | 15924 | 1 |
| B | 0 | 45960 | 0 |
| C | 0 | 15544 | 0 |
| D | 0 | 20384 | 0 |
| Quadrant | Total seconds | Saturated seconds | Saturation percentage |
|---|---|---|---|
| A | 7540 | 176 | 2.334218% |
| B | 7540 | 4561 | 60.490716% |
| C | 7540 | 65 | 0.862069% |
| D | 7540 | 370 | 4.907162% |
Noise dominated data is calculated using 1-second bins in cleaned event files. If a bin has >2000 counts, and if more than 50% of those come from <1% of pixels, then it is considered to be noise-dominated and hence unusable.
| Quadrant | # 1 sec bins | Bins with >0 counts | Bins with >2000 counts | High rate bins dominated by noise | Noise dominated (total time) | Noise dominated (detector-on time) | Marked lightcurve |
|---|---|---|---|---|---|---|---|
| A | 7541 | 7541 | 2 | 2 | 0.03% | 0.03% | 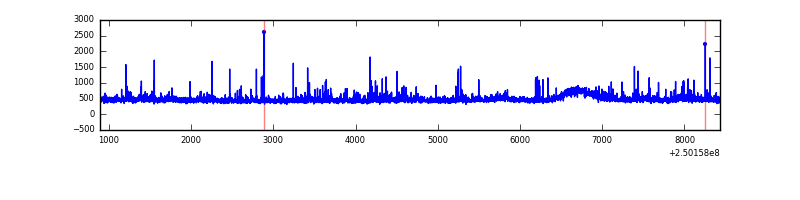 |
| B | 7541 | 7541 | 4068 | 4068 | 53.95% | 53.95% | 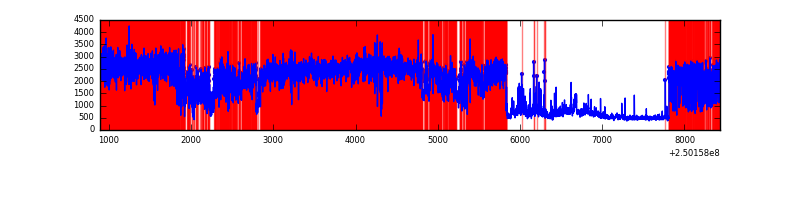 |
| C | 7541 | 7541 | 6 | 6 | 0.08% | 0.08% |  |
| D | 7541 | 7541 | 295 | 295 | 3.91% | 3.91% | 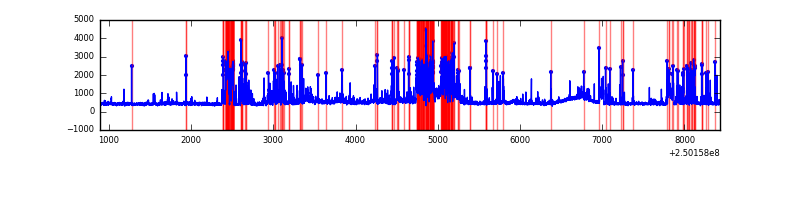 |
Top three noisy pixels from each quadrant. If the there are fewer than three noisy pixels in the level2.evt file, extra rows are filled as -1
| Pixel properties | Quadrant properties | ||||||
|---|---|---|---|---|---|---|---|
| Quadrant | DetID | PixID | Counts | Sigma | Mean | Median | Sigma |
| A | 1 | 162 | 91093 | 495.66 | 885 | 862 | 182.0 |
| A | 1 | 178 | 46728 | 251.95 | 885 | 862 | 182.0 |
| A | 1 | 161 | 41593 | 223.75 | 885 | 862 | 182.0 |
| B | 10 | 16 | 10083414 | 79537.37 | 663 | 645 | 126.8 |
| B | 4 | 239 | 638798 | 5034.03 | 663 | 645 | 126.8 |
| B | 15 | 204 | 239994 | 1888.09 | 663 | 645 | 126.8 |
| C | 7 | 238 | 31046 | 149.73 | 866 | 870 | 201.5 |
| C | 13 | 61 | 6474 | 27.81 | 866 | 870 | 201.5 |
| C | 8 | 222 | 4593 | 18.47 | 866 | 870 | 201.5 |
| D | 12 | 233 | 674607 | 3263.18 | 852 | 829 | 206.5 |
| D | 5 | 222 | 528297 | 2554.59 | 852 | 829 | 206.5 |
| D | 1 | 52 | 445570 | 2153.93 | 852 | 829 | 206.5 |
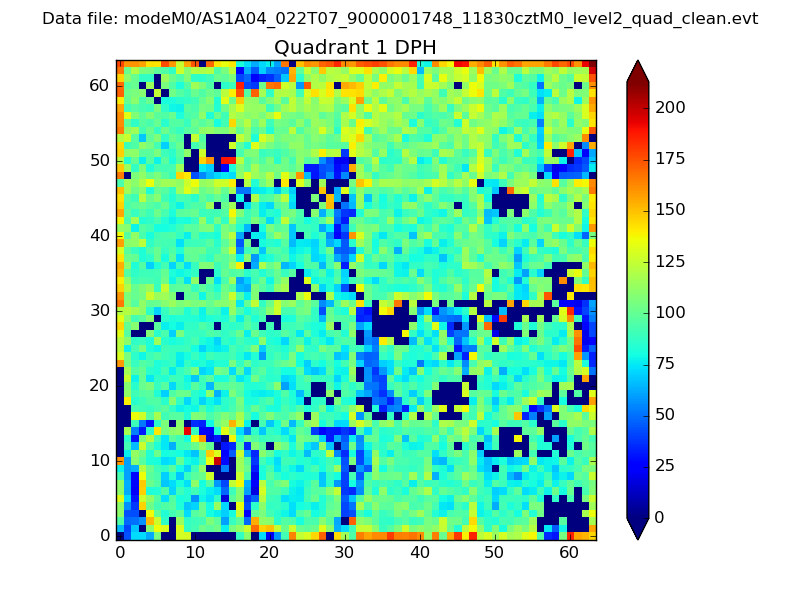
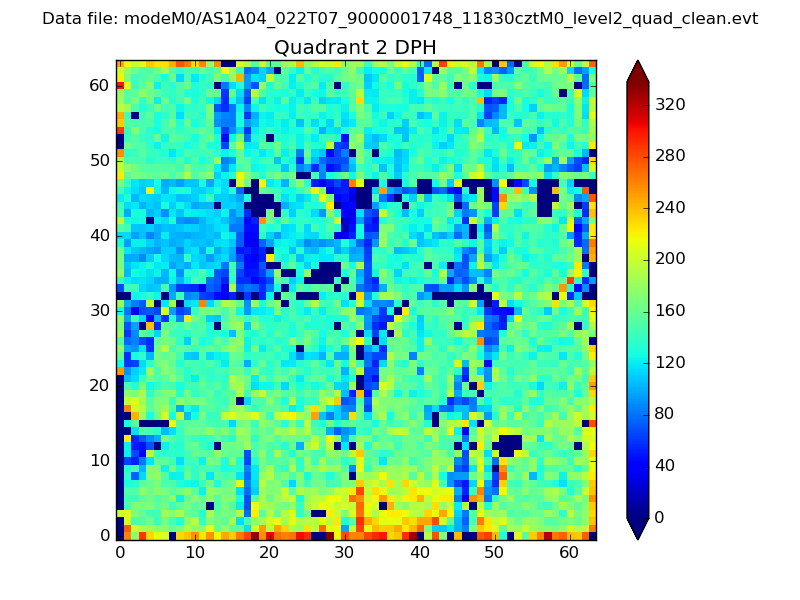
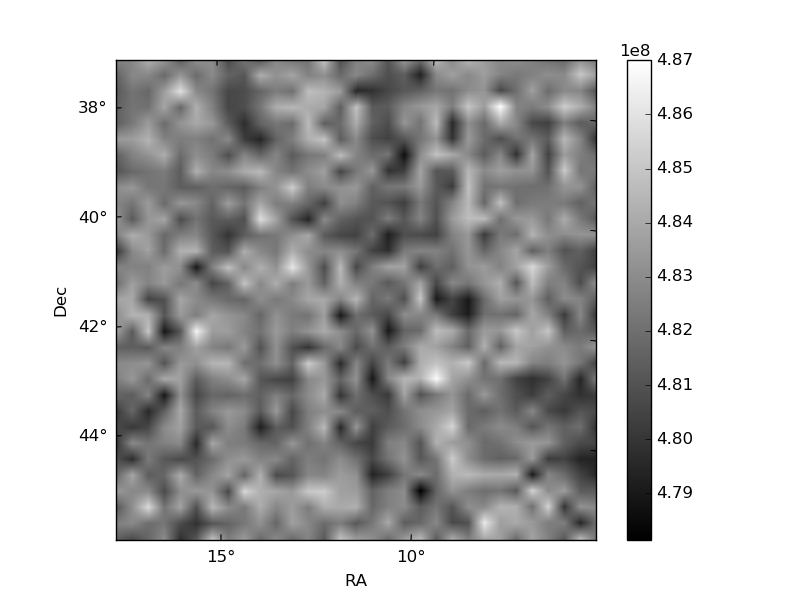
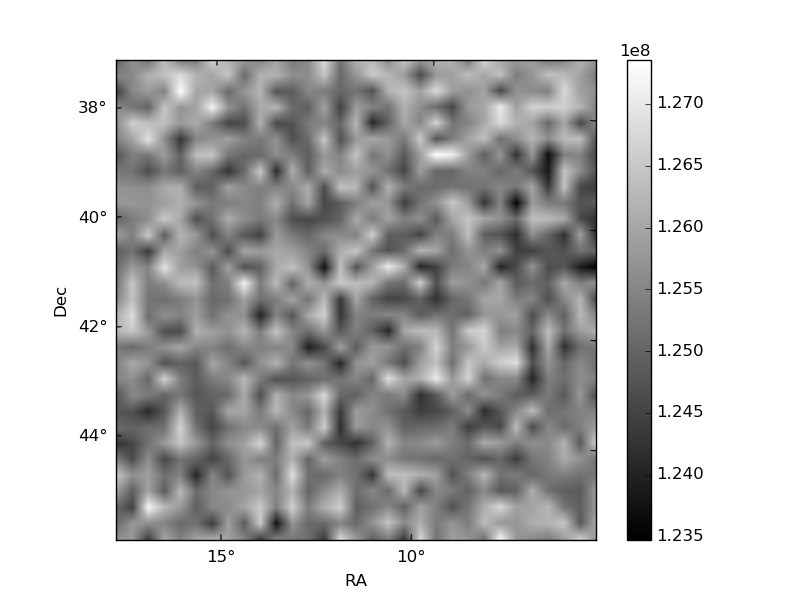
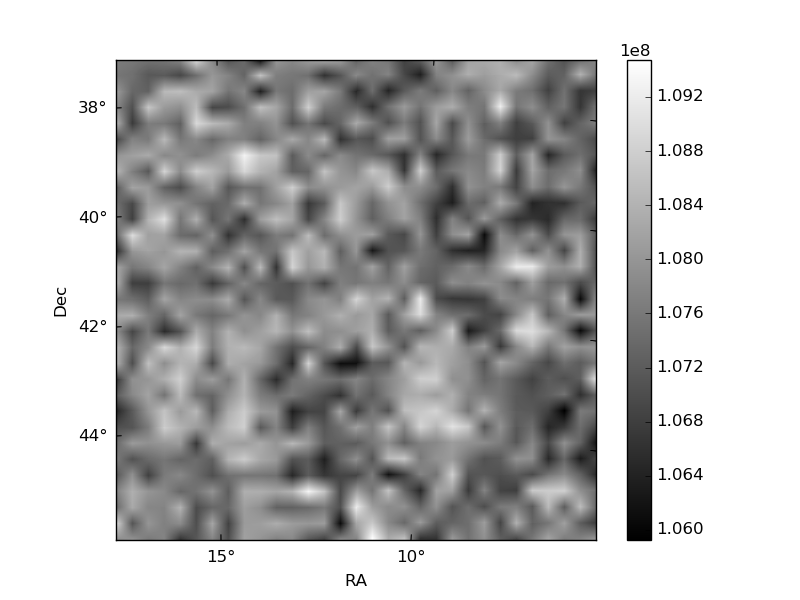
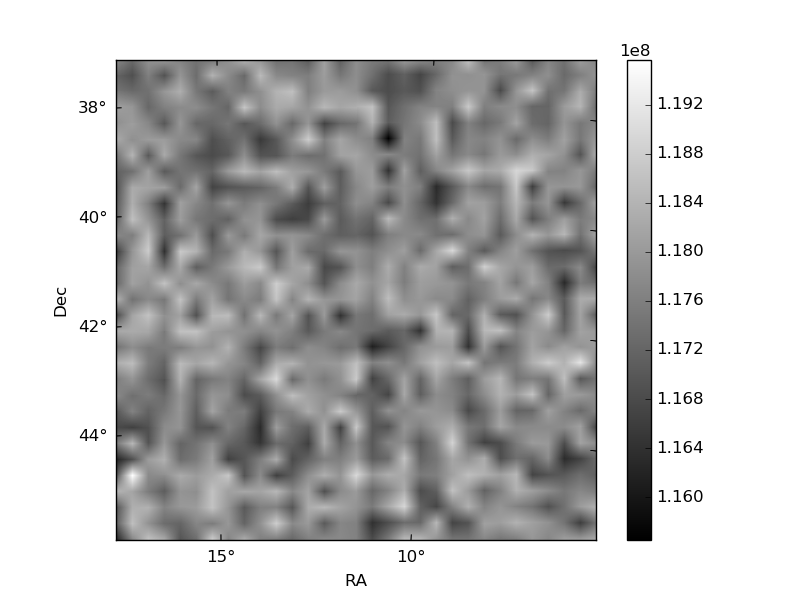
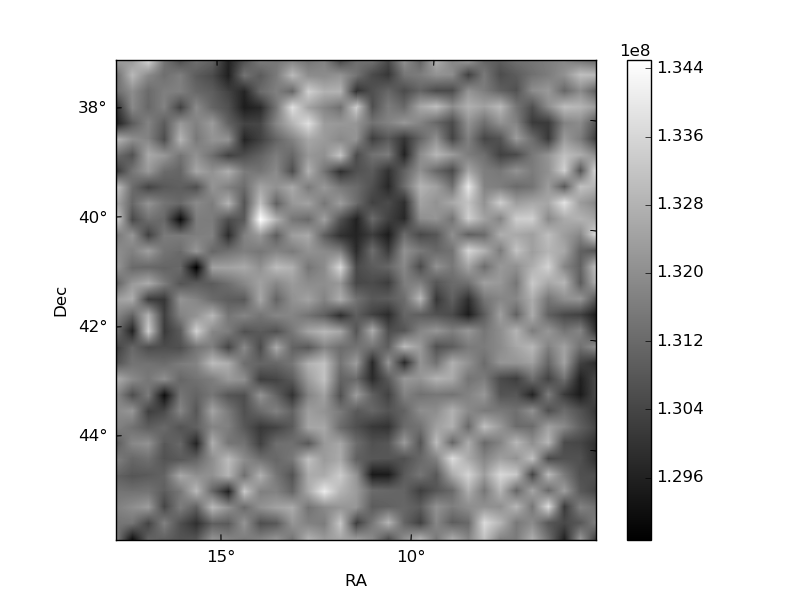
Histogram calculated using DETX and DETY for each event in the final _common_clean file
| Quadrant A | 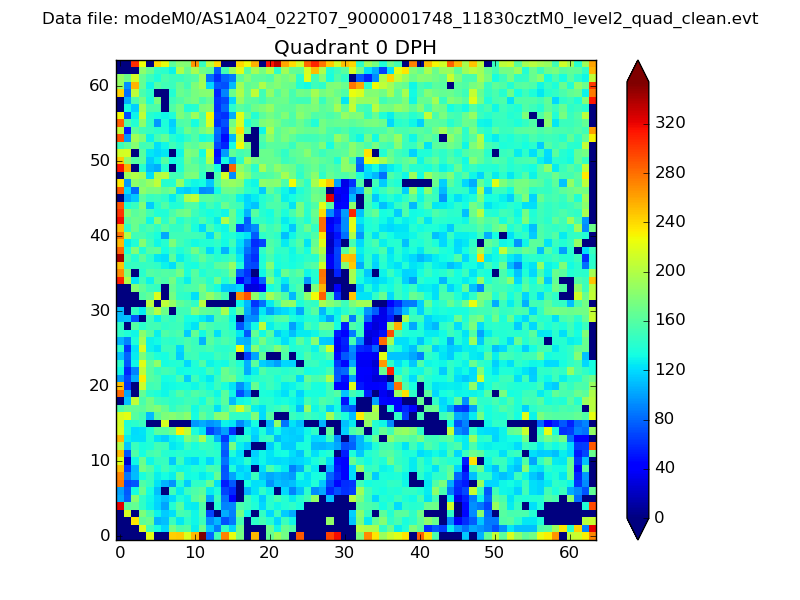 |
 |
Quadrant B |
|---|---|---|---|
| Quadrant D | 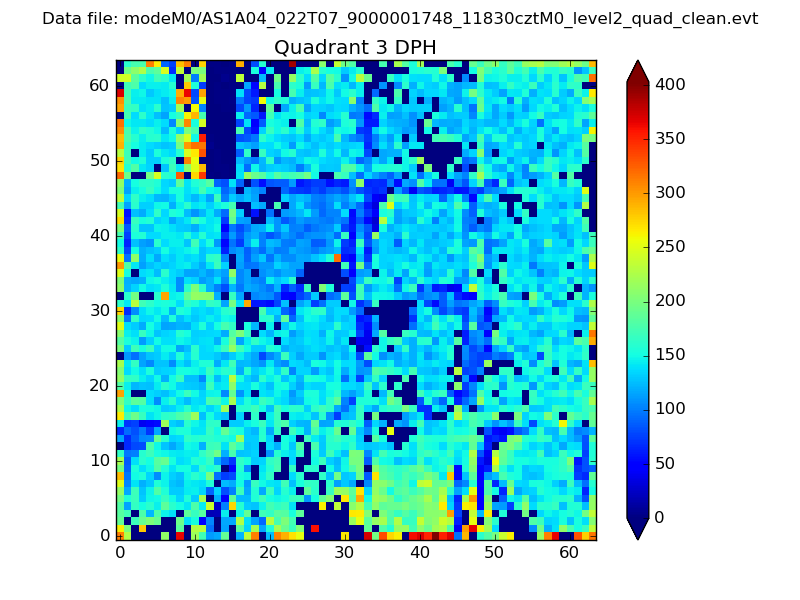 |
 |
Quadrant C |
| Plot type | Count rate plots | Images |
|---|---|---|
| Comparison with Poisson distribution Blue bars denote a histogram of data divided into 1 sec bins. Red curve is a Poisson curve with rate = median count rate of data. |
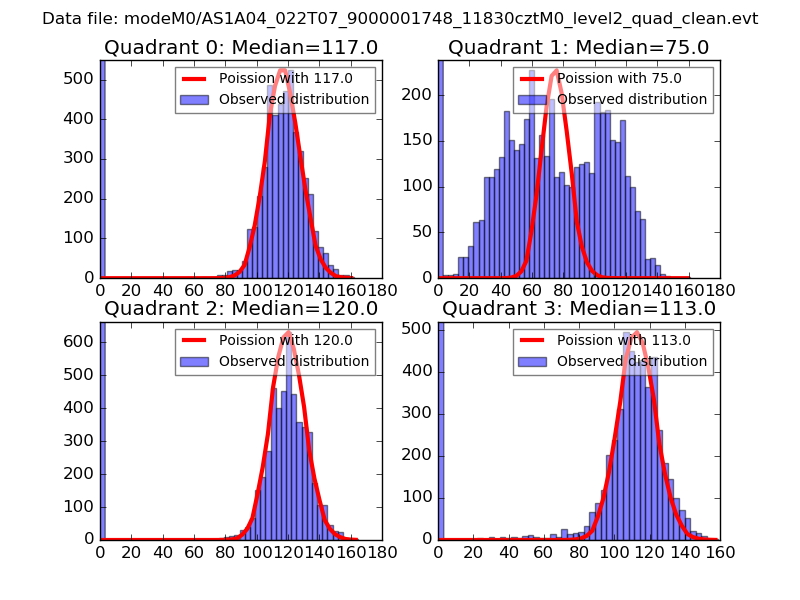 |
 |
| Quadrant-wise count rates Data is divided into 100 sec bins |
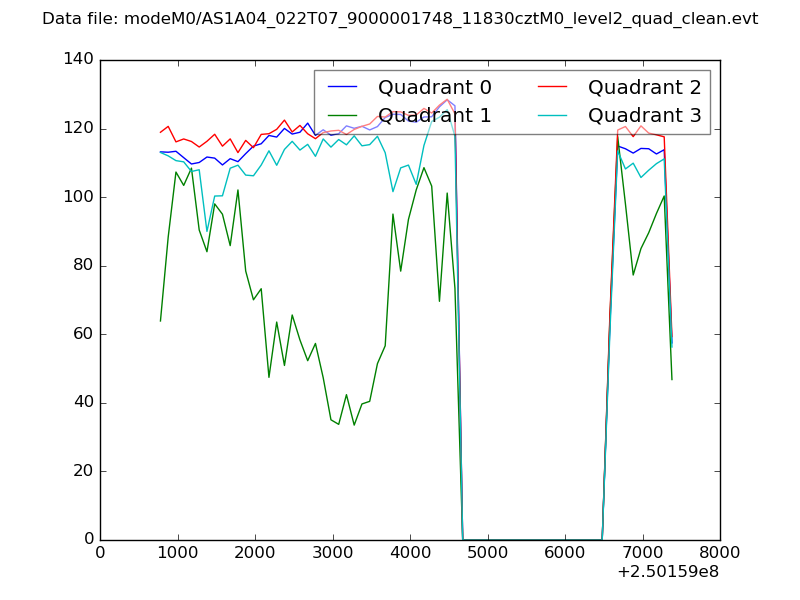 |
|
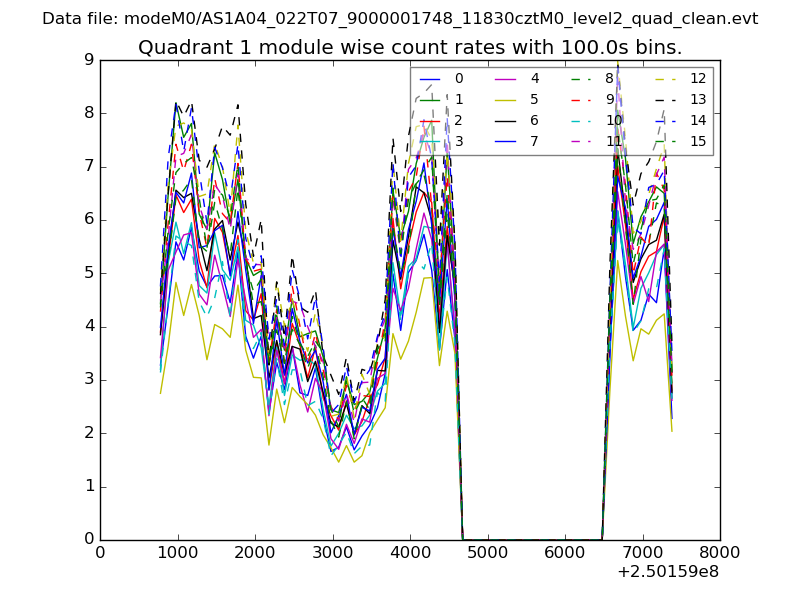
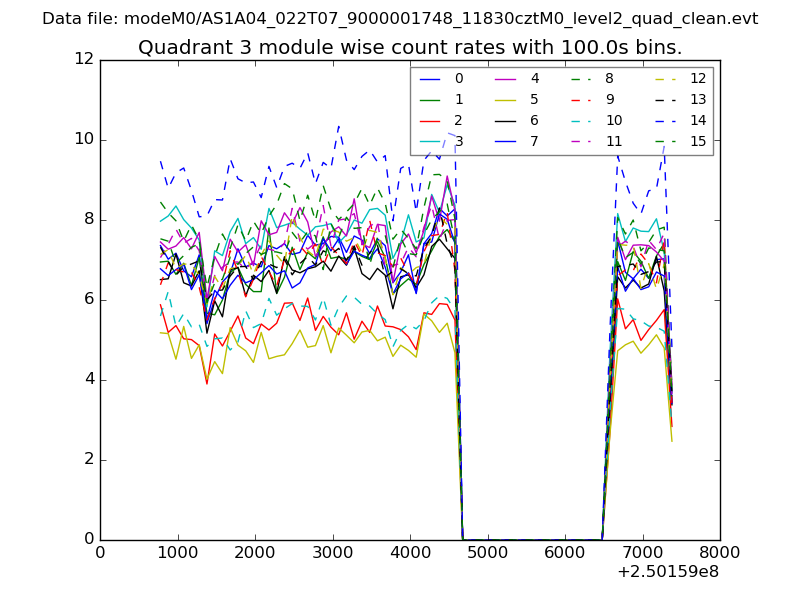
| Module-wise count rates for Quadrant A Data is divided into 100 sec bins |
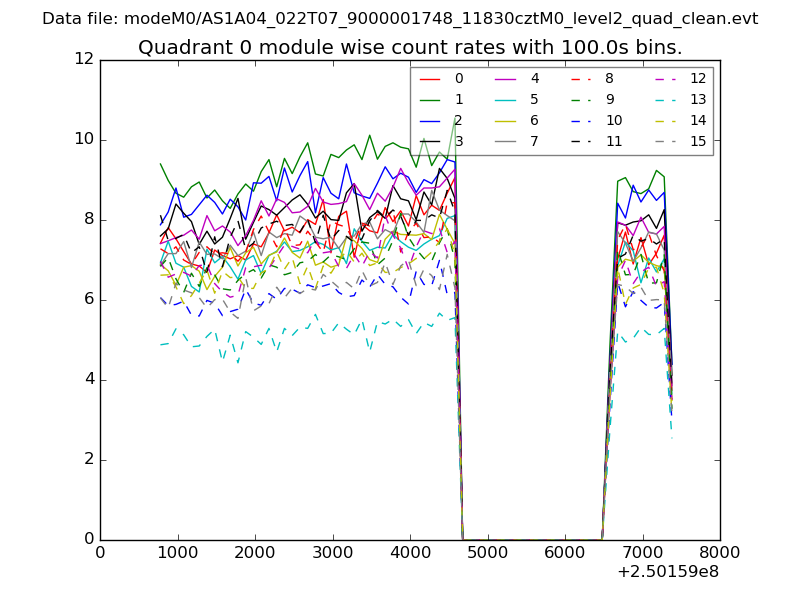 |
 |
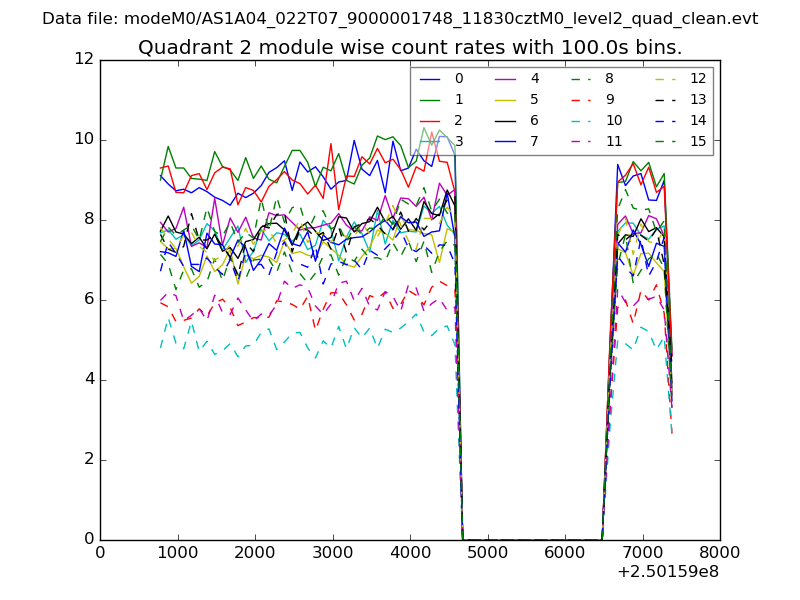
| Module-wise count rates for Quadrant B Data is divided into 100 sec bins |
 |
 |
| Module-wise count rates for Quadrant C Data is divided into 100 sec bins |
 |
 |
| Module-wise count rates for Quadrant D Data is divided into 100 sec bins |
 |
 |
| Parameter | Plot |
|---|---|
| CZT HV Monitor | 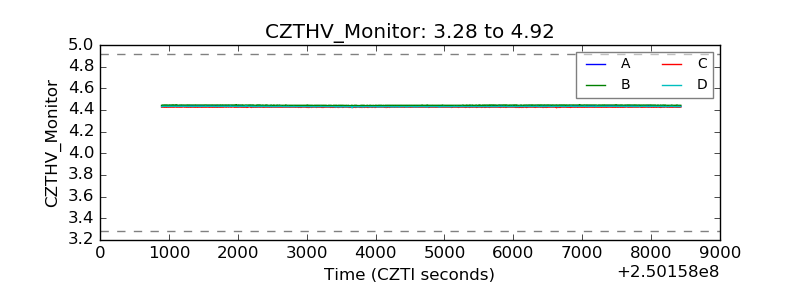 |
| D_VDD | 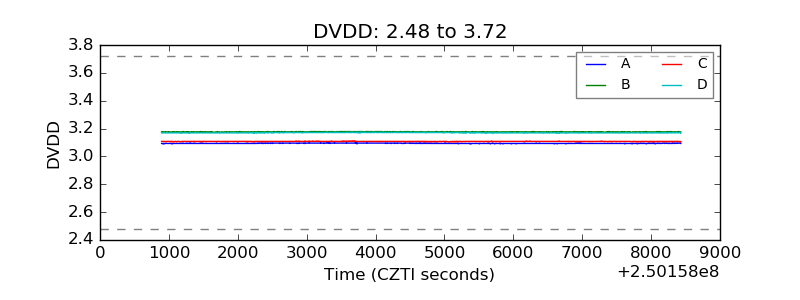 |
| Temperature 1 | 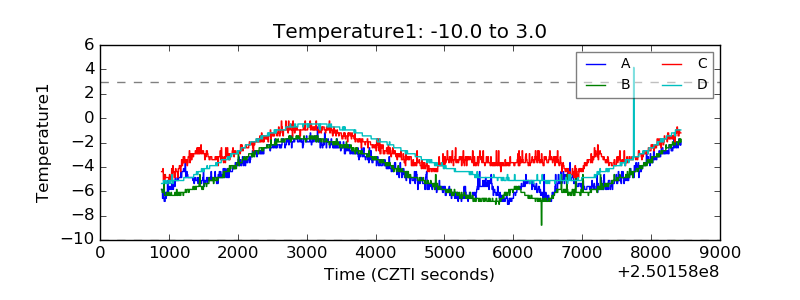 |
| Veto HV Monitor |  |
| Veto LLD | 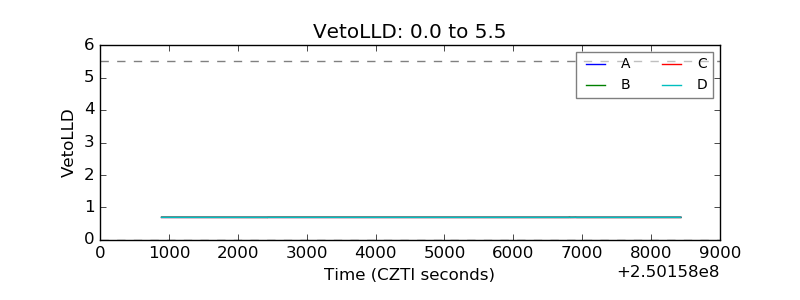 |
| Alpha Counter | 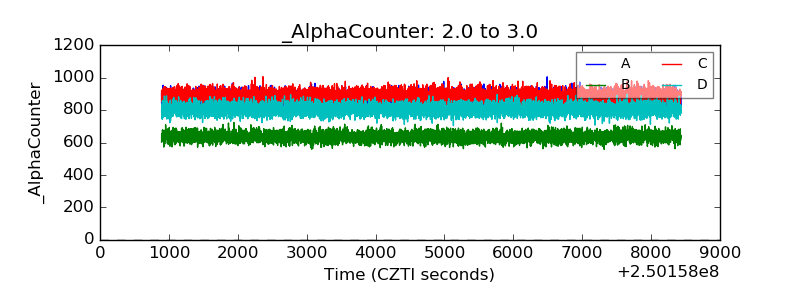 |
| _CPM_Rate | 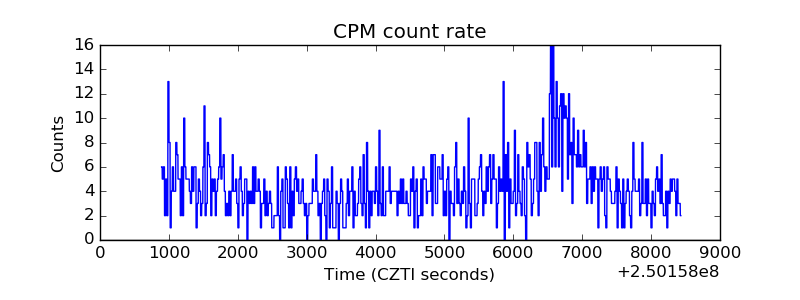 |
| CZT Counter | 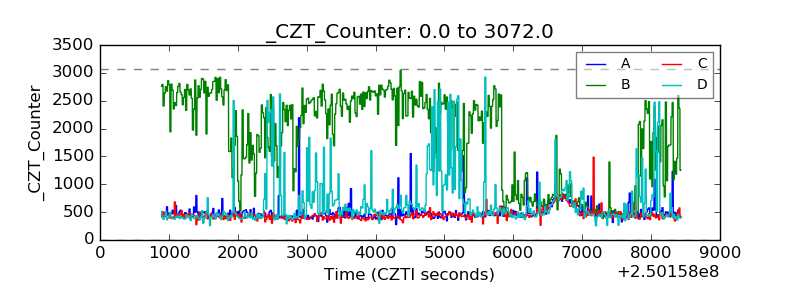 |
| +2.5 Volts monitor |  |
| +5 Volts monitor |  |
| _ROLL_ROT | 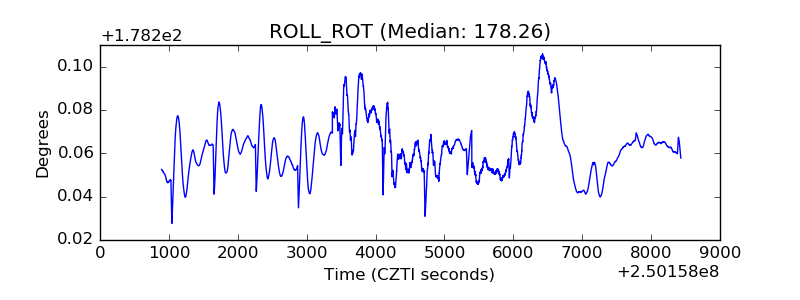 |
| _Roll_DEC |  |
| _Roll_RA | 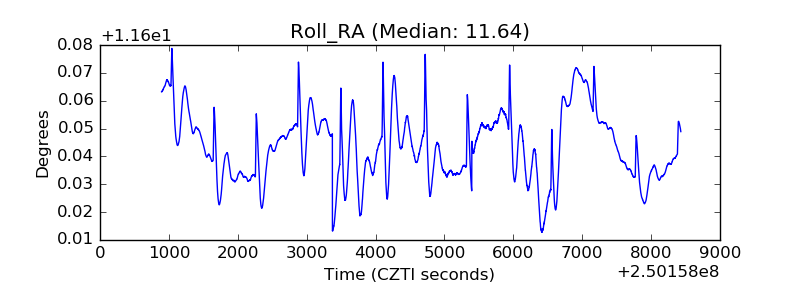 |
| Veto Counter | 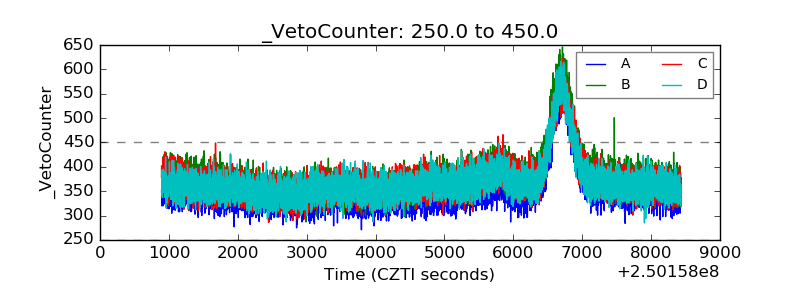 |