| Param | Original file | Final file |
|---|---|---|
| Filename | modeM0/AS1A04_022T07_9000001748_11831cztM0_level2.evt | modeM0/AS1A04_022T07_9000001748_11831cztM0_level2_quad_clean.evt |
| Size (bytes) | 989,331,840 | 84,755,520 |
| Size | 943.5 MB | 80.8 MB |
| Events in quadrant A | 3,734,374 | 609,254 |
| Events in quadrant B | 17,774,736 | 219,039 |
| Events in quadrant C | 3,425,516 | 622,770 |
| Events in quadrant D | 4,515,302 | 586,075 |
| Mode SS | |||
|---|---|---|---|
| Quadrant | BADHDUFLAG | Total packets | Discarded packets |
| A | 0 | 154 | 0 |
| B | 0 | 154 | 0 |
| C | 0 | 154 | 0 |
| D | 0 | 154 | 0 |
| Mode M9 | |||
|---|---|---|---|
| Quadrant | BADHDUFLAG | Total packets | Discarded packets |
| A | 0 | 2 | 0 |
| B | 0 | 2 | 0 |
| C | 0 | 2 | 0 |
| D | 0 | 2 | 0 |
| Mode M0 | |||
|---|---|---|---|
| Quadrant | BADHDUFLAG | Total packets | Discarded packets |
| A | 0 | 16045 | 2 |
| B | 0 | 57840 | 1 |
| C | 0 | 15557 | 1 |
| D | 0 | 18537 | 1 |
| Quadrant | Total seconds | Saturated seconds | Saturation percentage |
|---|---|---|---|
| A | 7573 | 205 | 2.706985% |
| B | 7573 | 6452 | 85.197412% |
| C | 7573 | 100 | 1.320481% |
| D | 7573 | 305 | 4.027466% |
Noise dominated data is calculated using 1-second bins in cleaned event files. If a bin has >2000 counts, and if more than 50% of those come from <1% of pixels, then it is considered to be noise-dominated and hence unusable.
| Quadrant | # 1 sec bins | Bins with >0 counts | Bins with >2000 counts | High rate bins dominated by noise | Noise dominated (total time) | Noise dominated (detector-on time) | Marked lightcurve |
|---|---|---|---|---|---|---|---|
| A | 7769 | 7575 | 6 | 6 | 0.08% | 0.08% | 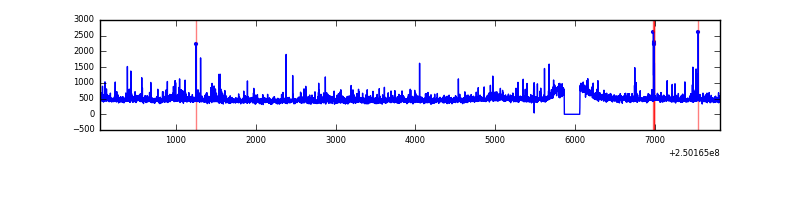 |
| B | 7769 | 7575 | 6214 | 6214 | 79.98% | 82.03% | 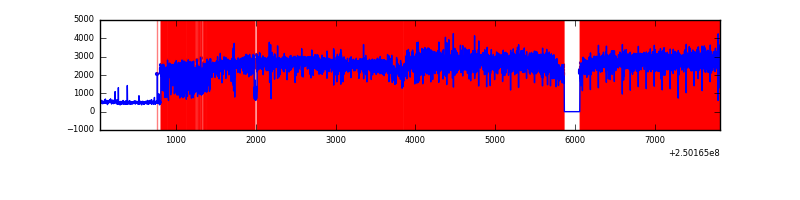 |
| C | 7769 | 7575 | 6 | 6 | 0.08% | 0.08% | 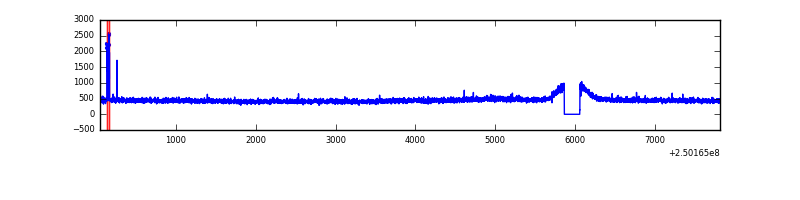 |
| D | 7769 | 7575 | 168 | 168 | 2.16% | 2.22% | 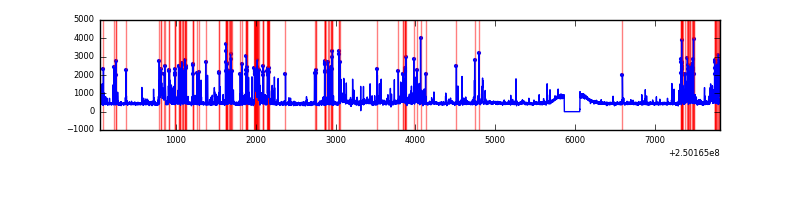 |
Top three noisy pixels from each quadrant. If the there are fewer than three noisy pixels in the level2.evt file, extra rows are filled as -1
| Pixel properties | Quadrant properties | ||||||
|---|---|---|---|---|---|---|---|
| Quadrant | DetID | PixID | Counts | Sigma | Mean | Median | Sigma |
| A | 1 | 162 | 125151 | 680.62 | 889 | 868 | 182.6 |
| A | 1 | 178 | 59462 | 320.88 | 889 | 868 | 182.6 |
| A | 1 | 161 | 52688 | 283.78 | 889 | 868 | 182.6 |
| B | 10 | 16 | 15373294 | 207960.81 | 384 | 375 | 73.9 |
| B | 4 | 239 | 423893 | 5729.24 | 384 | 375 | 73.9 |
| B | 15 | 204 | 239711 | 3237.67 | 384 | 375 | 73.9 |
| C | 7 | 238 | 30889 | 147.11 | 868 | 871 | 204.0 |
| C | 13 | 61 | 6261 | 26.42 | 868 | 871 | 204.0 |
| C | 8 | 128 | 4628 | 18.41 | 868 | 871 | 204.0 |
| D | 12 | 233 | 510319 | 2416.93 | 862 | 835 | 210.8 |
| D | 1 | 52 | 387768 | 1835.56 | 862 | 835 | 210.8 |
| D | 9 | 85 | 107656 | 506.75 | 862 | 835 | 210.8 |
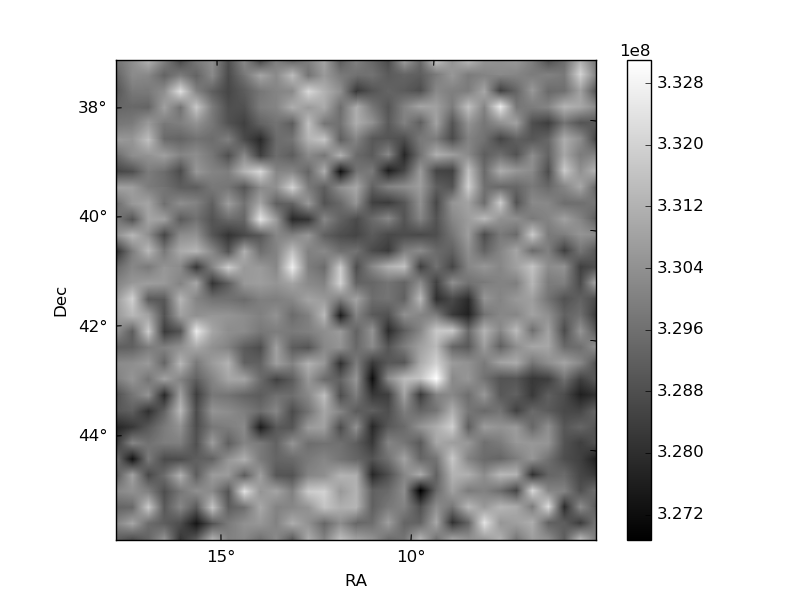
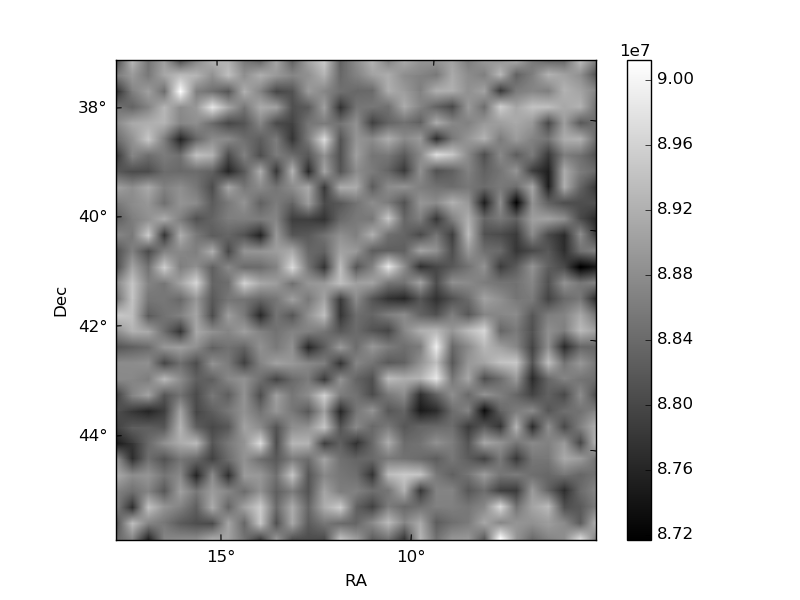
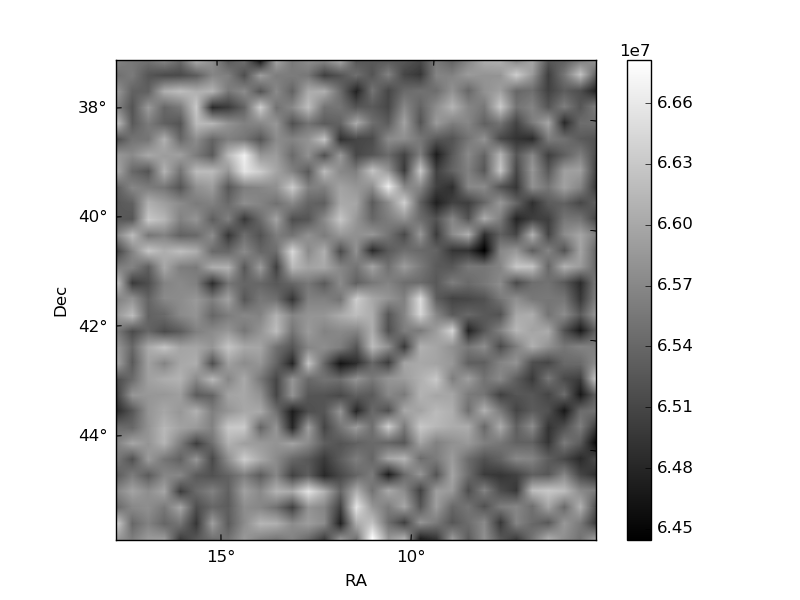
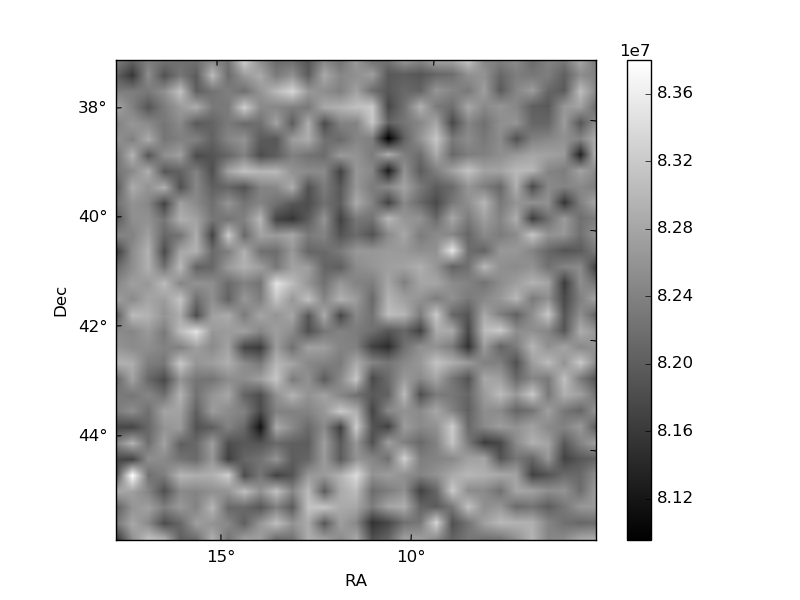
Histogram calculated using DETX and DETY for each event in the final _common_clean file
| Quadrant A | 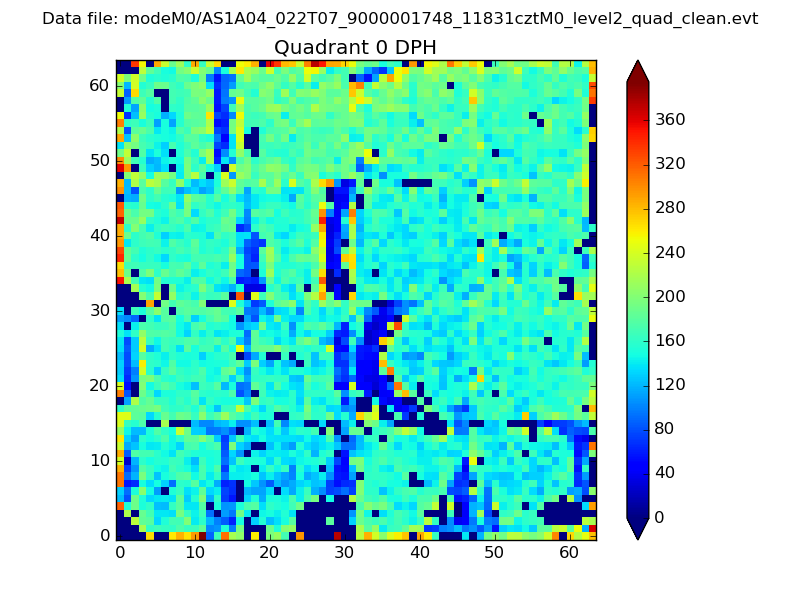 |
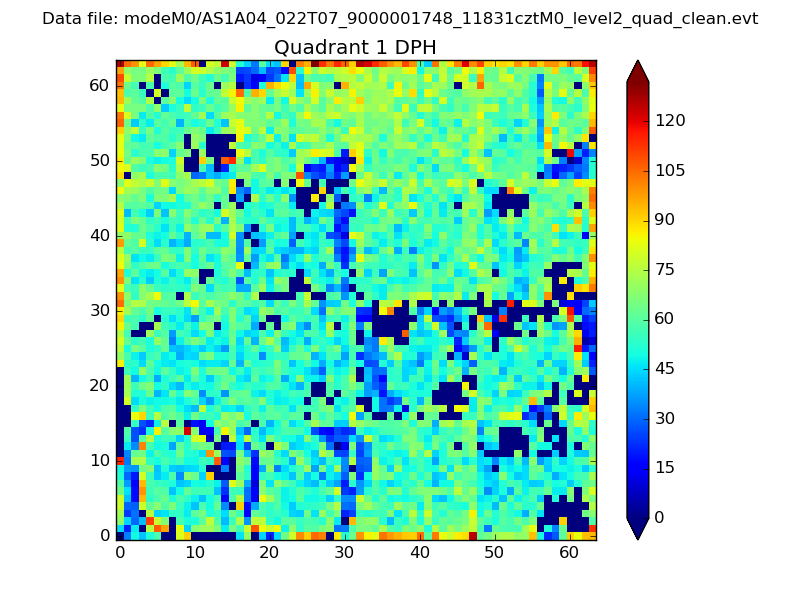 |
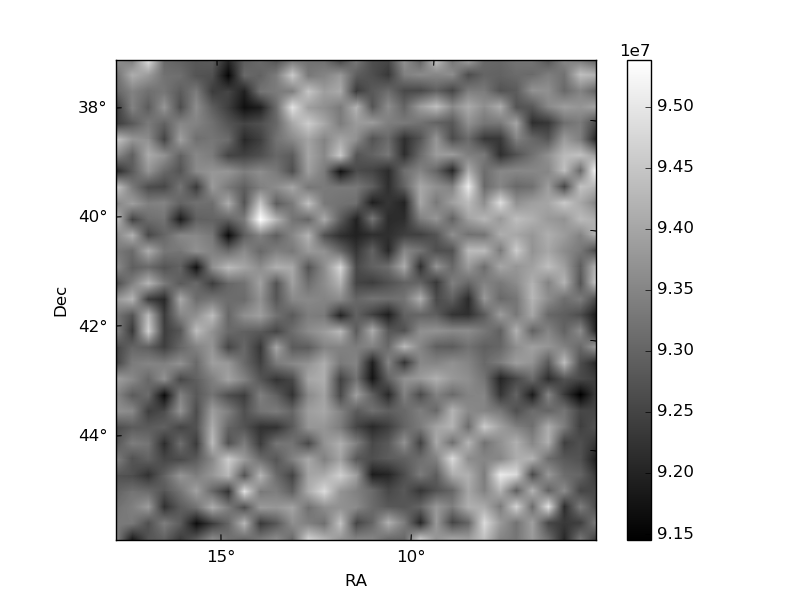
Quadrant B |
|---|---|---|---|
| Quadrant D | 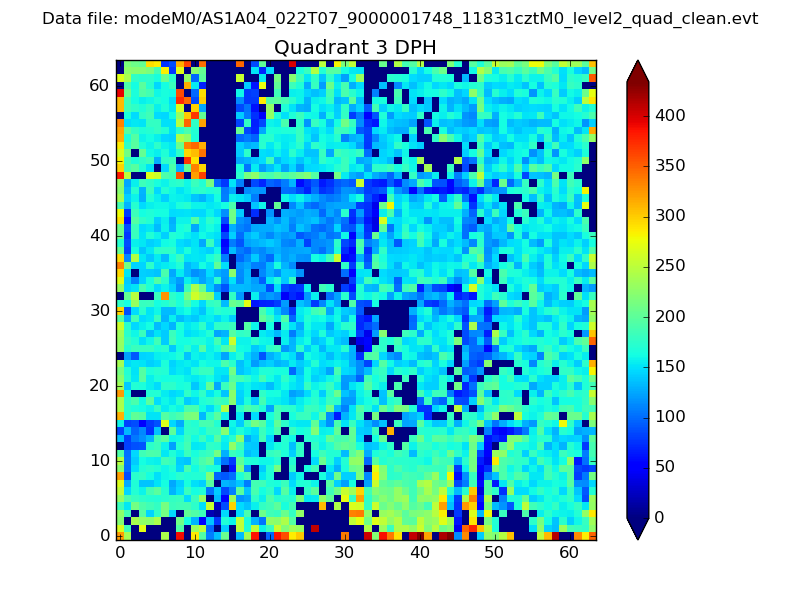 |
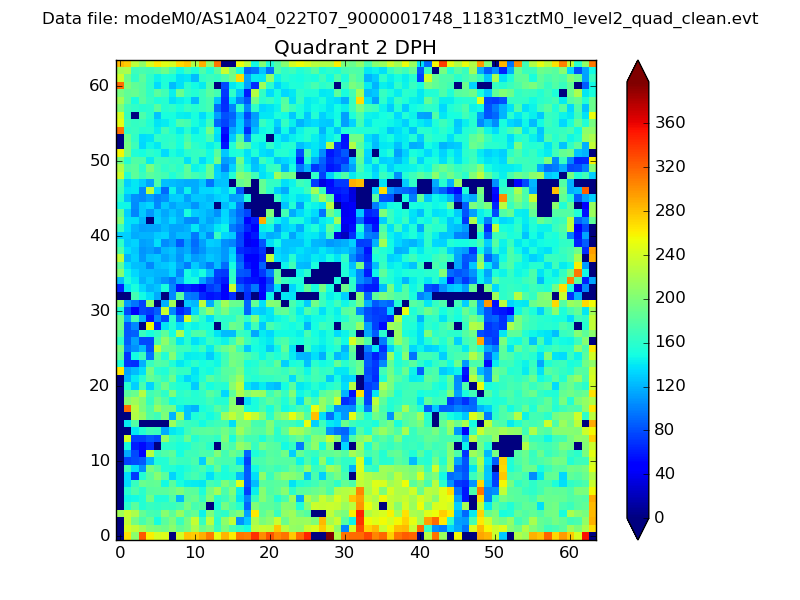 |
Quadrant C |
| Plot type | Count rate plots | Images |
|---|---|---|
| Comparison with Poisson distribution Blue bars denote a histogram of data divided into 1 sec bins. Red curve is a Poisson curve with rate = median count rate of data. |
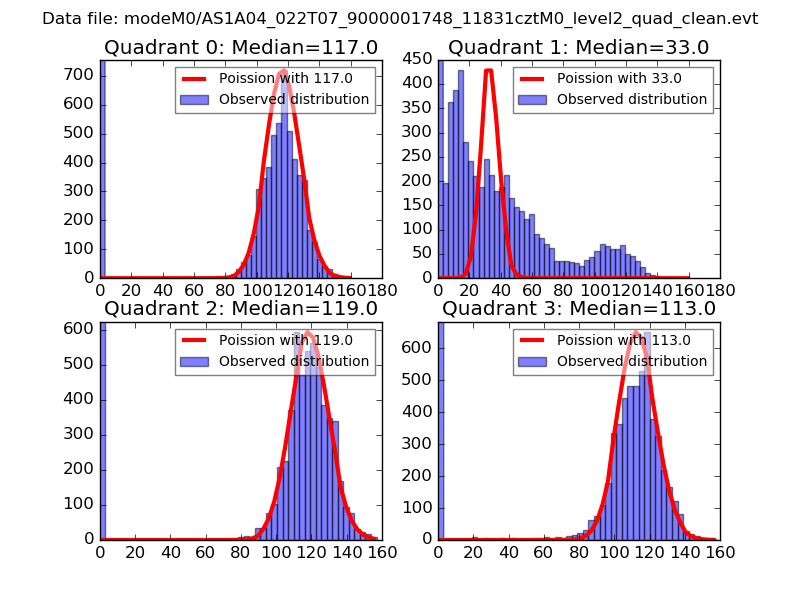 |
 |
| Quadrant-wise count rates Data is divided into 100 sec bins |
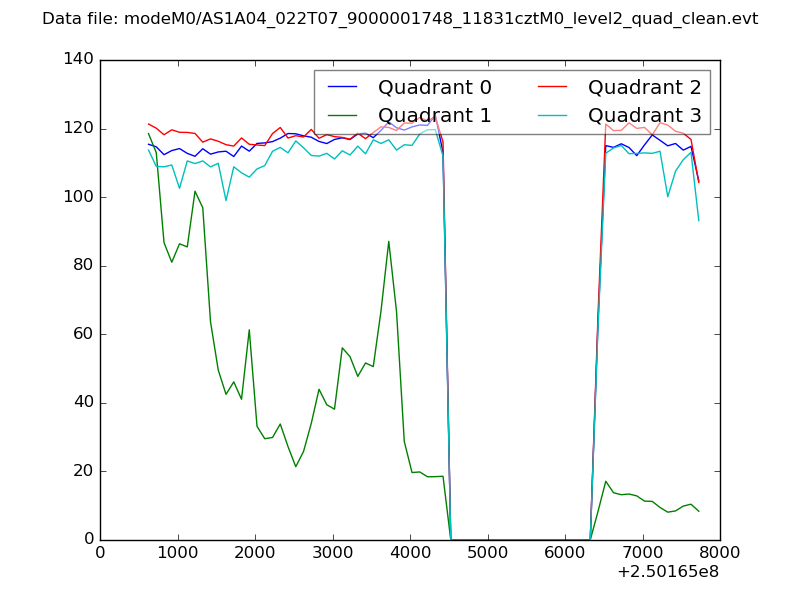 |
|
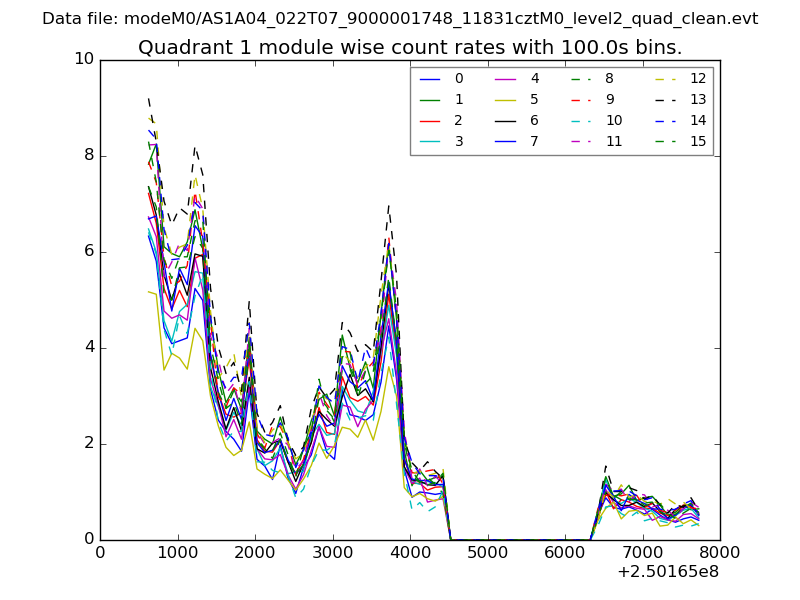
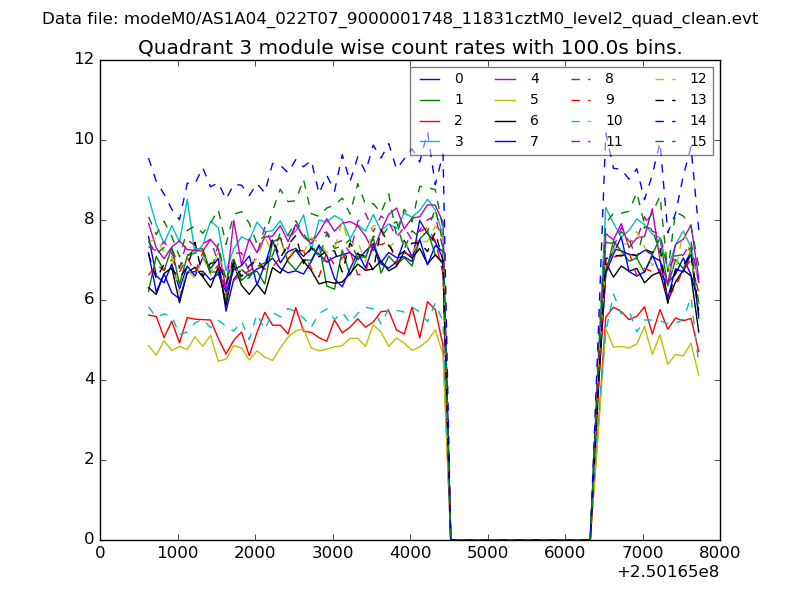
| Module-wise count rates for Quadrant A Data is divided into 100 sec bins |
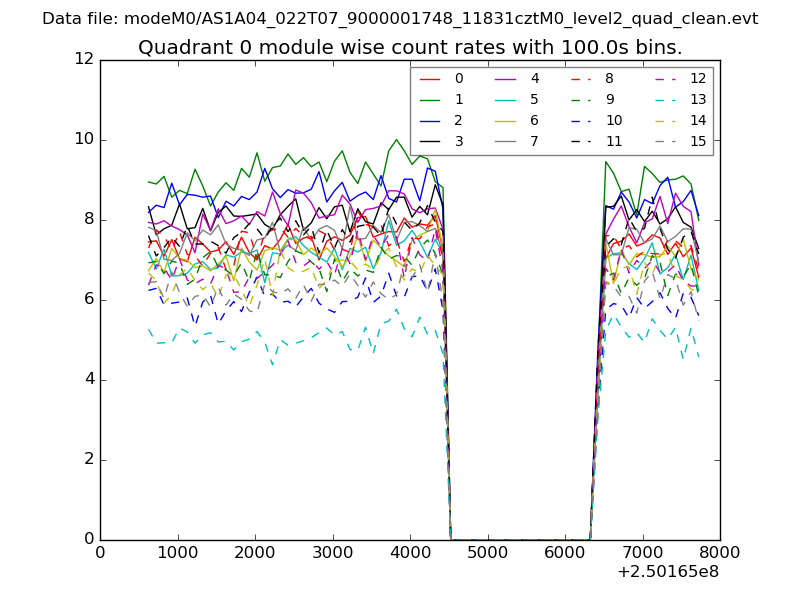 |
 |
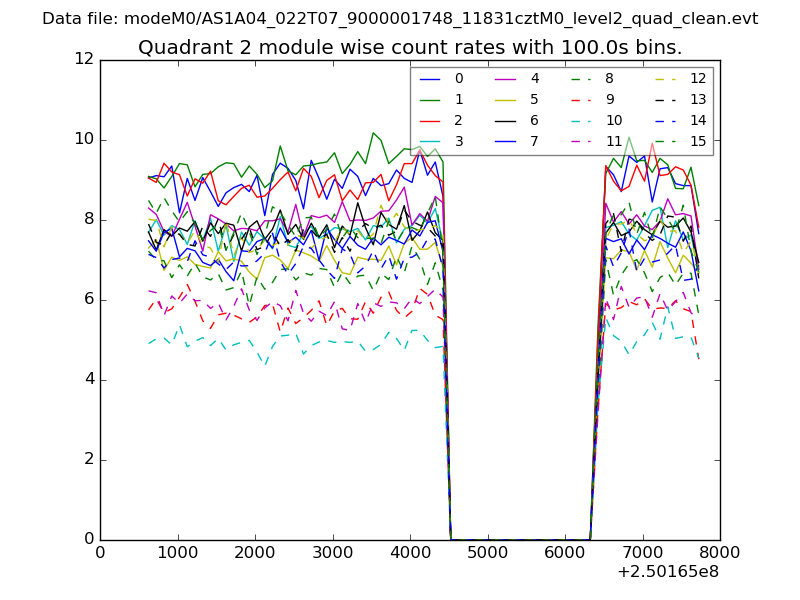
| Module-wise count rates for Quadrant B Data is divided into 100 sec bins |
 |
 |
| Module-wise count rates for Quadrant C Data is divided into 100 sec bins |
 |
 |
| Module-wise count rates for Quadrant D Data is divided into 100 sec bins |
 |
 |
| Parameter | Plot |
|---|---|
| CZT HV Monitor | 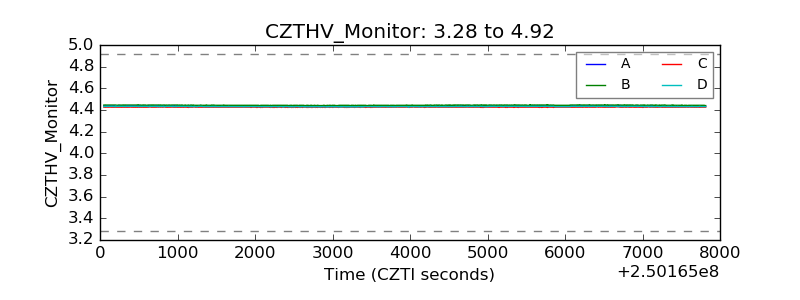 |
| D_VDD | 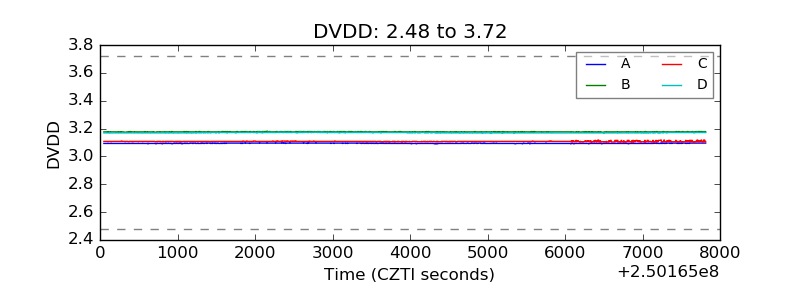 |
| Temperature 1 | 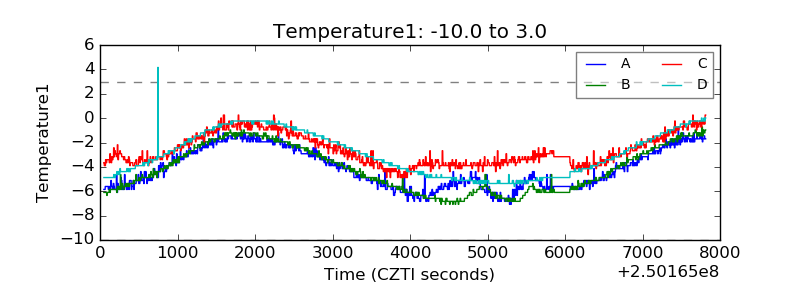 |
| Veto HV Monitor | 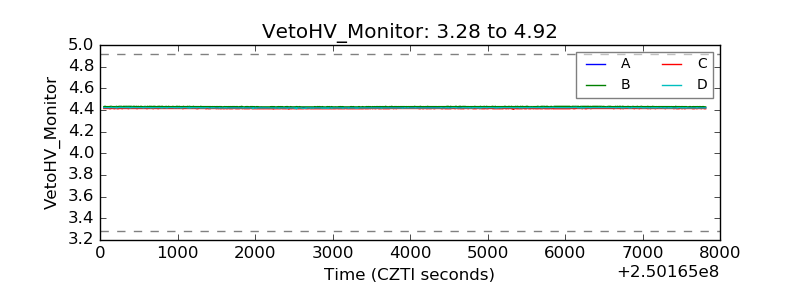 |
| Veto LLD | 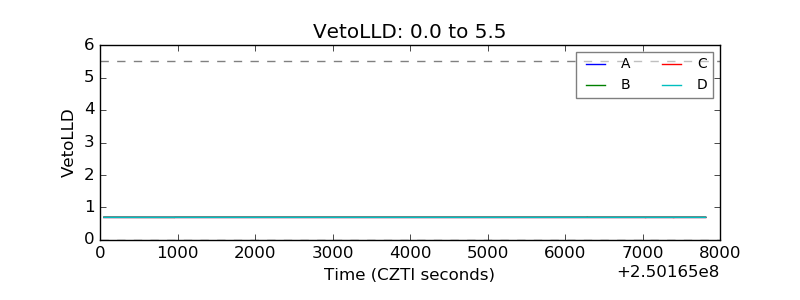 |
| Alpha Counter | 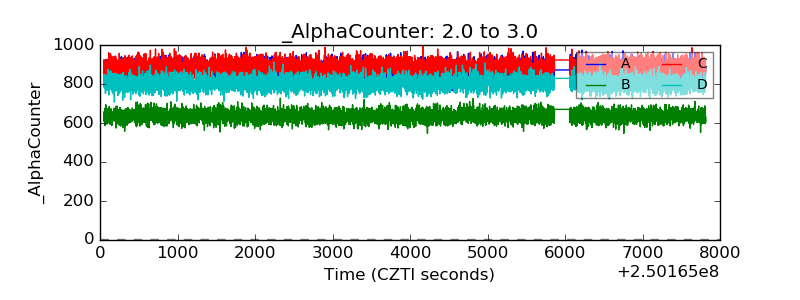 |
| _CPM_Rate | 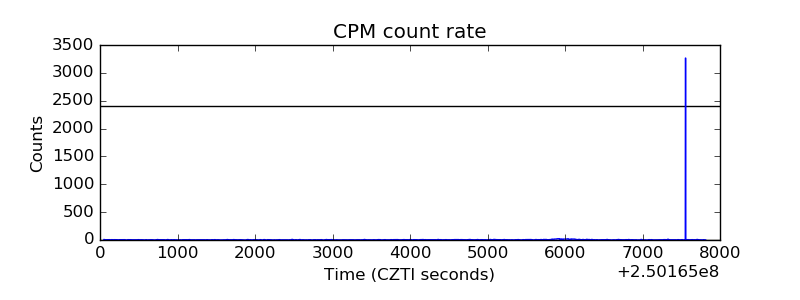 |
| CZT Counter | 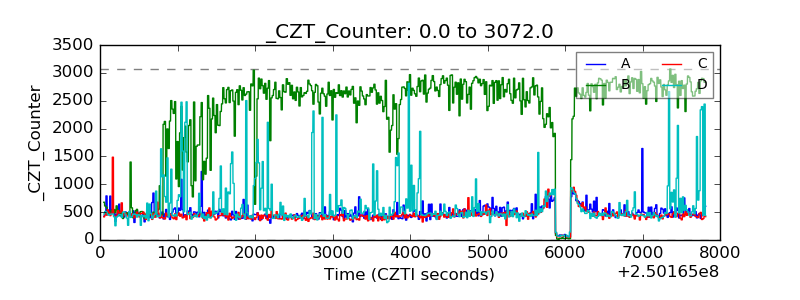 |
| +2.5 Volts monitor | 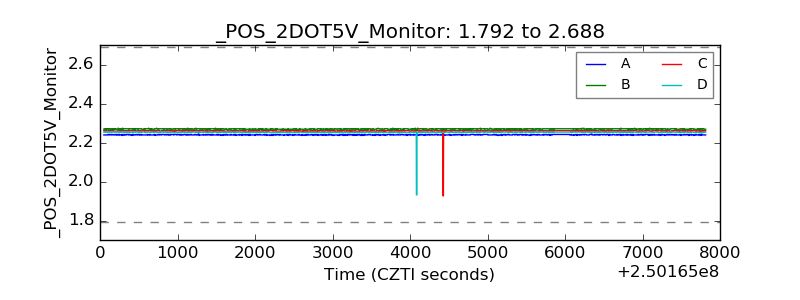 |
| +5 Volts monitor |  |
| _ROLL_ROT | 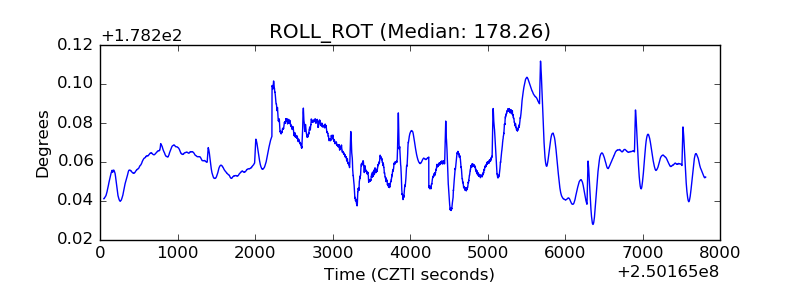 |
| _Roll_DEC | 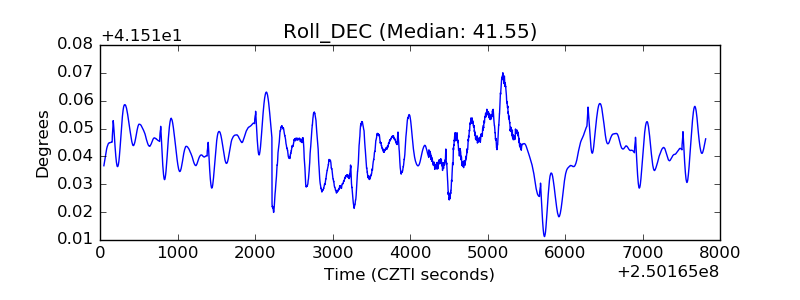 |
| _Roll_RA | 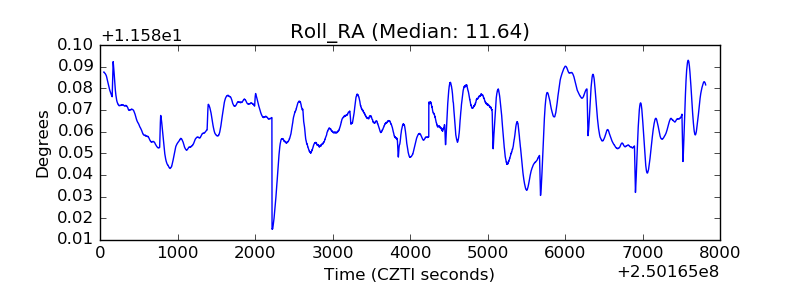 |
| Veto Counter | 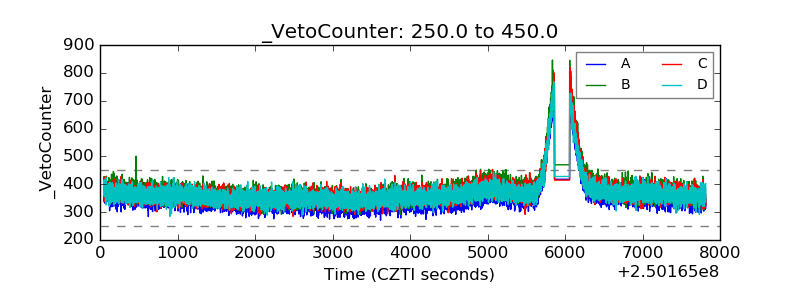 |