| Param | Original file | Final file |
|---|---|---|
| Filename | modeM0/AS1A04_022T07_9000001748_11833cztM0_level2.evt | modeM0/AS1A04_022T07_9000001748_11833cztM0_level2_quad_clean.evt |
| Size (bytes) | 1,389,631,680 | 117,679,680 |
| Size | 1.3 GB | 112.2 MB |
| Events in quadrant A | 5,214,528 | 838,612 |
| Events in quadrant B | 24,676,840 | 330,422 |
| Events in quadrant C | 4,734,789 | 849,366 |
| Events in quadrant D | 6,738,988 | 803,284 |
| Mode SS | |||
|---|---|---|---|
| Quadrant | BADHDUFLAG | Total packets | Discarded packets |
| A | 0 | 218 | 0 |
| B | 0 | 218 | 0 |
| C | 0 | 218 | 0 |
| D | 0 | 218 | 0 |
| Mode M9 | |||
|---|---|---|---|
| Quadrant | BADHDUFLAG | Total packets | Discarded packets |
| A | 0 | 12 | 0 |
| B | 0 | 12 | 0 |
| C | 0 | 12 | 0 |
| D | 0 | 12 | 0 |
| Mode M0 | |||
|---|---|---|---|
| Quadrant | BADHDUFLAG | Total packets | Discarded packets |
| A | 0 | 22701 | 3 |
| B | 0 | 80472 | 2 |
| C | 0 | 21752 | 2 |
| D | 0 | 27115 | 2 |
| Quadrant | Total seconds | Saturated seconds | Saturation percentage |
|---|---|---|---|
| A | 10673 | 167 | 1.564696% |
| B | 10673 | 8880 | 83.200600% |
| C | 10673 | 74 | 0.693338% |
| D | 10673 | 311 | 2.913895% |
Noise dominated data is calculated using 1-second bins in cleaned event files. If a bin has >2000 counts, and if more than 50% of those come from <1% of pixels, then it is considered to be noise-dominated and hence unusable.
| Quadrant | # 1 sec bins | Bins with >0 counts | Bins with >2000 counts | High rate bins dominated by noise | Noise dominated (total time) | Noise dominated (detector-on time) | Marked lightcurve |
|---|---|---|---|---|---|---|---|
| A | 11823 | 10675 | 2 | 2 | 0.02% | 0.02% | 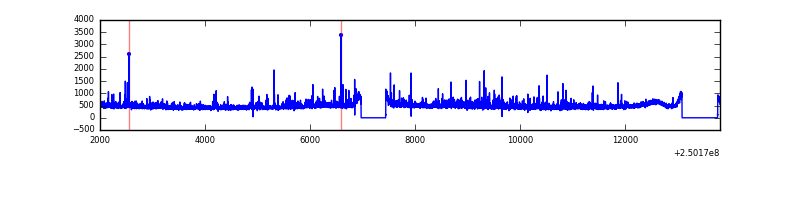 |
| B | 11824 | 10676 | 8161 | 8161 | 69.02% | 76.44% | 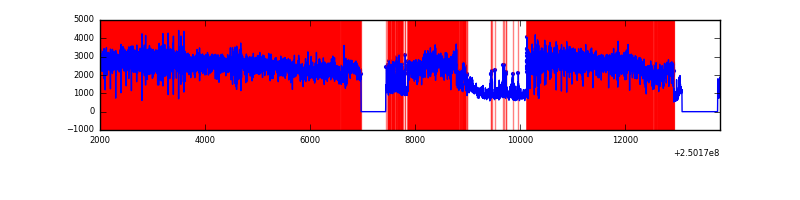 |
| C | 11823 | 10675 | 0 | 0 | 0.00% | 0.00% | 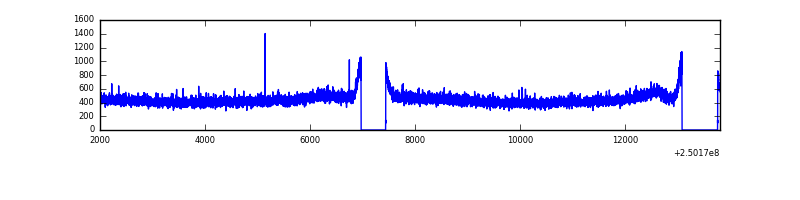 |
| D | 11823 | 10675 | 199 | 199 | 1.68% | 1.86% | 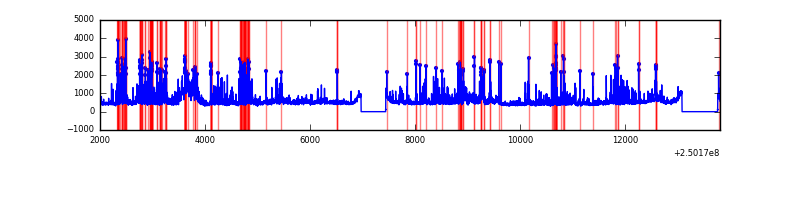 |
Top three noisy pixels from each quadrant. If the there are fewer than three noisy pixels in the level2.evt file, extra rows are filled as -1
| Pixel properties | Quadrant properties | ||||||
|---|---|---|---|---|---|---|---|
| Quadrant | DetID | PixID | Counts | Sigma | Mean | Median | Sigma |
| A | 1 | 162 | 168509 | 663.78 | 1238 | 1210 | 252.0 |
| A | 1 | 178 | 87901 | 343.96 | 1238 | 1210 | 252.0 |
| A | 1 | 161 | 77082 | 301.03 | 1238 | 1210 | 252.0 |
| B | 10 | 16 | 20755409 | 175236.67 | 623 | 608 | 118.4 |
| B | 15 | 204 | 632168 | 5332.38 | 623 | 608 | 118.4 |
| B | 4 | 239 | 593735 | 5007.88 | 623 | 608 | 118.4 |
| C | 13 | 61 | 8833 | 27.0 | 1209 | 1215 | 282.1 |
| C | 8 | 128 | 8085 | 24.35 | 1209 | 1215 | 282.1 |
| C | 8 | 112 | 5515 | 15.24 | 1209 | 1215 | 282.1 |
| D | 12 | 233 | 527047 | 1804.77 | 1206 | 1172 | 291.4 |
| D | 1 | 52 | 484283 | 1658.01 | 1206 | 1172 | 291.4 |
| D | 12 | 17 | 335262 | 1146.58 | 1206 | 1172 | 291.4 |
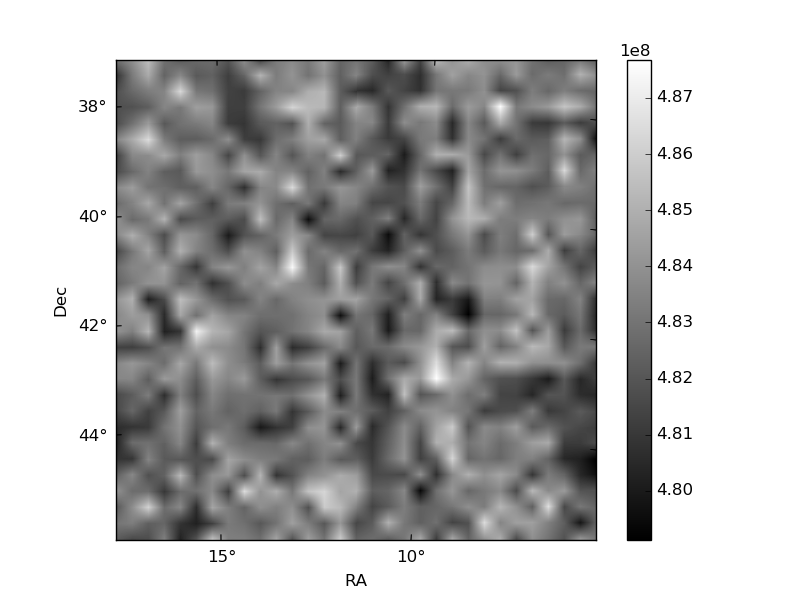
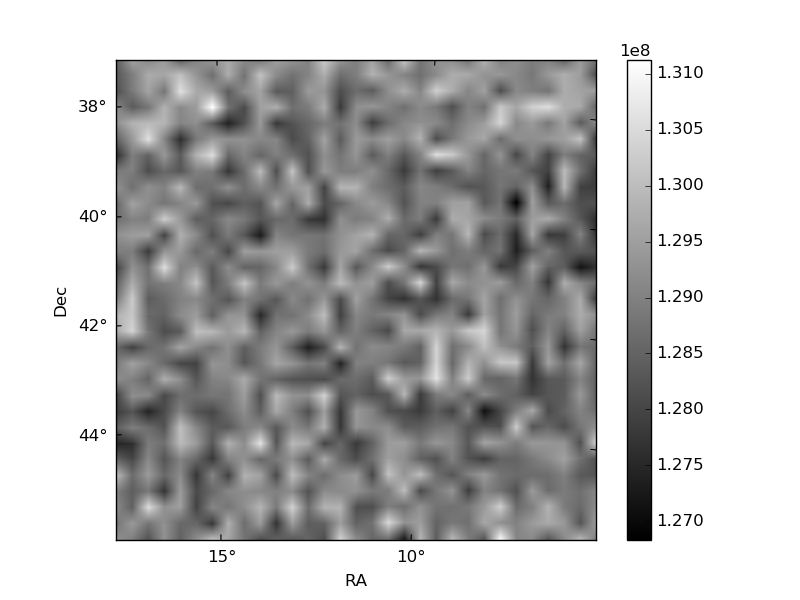
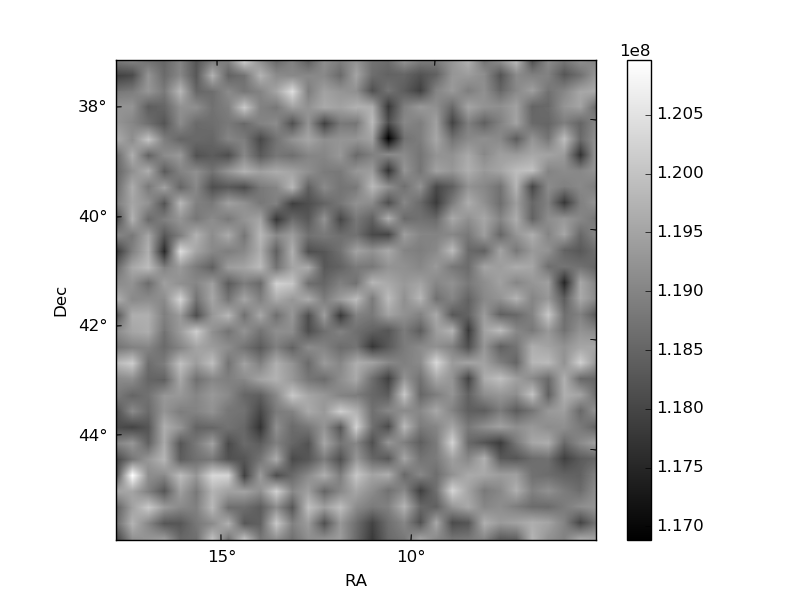
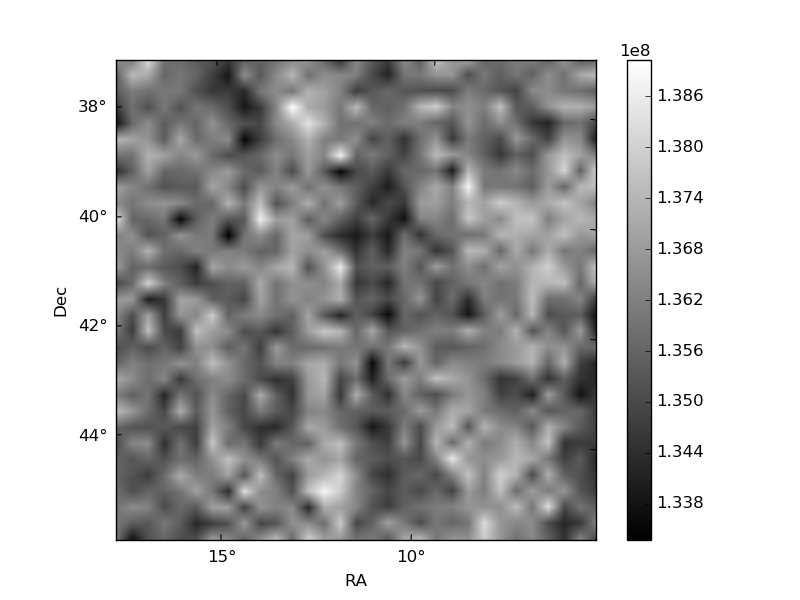
Histogram calculated using DETX and DETY for each event in the final _common_clean file
| Quadrant A | 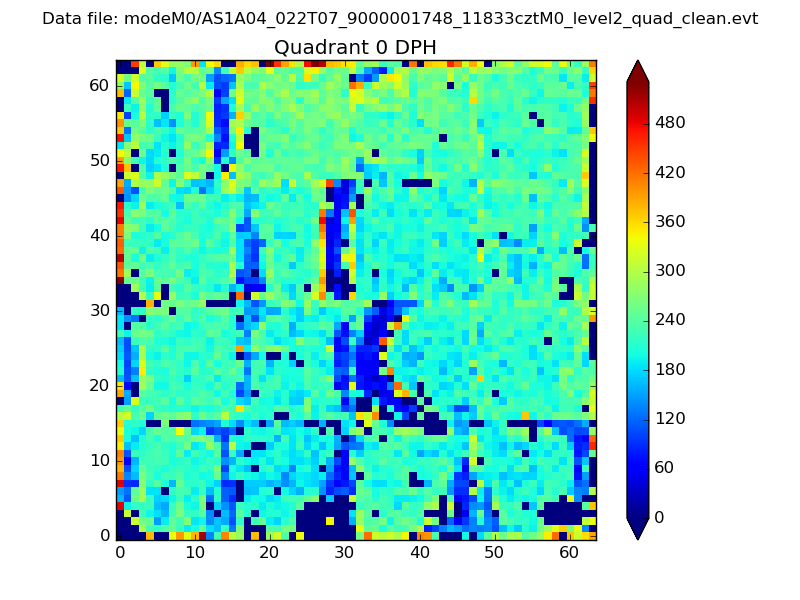 |
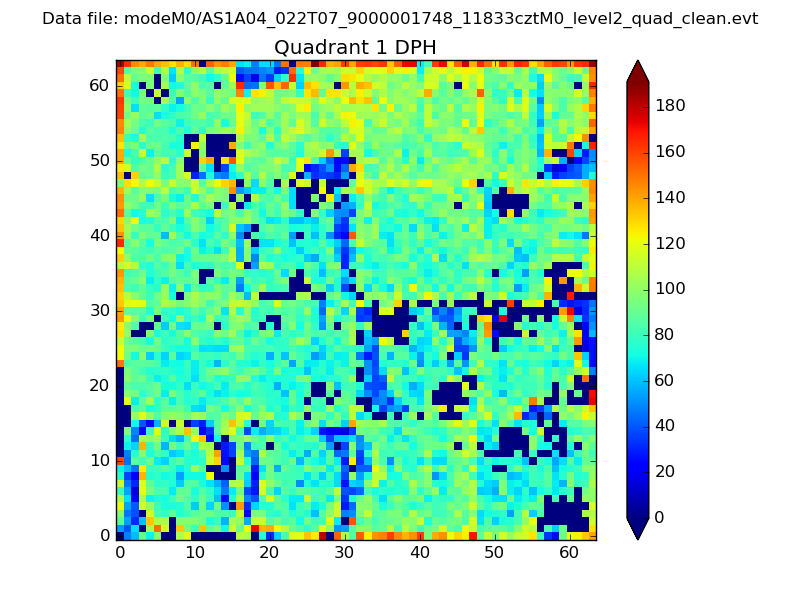 |
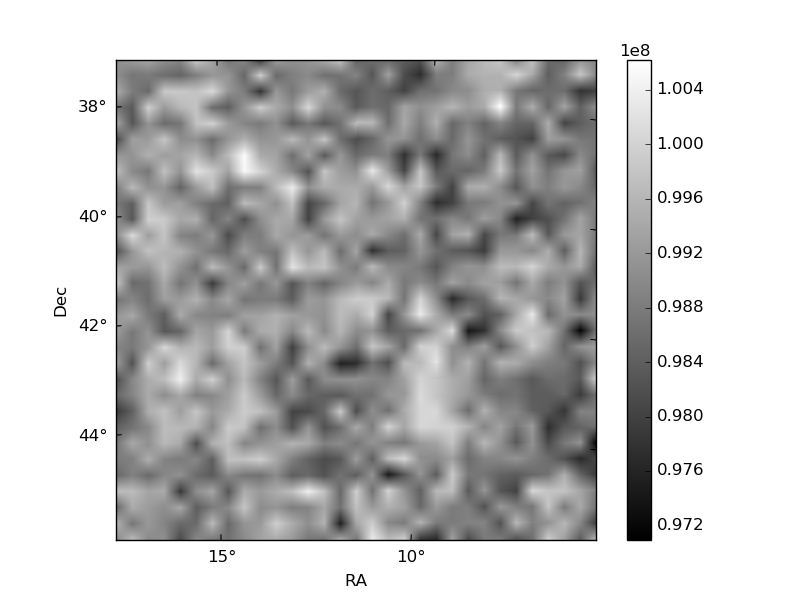
Quadrant B |
|---|---|---|---|
| Quadrant D | 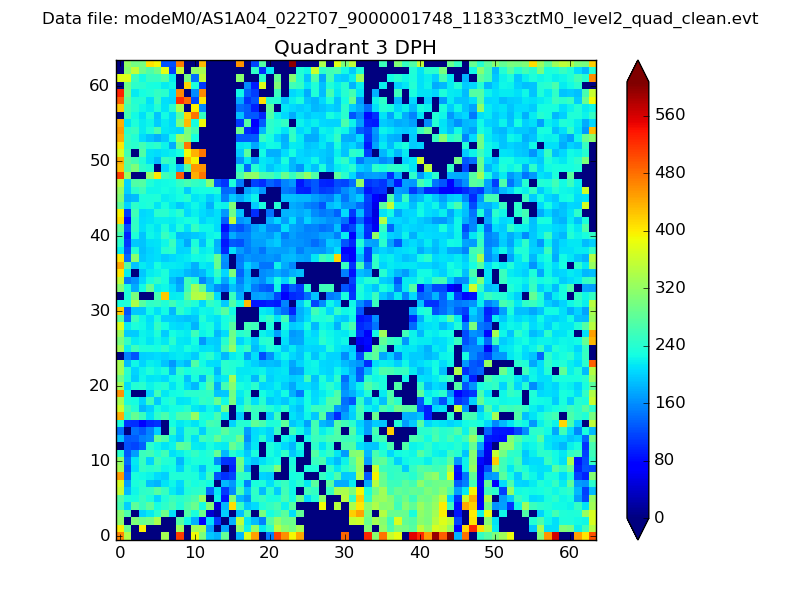 |
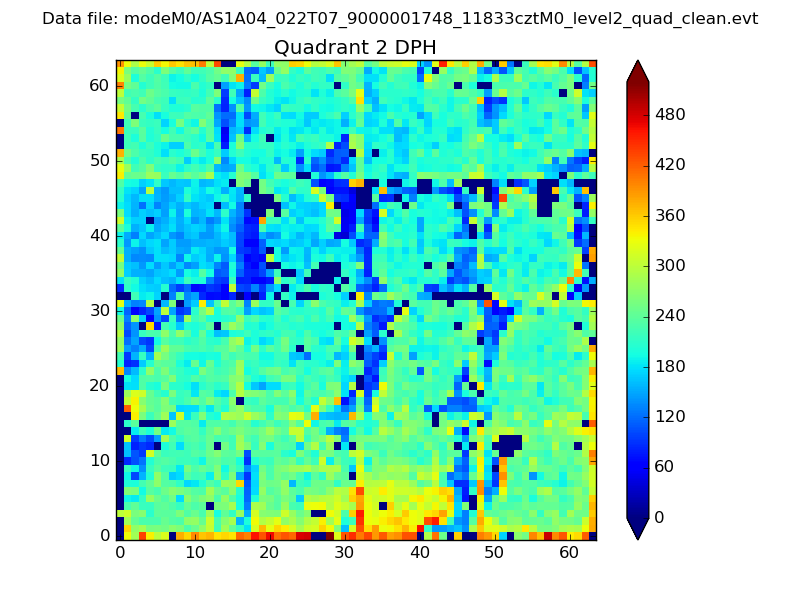 |
Quadrant C |
| Plot type | Count rate plots | Images |
|---|---|---|
| Comparison with Poisson distribution Blue bars denote a histogram of data divided into 1 sec bins. Red curve is a Poisson curve with rate = median count rate of data. |
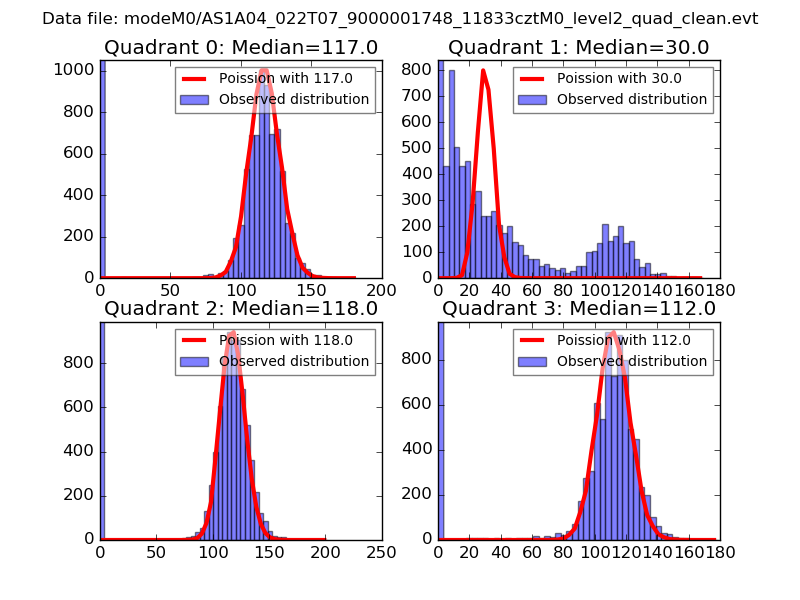 |
 |
| Quadrant-wise count rates Data is divided into 100 sec bins |
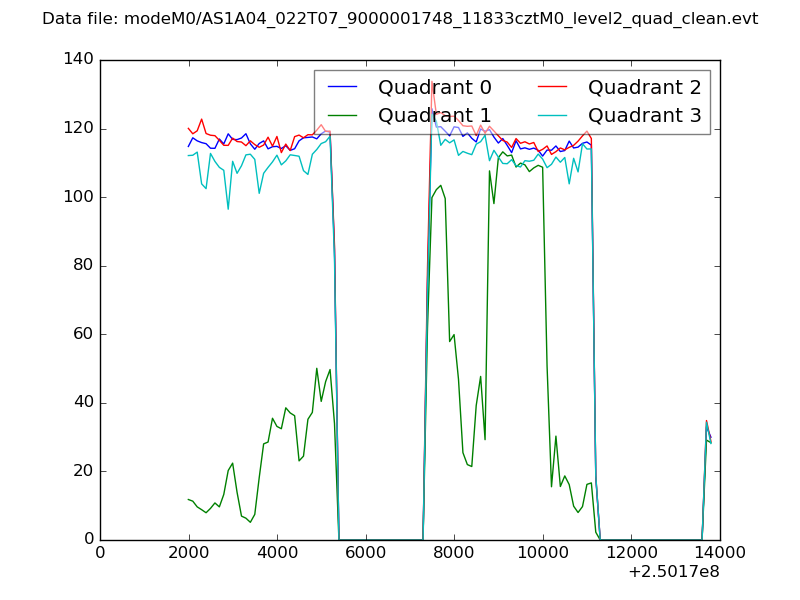 |
|
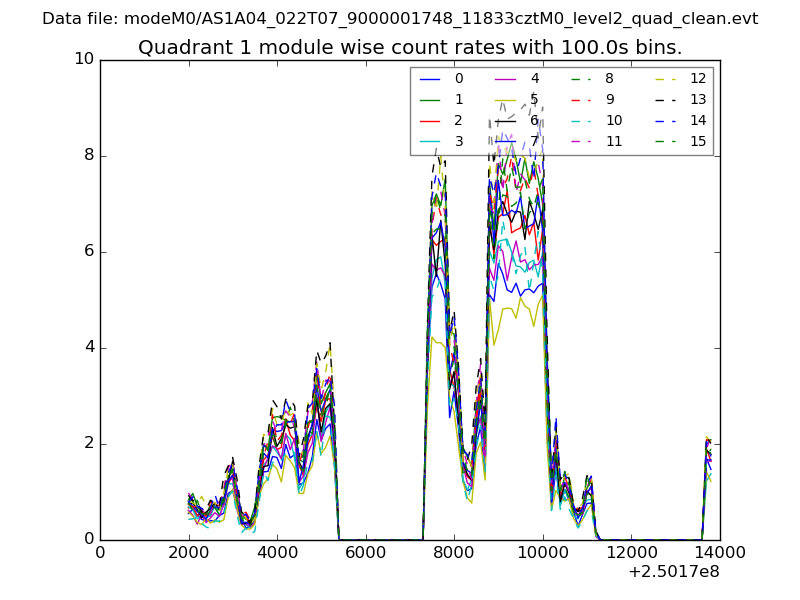
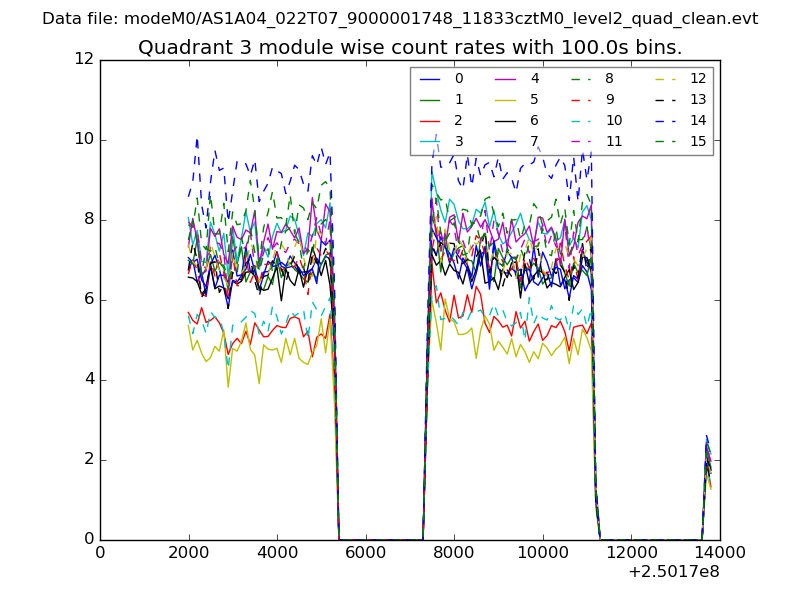
| Module-wise count rates for Quadrant A Data is divided into 100 sec bins |
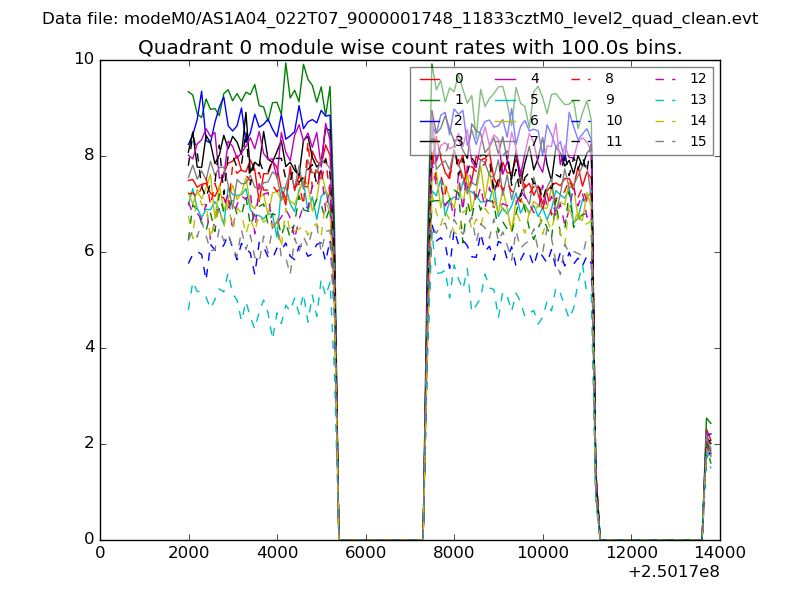 |
 |
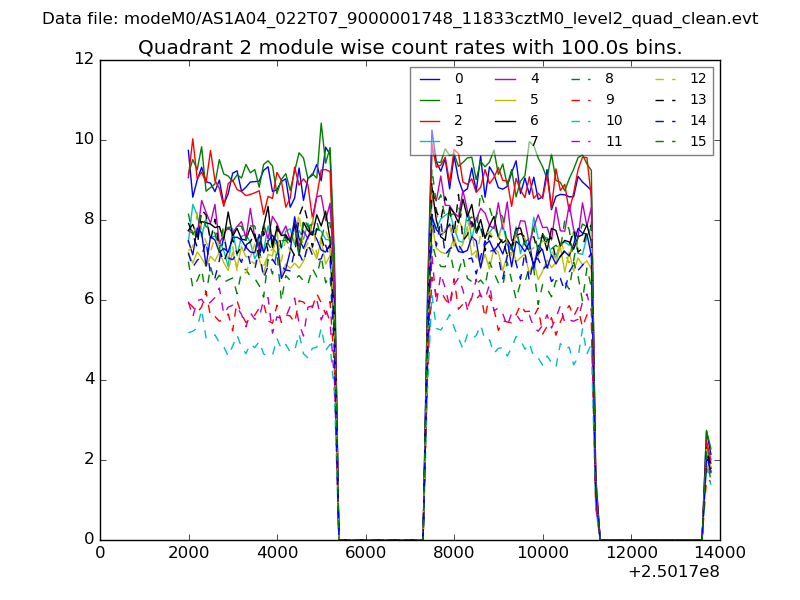
| Module-wise count rates for Quadrant B Data is divided into 100 sec bins |
 |
 |
| Module-wise count rates for Quadrant C Data is divided into 100 sec bins |
 |
 |
| Module-wise count rates for Quadrant D Data is divided into 100 sec bins |
 |
 |
| Parameter | Plot |
|---|---|
| CZT HV Monitor | 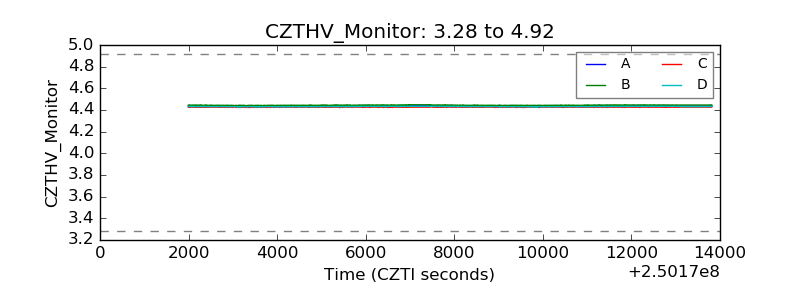 |
| D_VDD | 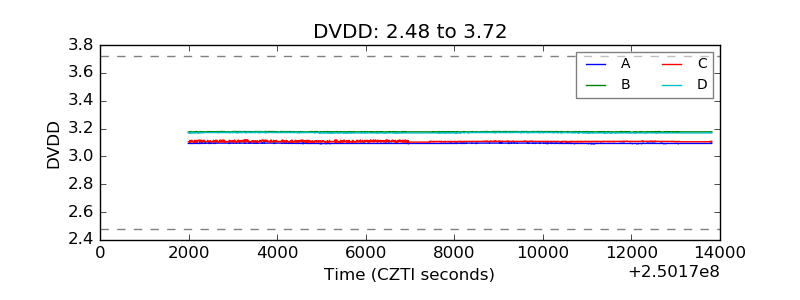 |
| Temperature 1 | 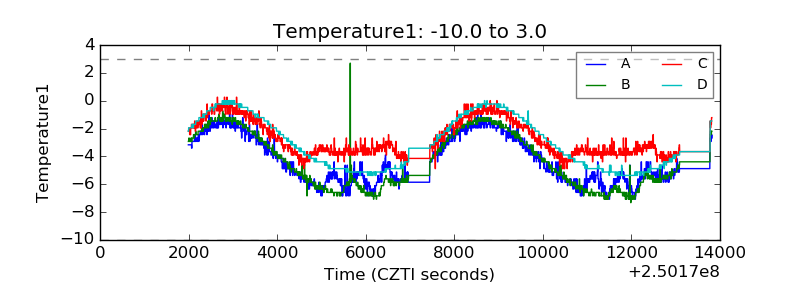 |
| Veto HV Monitor | 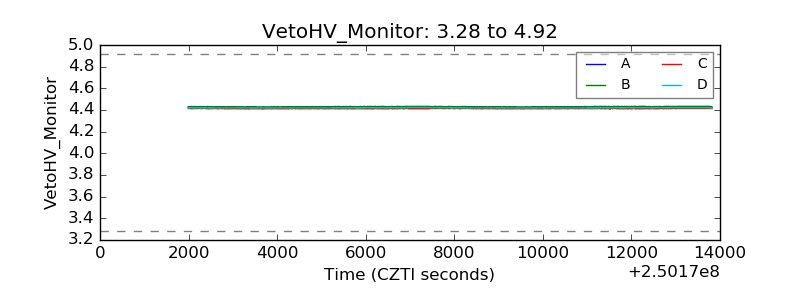 |
| Veto LLD | 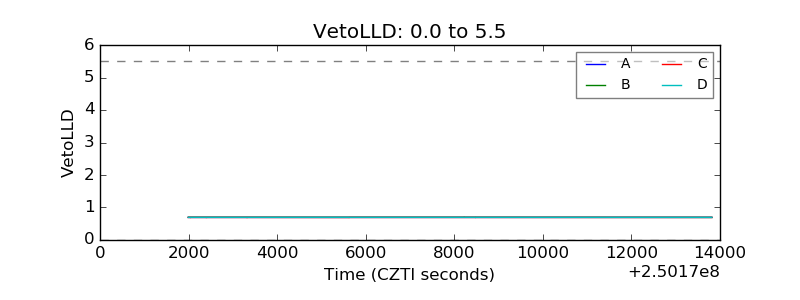 |
| Alpha Counter | 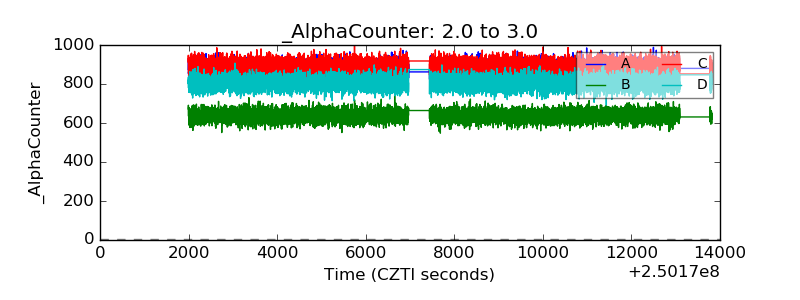 |
| _CPM_Rate | 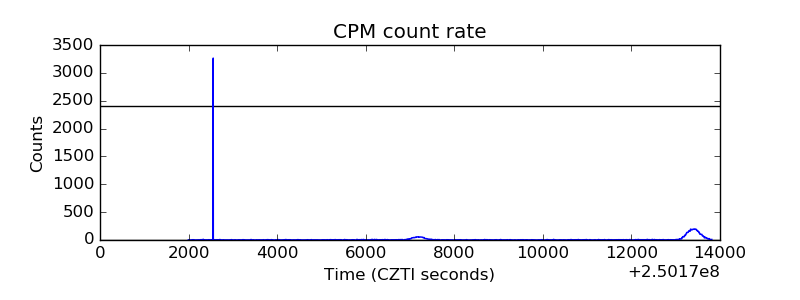 |
| CZT Counter | 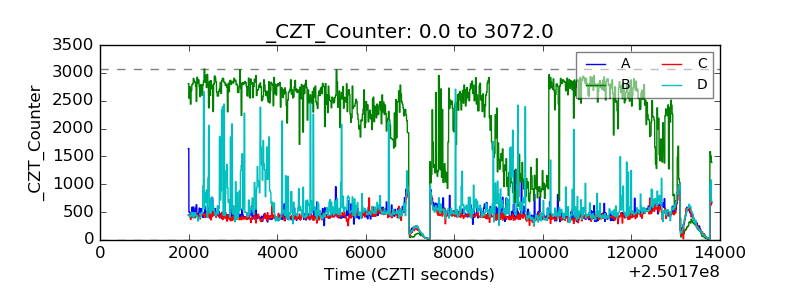 |
| +2.5 Volts monitor |  |
| +5 Volts monitor |  |
| _ROLL_ROT | 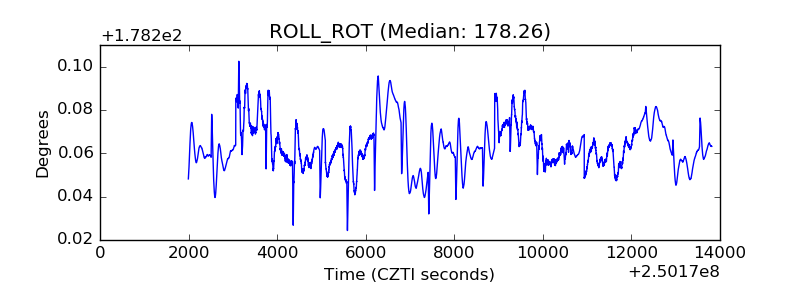 |
| _Roll_DEC |  |
| _Roll_RA | 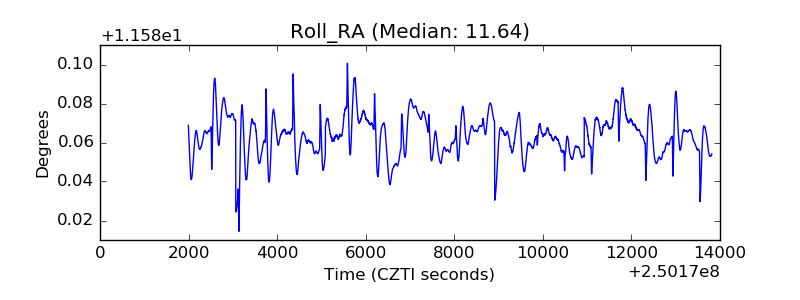 |
| Veto Counter | 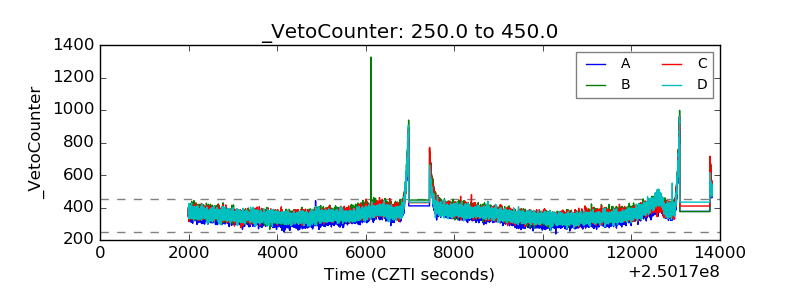 |