| Param | Original file | Final file |
|---|---|---|
| Filename | modeM0/AS1A04_022T07_9000001748_11834cztM0_level2.evt | modeM0/AS1A04_022T07_9000001748_11834cztM0_level2_quad_clean.evt |
| Size (bytes) | 258,995,520 | 52,862,400 |
| Size | 247.0 MB | 50.4 MB |
| Events in quadrant A | 1,501,641 | 354,285 |
| Events in quadrant B | 2,509,991 | 344,276 |
| Events in quadrant C | 1,302,447 | 355,820 |
| Events in quadrant D | 2,326,912 | 334,792 |
| Mode SS | |||
|---|---|---|---|
| Quadrant | BADHDUFLAG | Total packets | Discarded packets |
| A | 0 | 60 | 0 |
| B | 0 | 60 | 0 |
| C | 0 | 60 | 0 |
| D | 0 | 60 | 0 |
| Mode M9 | |||
|---|---|---|---|
| Quadrant | BADHDUFLAG | Total packets | Discarded packets |
| A | 0 | 4 | 0 |
| B | 0 | 4 | 0 |
| C | 0 | 4 | 0 |
| D | 0 | 5 | 0 |
| Mode M0 | |||
|---|---|---|---|
| Quadrant | BADHDUFLAG | Total packets | Discarded packets |
| A | 0 | 6444 | 1 |
| B | 0 | 9611 | 1 |
| C | 0 | 6038 | 1 |
| D | 0 | 9017 | 1 |
| Quadrant | Total seconds | Saturated seconds | Saturation percentage |
|---|---|---|---|
| A | 2962 | 18 | 0.607698% |
| B | 2962 | 132 | 4.456448% |
| C | 2962 | 5 | 0.168805% |
| D | 2962 | 108 | 3.646185% |
Noise dominated data is calculated using 1-second bins in cleaned event files. If a bin has >2000 counts, and if more than 50% of those come from <1% of pixels, then it is considered to be noise-dominated and hence unusable.
| Quadrant | # 1 sec bins | Bins with >0 counts | Bins with >2000 counts | High rate bins dominated by noise | Noise dominated (total time) | Noise dominated (detector-on time) | Marked lightcurve |
|---|---|---|---|---|---|---|---|
| A | 2963 | 2963 | 1 | 1 | 0.03% | 0.03% | 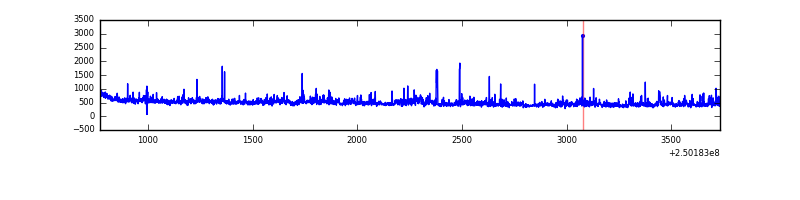 |
| B | 2963 | 2963 | 77 | 77 | 2.60% | 2.60% | 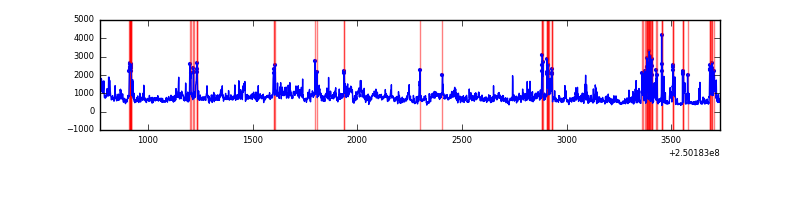 |
| C | 2963 | 2963 | 2 | 2 | 0.07% | 0.07% | 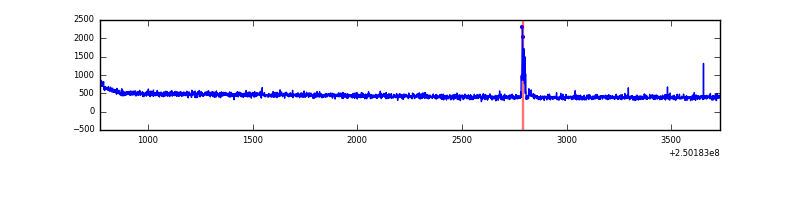 |
| D | 2963 | 2963 | 84 | 84 | 2.83% | 2.83% | 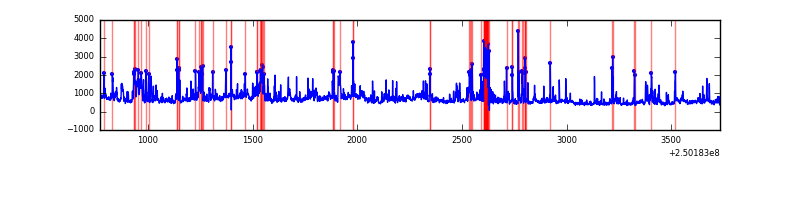 |
Top three noisy pixels from each quadrant. If the there are fewer than three noisy pixels in the level2.evt file, extra rows are filled as -1
| Pixel properties | Quadrant properties | ||||||
|---|---|---|---|---|---|---|---|
| Quadrant | DetID | PixID | Counts | Sigma | Mean | Median | Sigma |
| A | 1 | 162 | 68360 | 967.46 | 336 | 327 | 70.3 |
| A | 13 | 251 | 36846 | 519.32 | 336 | 327 | 70.3 |
| A | 1 | 178 | 34668 | 488.34 | 336 | 327 | 70.3 |
| B | 15 | 204 | 588097 | 9225.59 | 329 | 322 | 63.7 |
| B | 4 | 239 | 372929 | 5848.36 | 329 | 322 | 63.7 |
| B | 10 | 16 | 123189 | 1928.49 | 329 | 322 | 63.7 |
| C | 7 | 238 | 18949 | 236.77 | 328 | 329 | 78.6 |
| C | 7 | 205 | 2934 | 33.12 | 328 | 329 | 78.6 |
| C | 13 | 61 | 2438 | 26.82 | 328 | 329 | 78.6 |
| D | 8 | 195 | 290414 | 3645.91 | 326 | 316 | 79.6 |
| D | 1 | 52 | 224991 | 2823.69 | 326 | 316 | 79.6 |
| D | 13 | 249 | 174862 | 2193.67 | 326 | 316 | 79.6 |
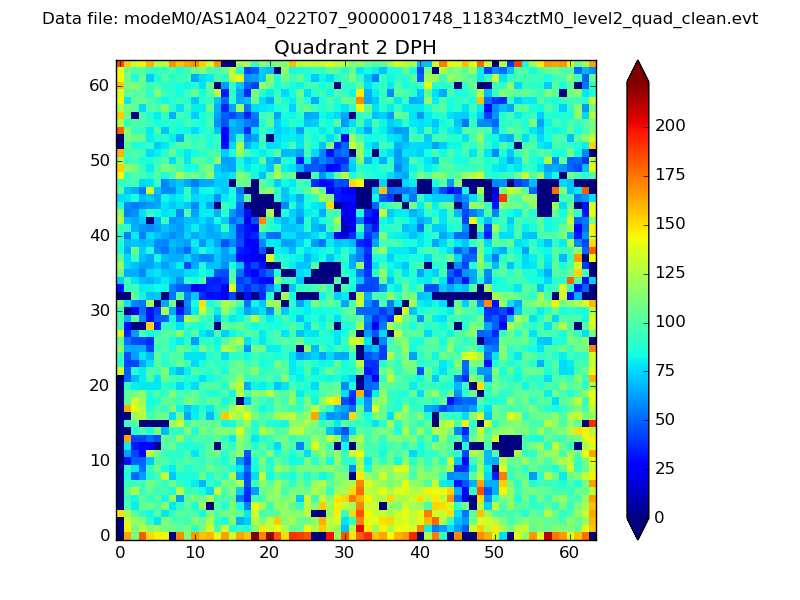
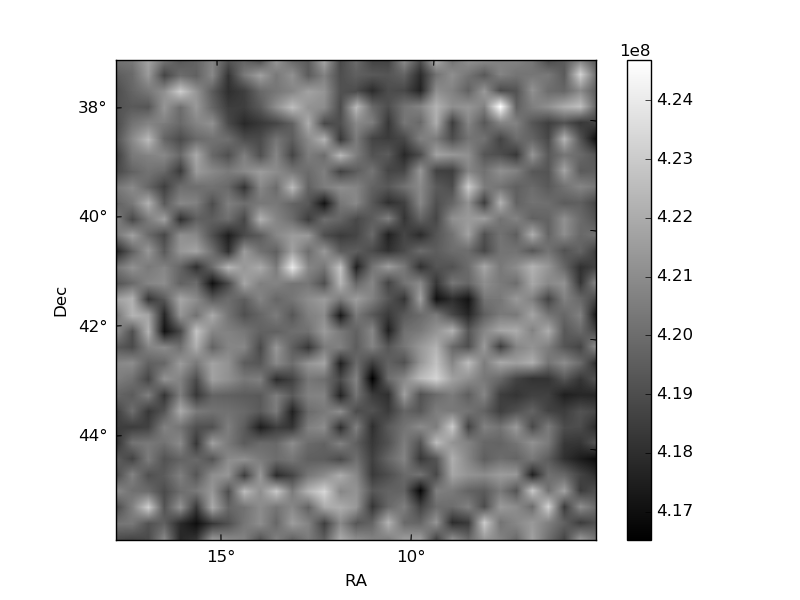
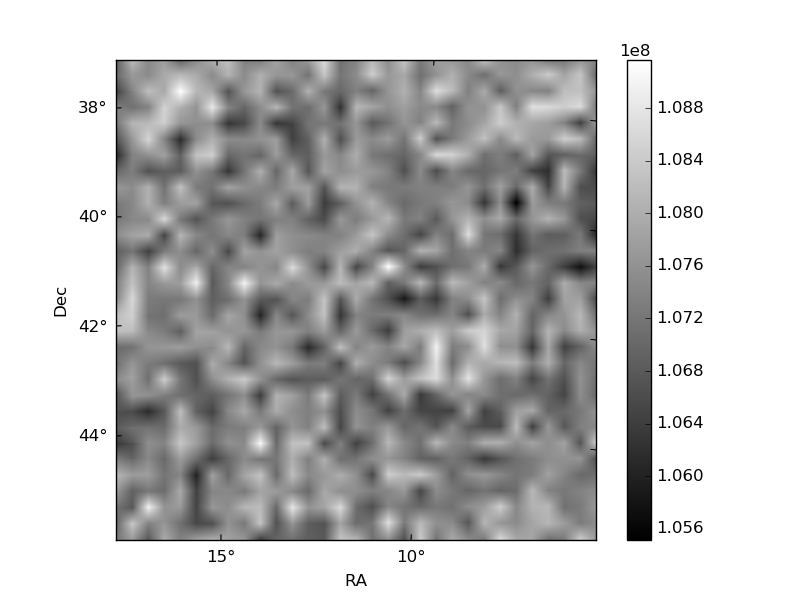
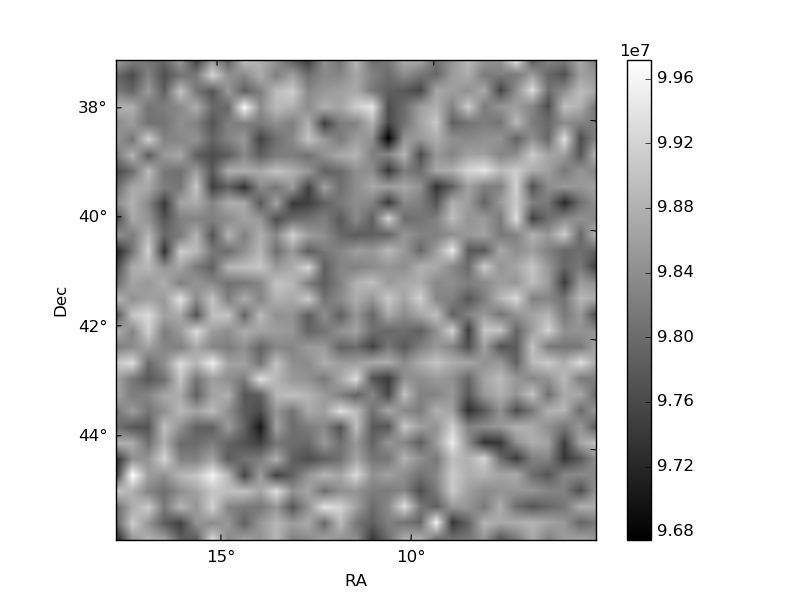
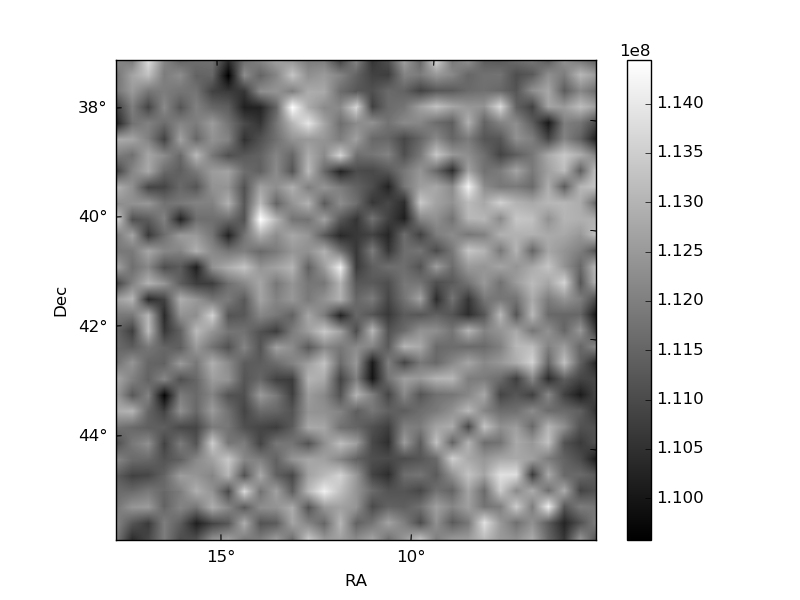
Histogram calculated using DETX and DETY for each event in the final _common_clean file
| Quadrant A | 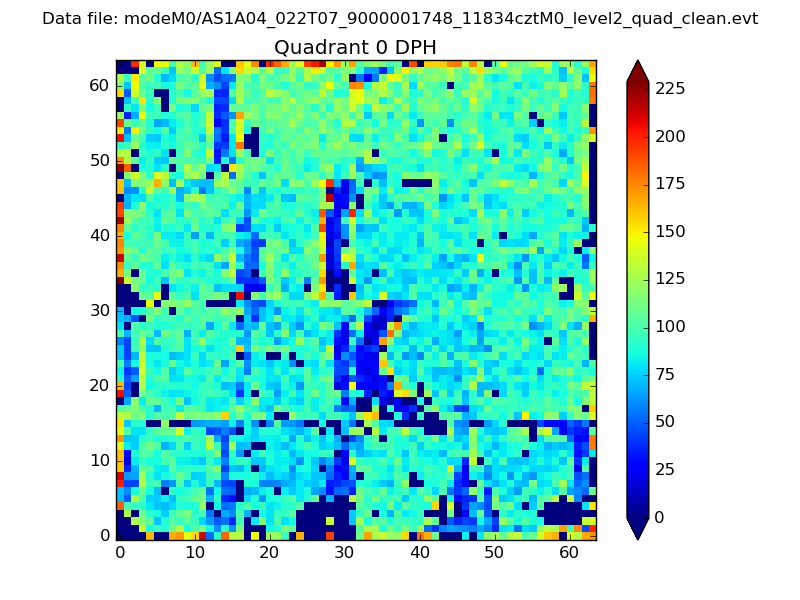 |
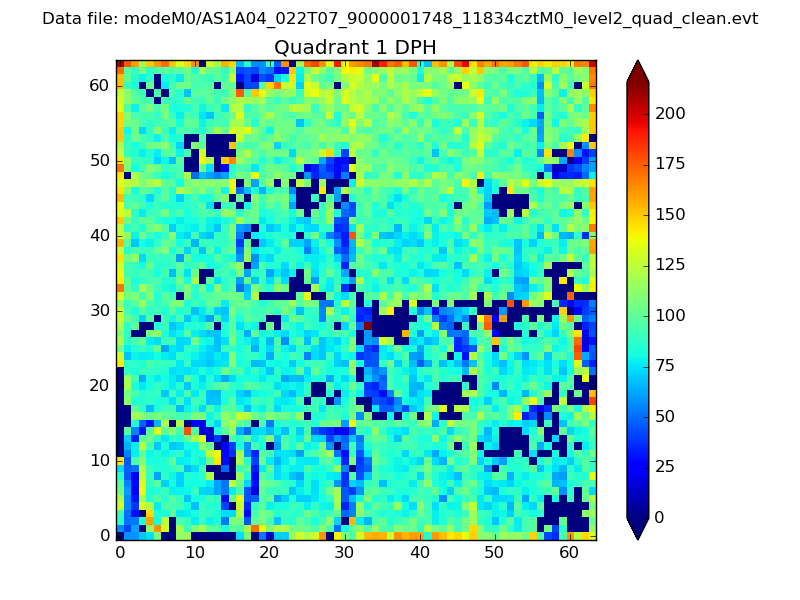 |
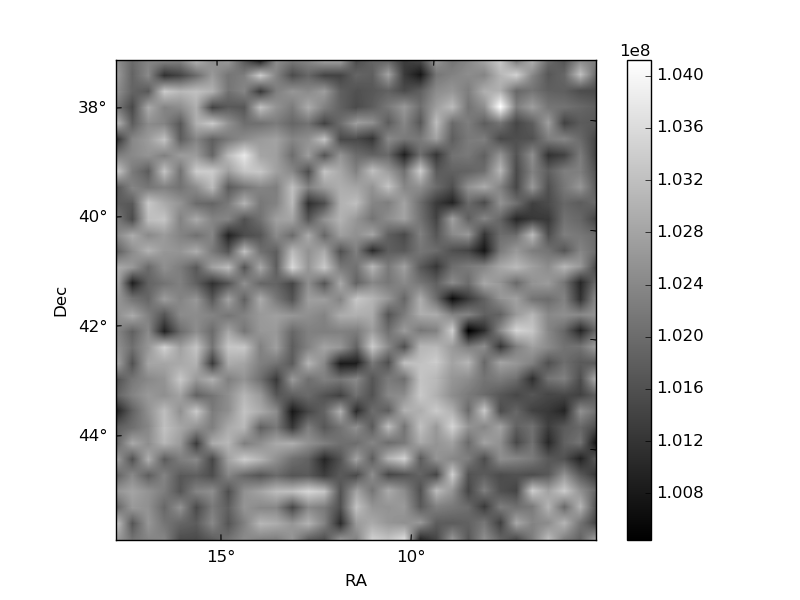
Quadrant B |
|---|---|---|---|
| Quadrant D | 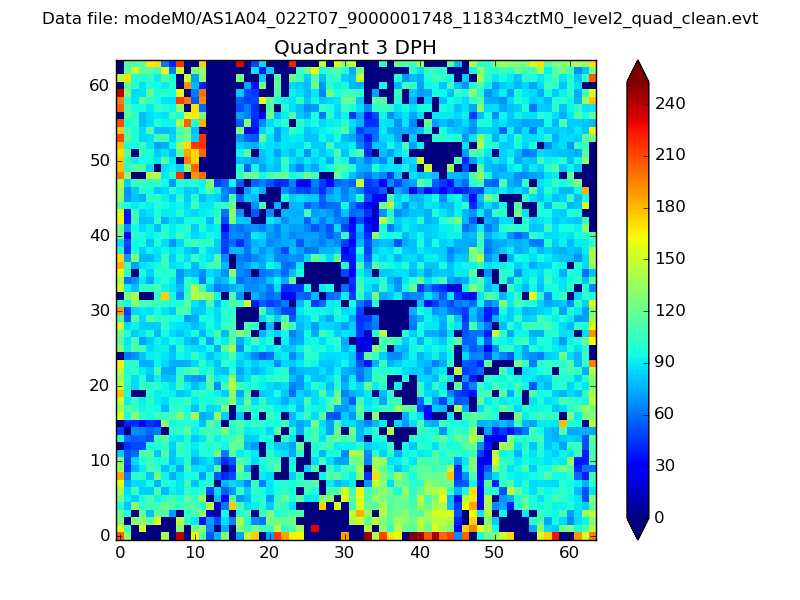 |
 |
Quadrant C |
| Plot type | Count rate plots | Images |
|---|---|---|
| Comparison with Poisson distribution Blue bars denote a histogram of data divided into 1 sec bins. Red curve is a Poisson curve with rate = median count rate of data. |
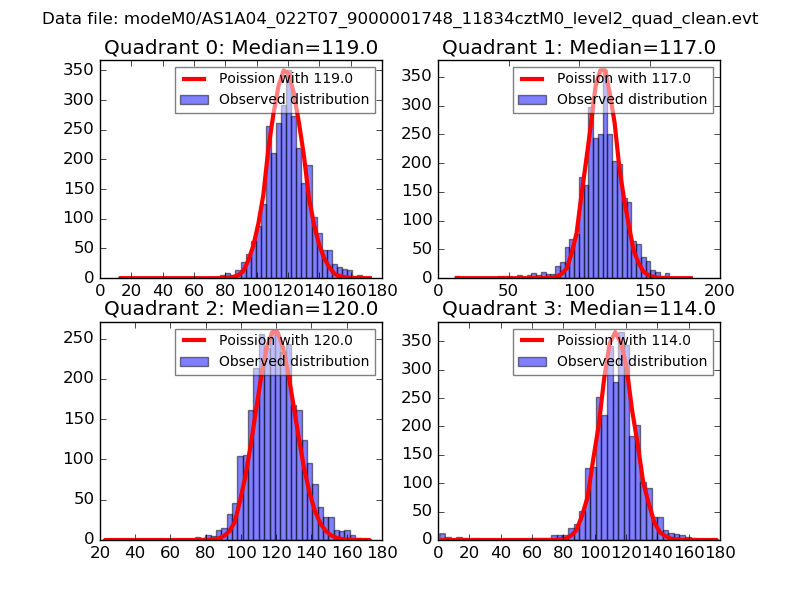 |
 |
| Quadrant-wise count rates Data is divided into 100 sec bins |
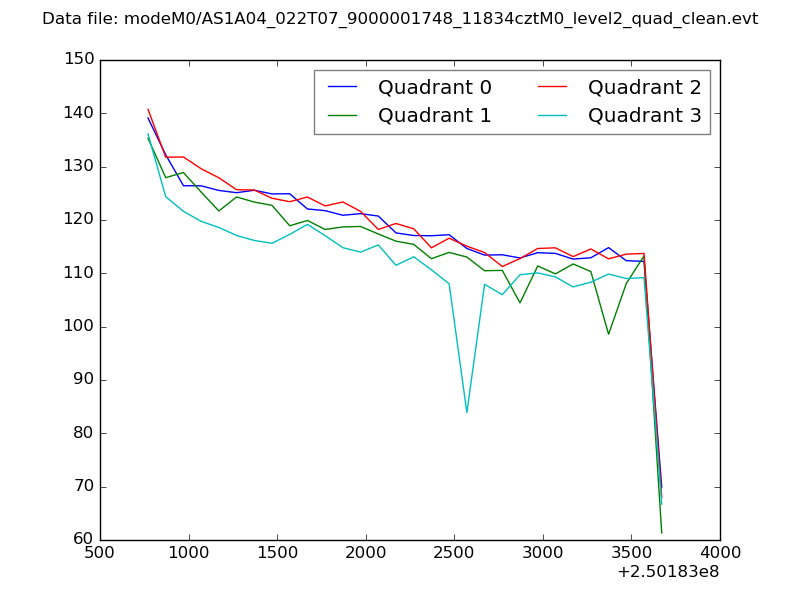 |
|
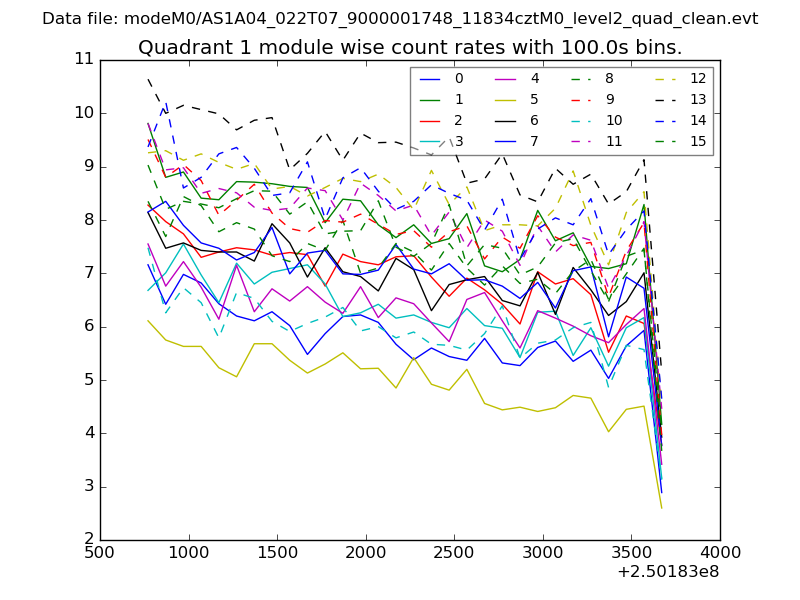
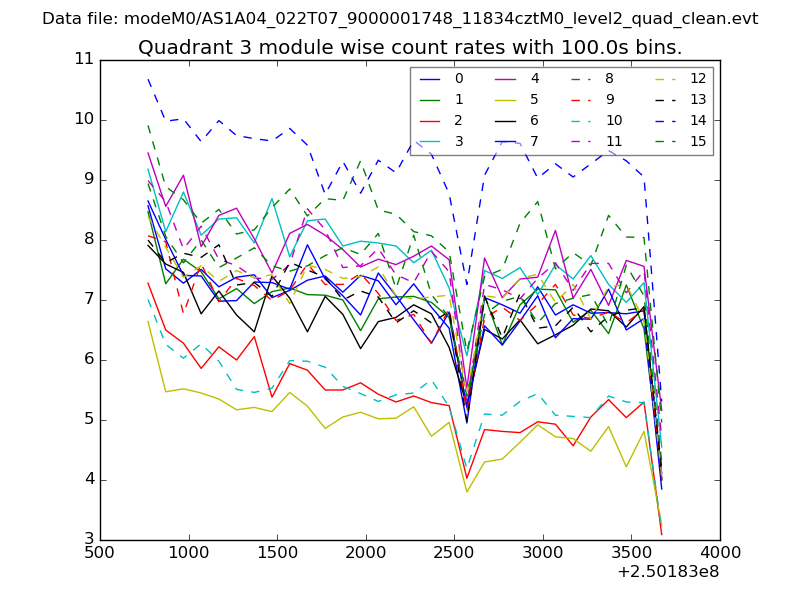
| Module-wise count rates for Quadrant A Data is divided into 100 sec bins |
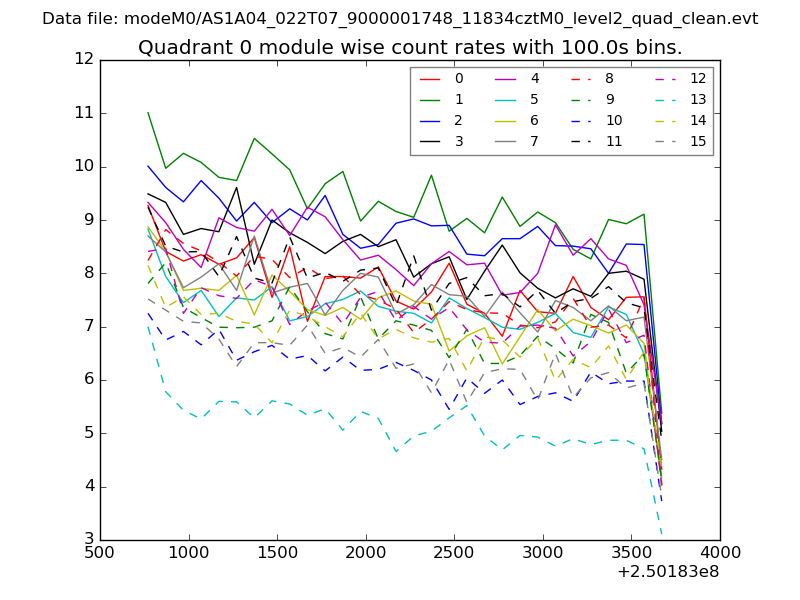 |
 |
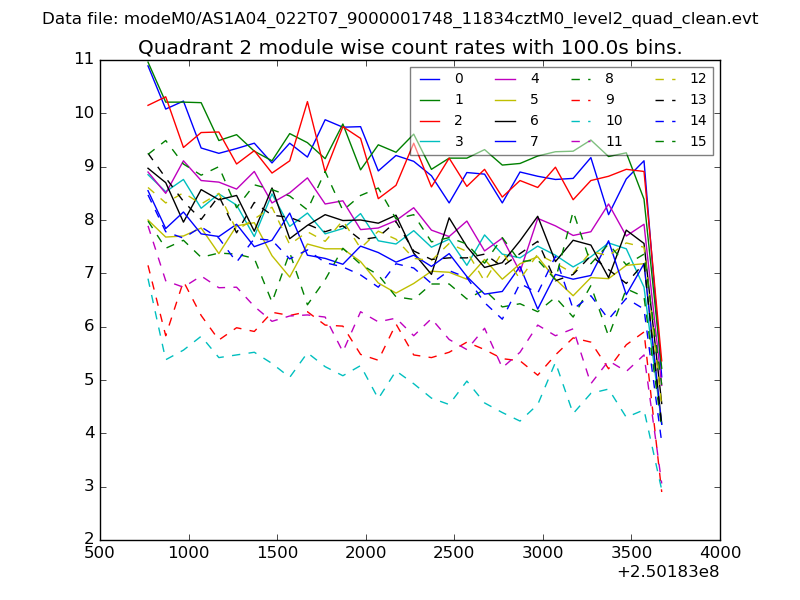
| Module-wise count rates for Quadrant B Data is divided into 100 sec bins |
 |
 |
| Module-wise count rates for Quadrant C Data is divided into 100 sec bins |
 |
 |
| Module-wise count rates for Quadrant D Data is divided into 100 sec bins |
 |
 |
| Parameter | Plot |
|---|---|
| CZT HV Monitor | 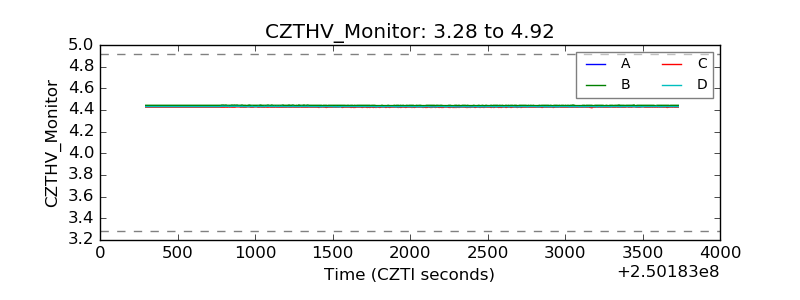 |
| D_VDD | 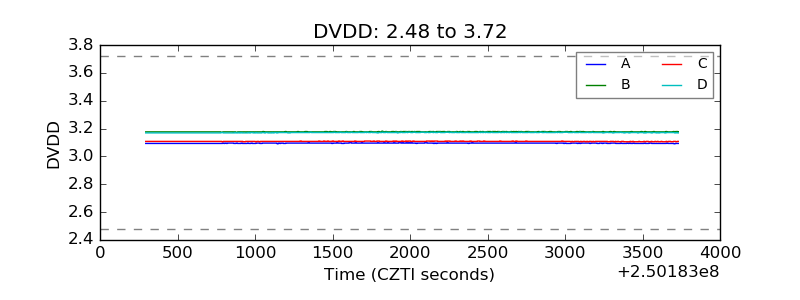 |
| Temperature 1 |  |
| Veto HV Monitor | 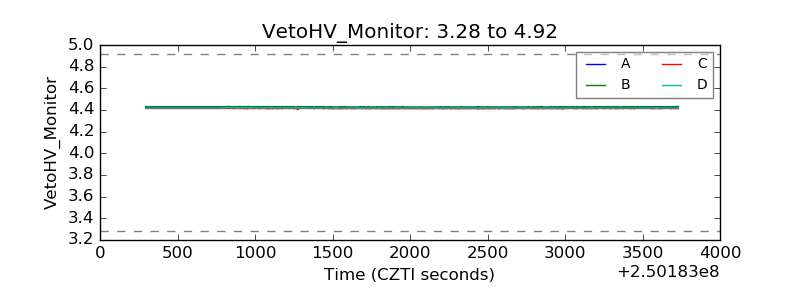 |
| Veto LLD |  |
| Alpha Counter | 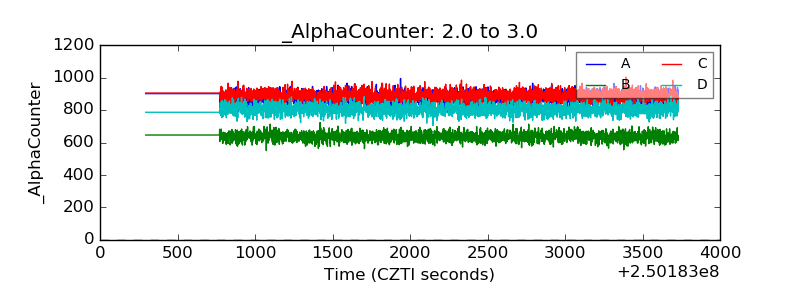 |
| _CPM_Rate | 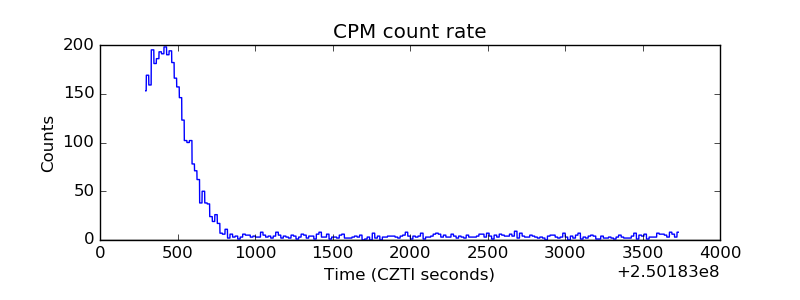 |
| CZT Counter | 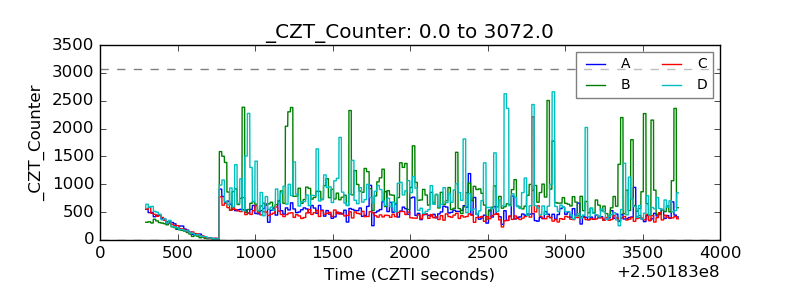 |
| +2.5 Volts monitor |  |
| +5 Volts monitor |  |
| _ROLL_ROT | 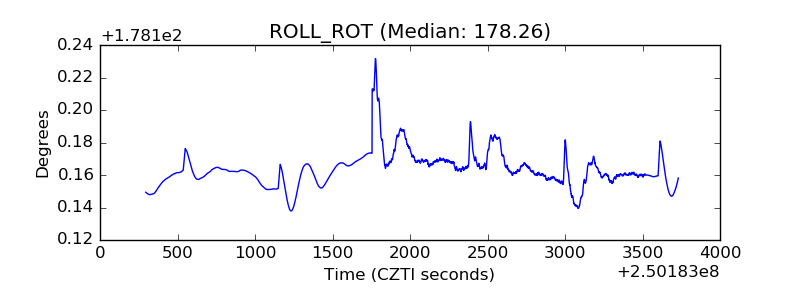 |
| _Roll_DEC | 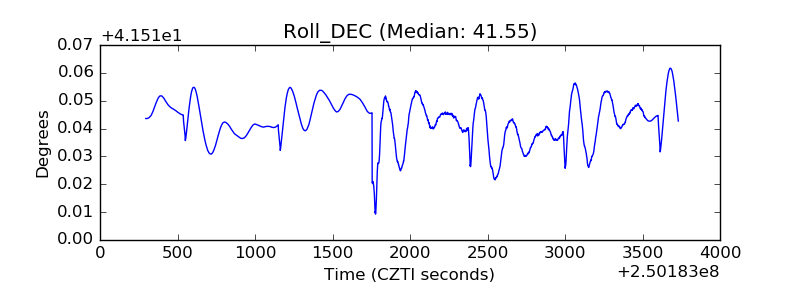 |
| _Roll_RA | 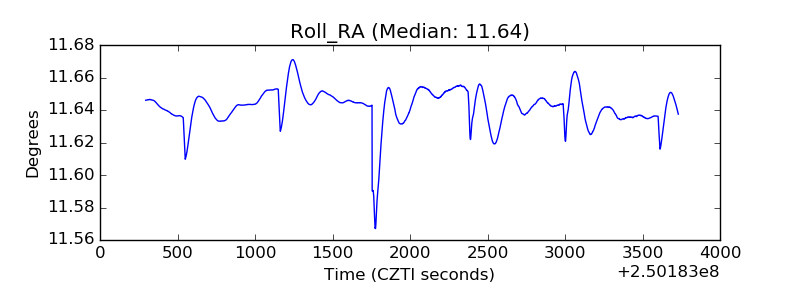 |
| Veto Counter | 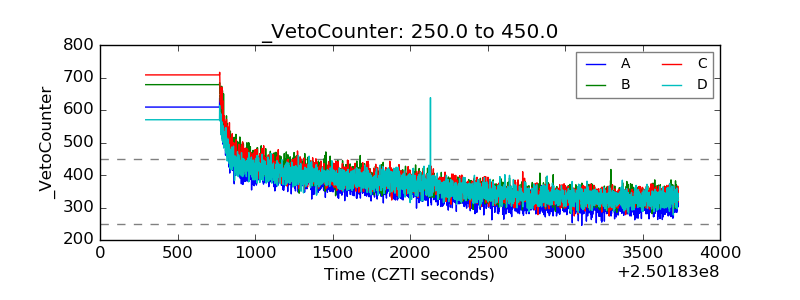 |