| Param | Original file | Final file |
|---|---|---|
| Filename | modeM0/AS1A04_088T03_9000001750_11834cztM0_level2.evt | modeM0/AS1A04_088T03_9000001750_11834cztM0_level2_quad_clean.evt |
| Size (bytes) | 223,499,520 | 32,299,200 |
| Size | 213.1 MB | 30.8 MB |
| Events in quadrant A | 1,525,301 | 200,119 |
| Events in quadrant B | 2,162,909 | 196,592 |
| Events in quadrant C | 1,374,190 | 195,748 |
| Events in quadrant D | 1,516,394 | 187,179 |
| Mode SS | |||
|---|---|---|---|
| Quadrant | BADHDUFLAG | Total packets | Discarded packets |
| A | 0 | 60 | 0 |
| B | 0 | 60 | 0 |
| C | 0 | 60 | 0 |
| D | 0 | 60 | 0 |
| Mode M0 | |||
|---|---|---|---|
| Quadrant | BADHDUFLAG | Total packets | Discarded packets |
| A | 0 | 6247 | 2 |
| B | 0 | 8259 | 1 |
| C | 0 | 5794 | 1 |
| D | 0 | 6224 | 1 |
| Mode M9 | |||
|---|---|---|---|
| Quadrant | BADHDUFLAG | Total packets | Discarded packets |
| A | 0 | 8 | 0 |
| B | 0 | 8 | 0 |
| C | 0 | 8 | 0 |
| D | 0 | 8 | 0 |
| Quadrant | Total seconds | Saturated seconds | Saturation percentage |
|---|---|---|---|
| A | 2758 | 44 | 1.595359% |
| B | 2758 | 190 | 6.889050% |
| C | 2758 | 23 | 0.833938% |
| D | 2758 | 55 | 1.994199% |
Noise dominated data is calculated using 1-second bins in cleaned event files. If a bin has >2000 counts, and if more than 50% of those come from <1% of pixels, then it is considered to be noise-dominated and hence unusable.
| Quadrant | # 1 sec bins | Bins with >0 counts | Bins with >2000 counts | High rate bins dominated by noise | Noise dominated (total time) | Noise dominated (detector-on time) | Marked lightcurve |
|---|---|---|---|---|---|---|---|
| A | 3639 | 2760 | 2 | 2 | 0.05% | 0.07% | 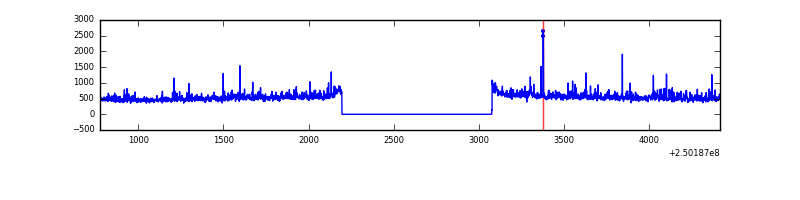 |
| B | 3639 | 2760 | 74 | 74 | 2.03% | 2.68% | 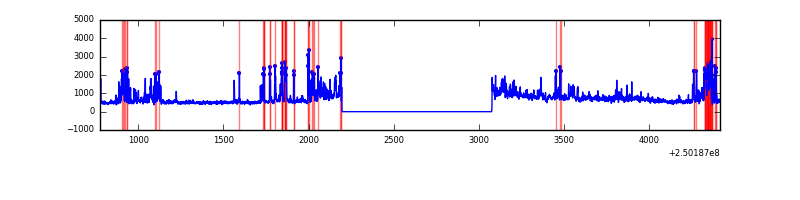 |
| C | 3639 | 2760 | 1 | 1 | 0.03% | 0.04% | 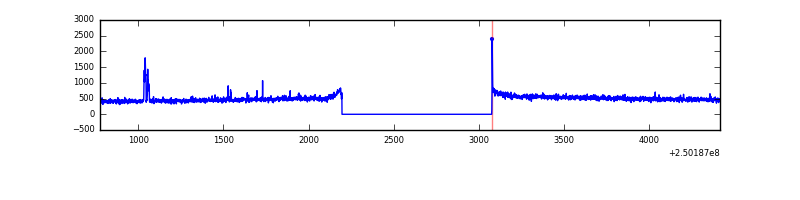 |
| D | 3639 | 2760 | 28 | 28 | 0.77% | 1.01% | 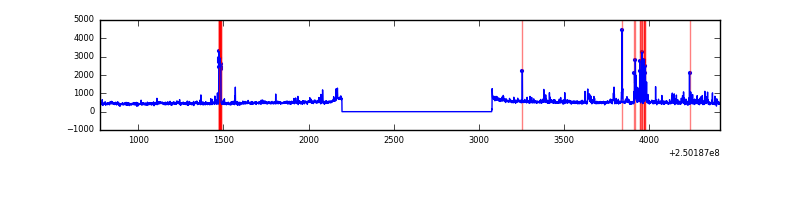 |
Top three noisy pixels from each quadrant. If the there are fewer than three noisy pixels in the level2.evt file, extra rows are filled as -1
| Pixel properties | Quadrant properties | ||||||
|---|---|---|---|---|---|---|---|
| Quadrant | DetID | PixID | Counts | Sigma | Mean | Median | Sigma |
| A | 1 | 162 | 50993 | 673.39 | 359 | 352 | 75.2 |
| A | 1 | 178 | 25422 | 333.36 | 359 | 352 | 75.2 |
| A | 1 | 161 | 22529 | 294.89 | 359 | 352 | 75.2 |
| B | 4 | 239 | 312618 | 4527.98 | 348 | 339 | 69.0 |
| B | 3 | 64 | 170929 | 2473.52 | 348 | 339 | 69.0 |
| B | 15 | 204 | 159709 | 2310.83 | 348 | 339 | 69.0 |
| C | 7 | 238 | 20234 | 244.53 | 344 | 345 | 81.3 |
| C | 0 | 10 | 5010 | 57.36 | 344 | 345 | 81.3 |
| C | 12 | 4 | 3498 | 38.77 | 344 | 345 | 81.3 |
| D | 13 | 249 | 84125 | 990.0 | 345 | 334 | 84.6 |
| D | 1 | 52 | 57540 | 675.89 | 345 | 334 | 84.6 |
| D | 12 | 233 | 37439 | 438.4 | 345 | 334 | 84.6 |
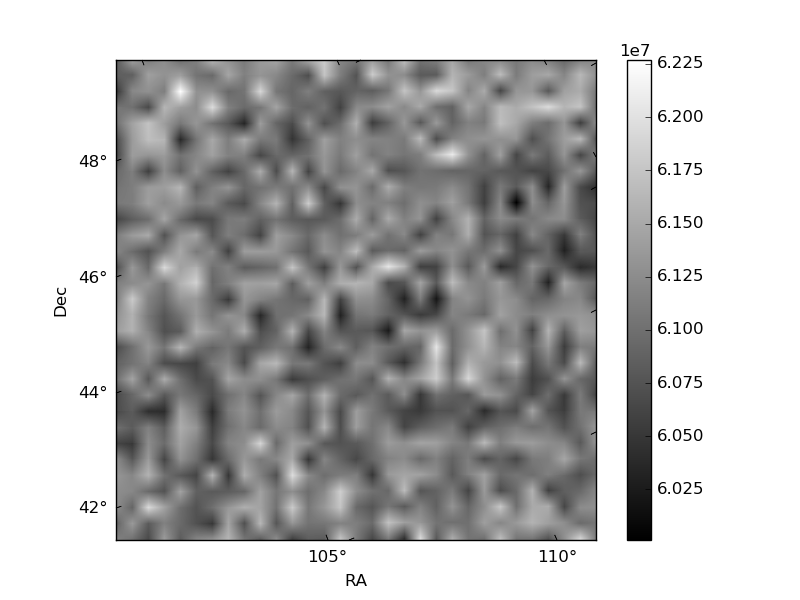
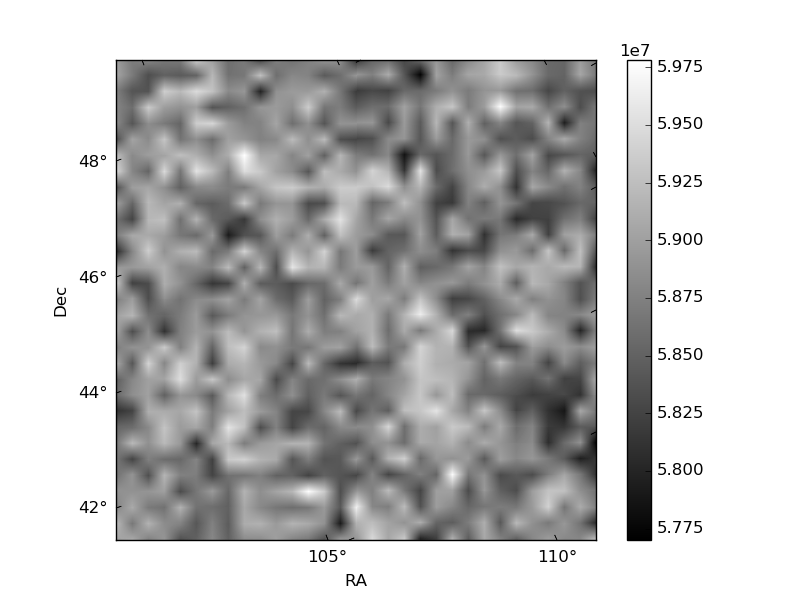
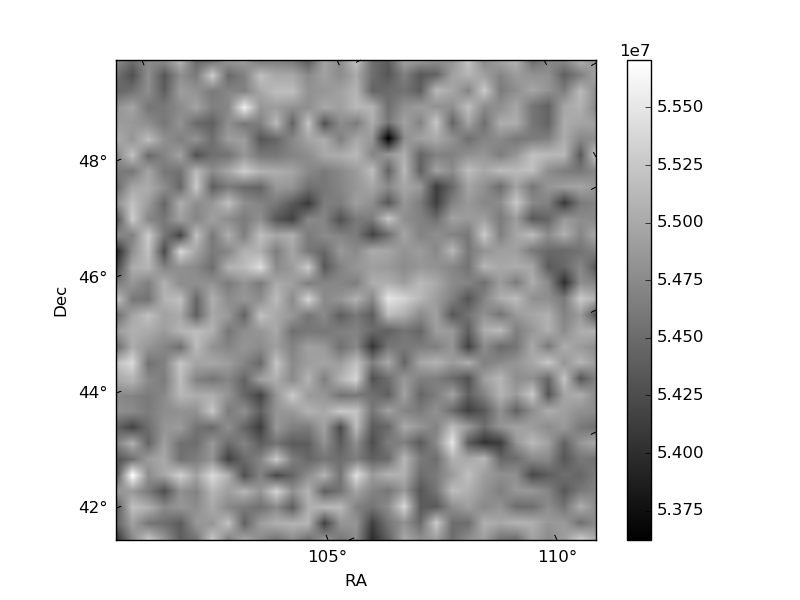
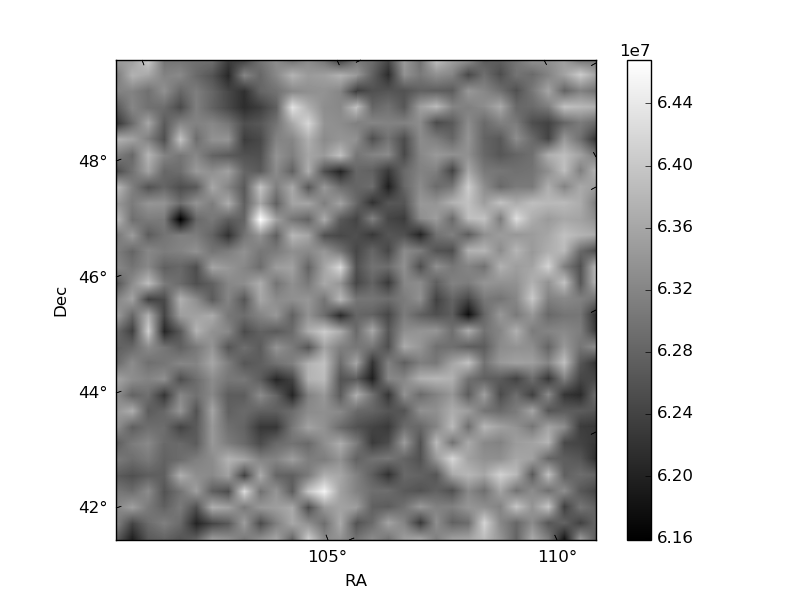
Histogram calculated using DETX and DETY for each event in the final _common_clean file
| Quadrant A | 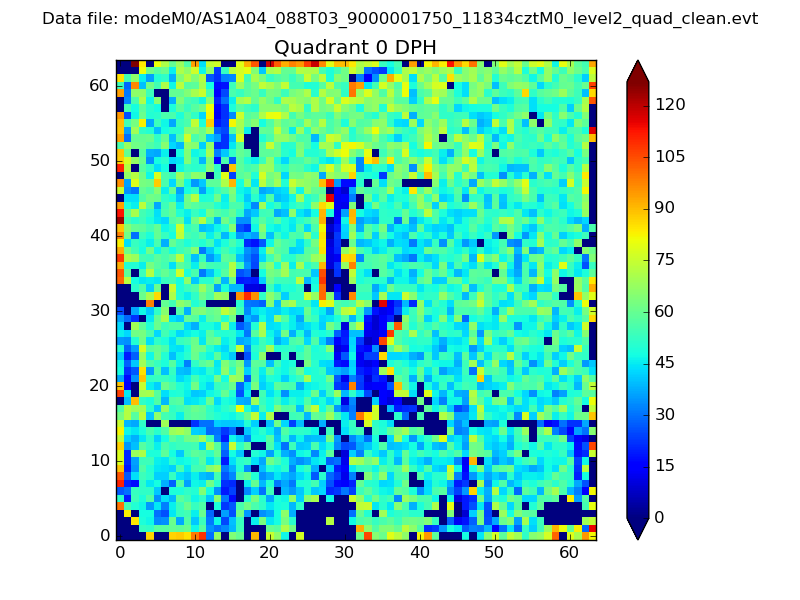 |
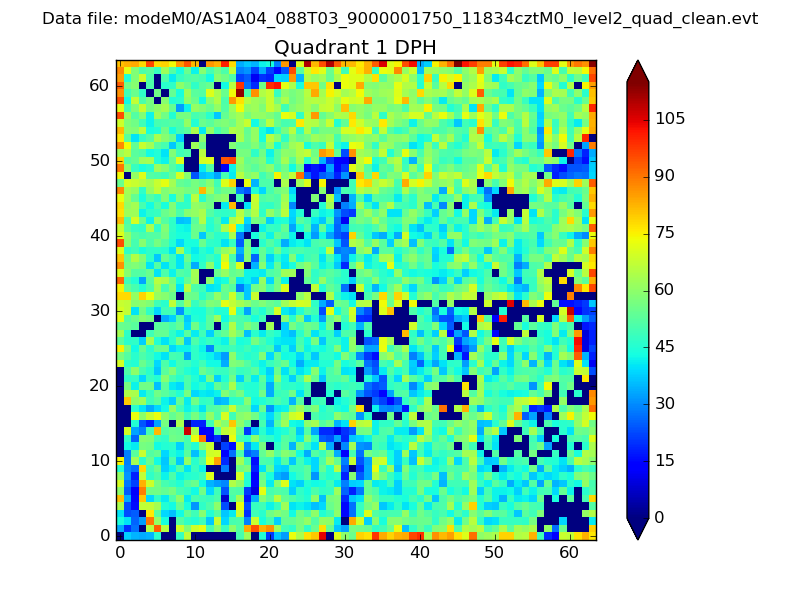 |
Quadrant B |
|---|---|---|---|
| Quadrant D | 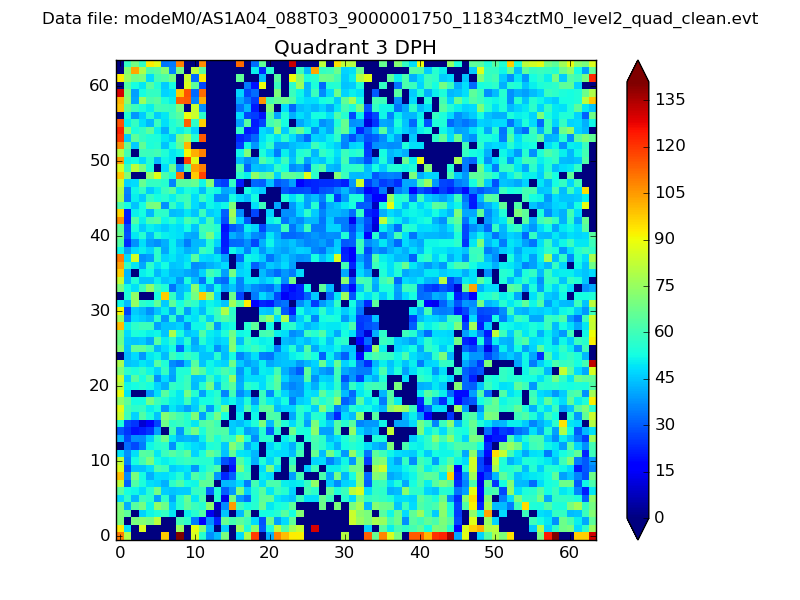 |
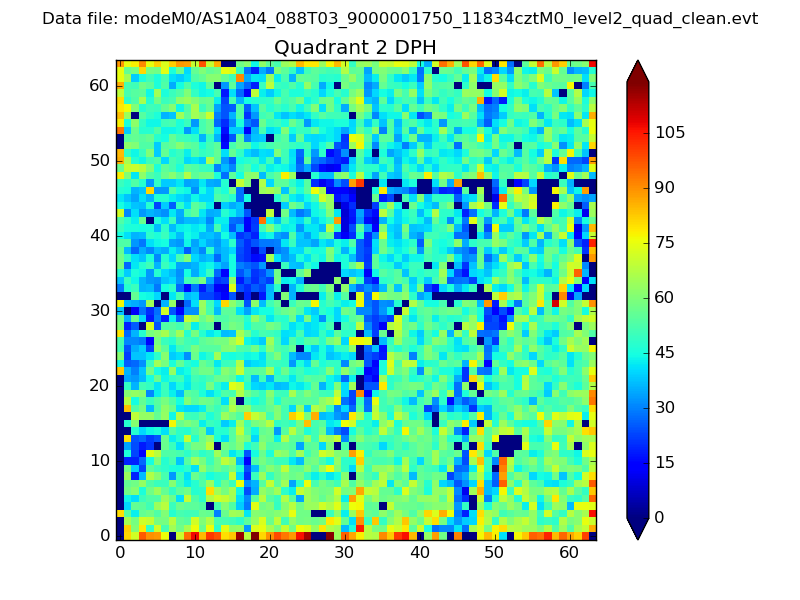 |
Quadrant C |
| Plot type | Count rate plots | Images |
|---|---|---|
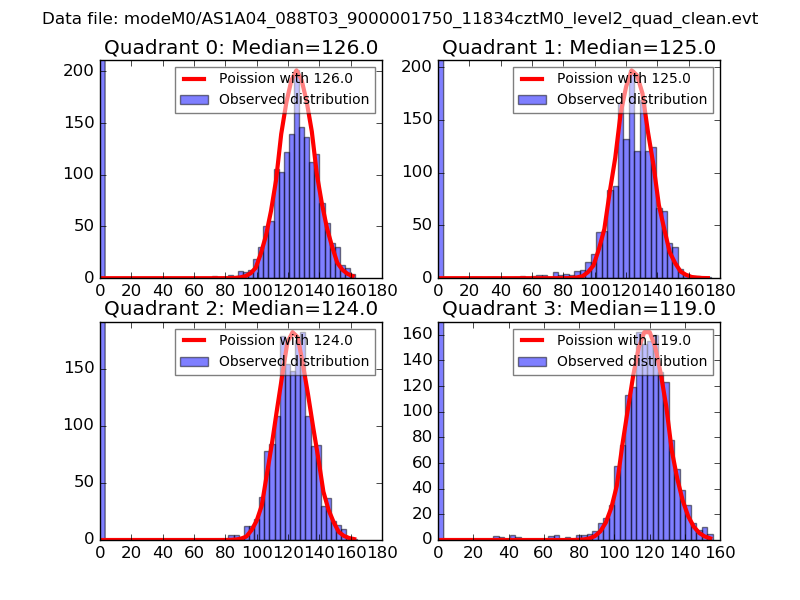
| Comparison with Poisson distribution Blue bars denote a histogram of data divided into 1 sec bins. Red curve is a Poisson curve with rate = median count rate of data. |
 |
 |
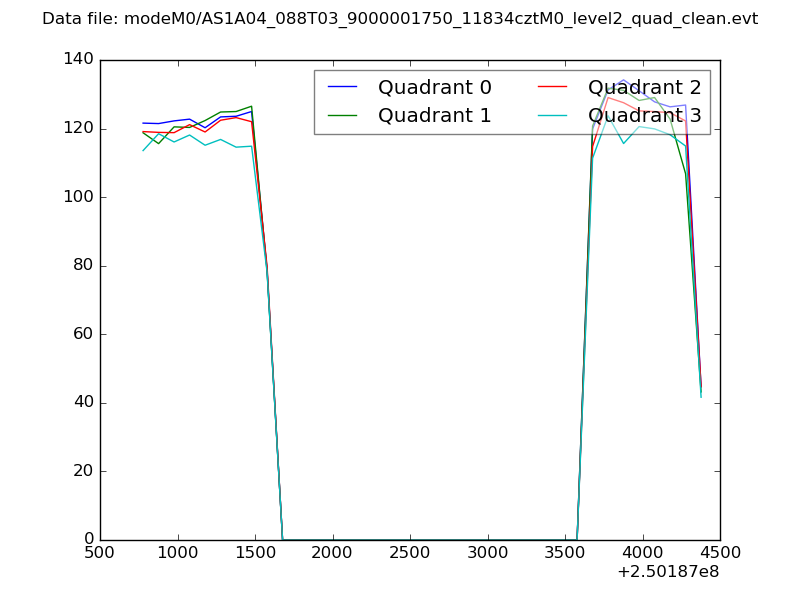
| Quadrant-wise count rates Data is divided into 100 sec bins |
 |
|
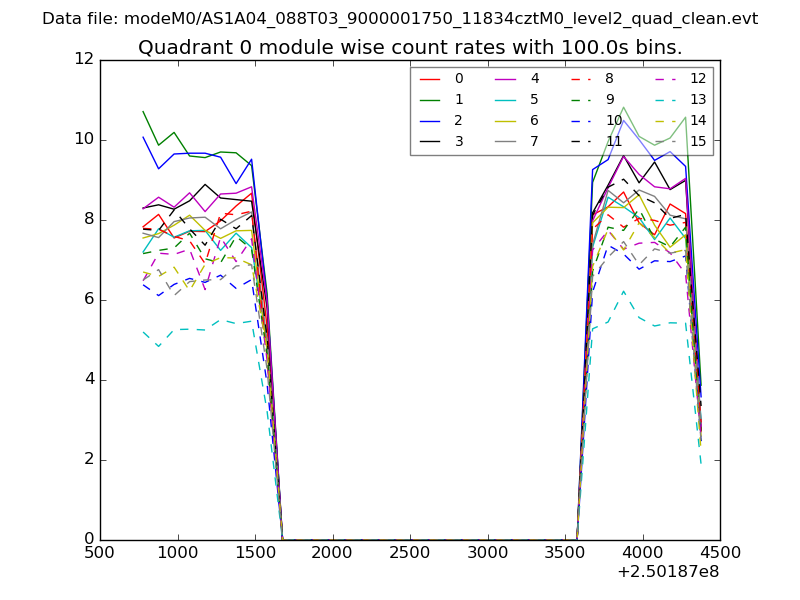
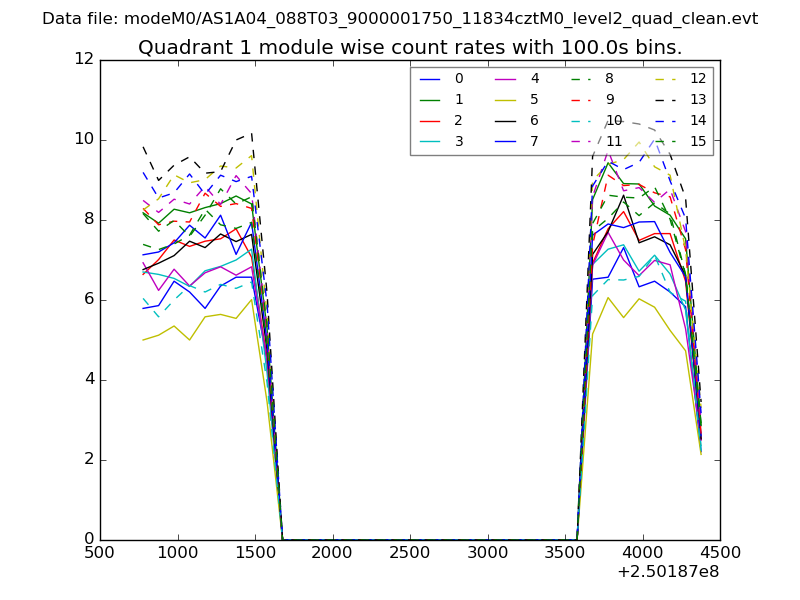
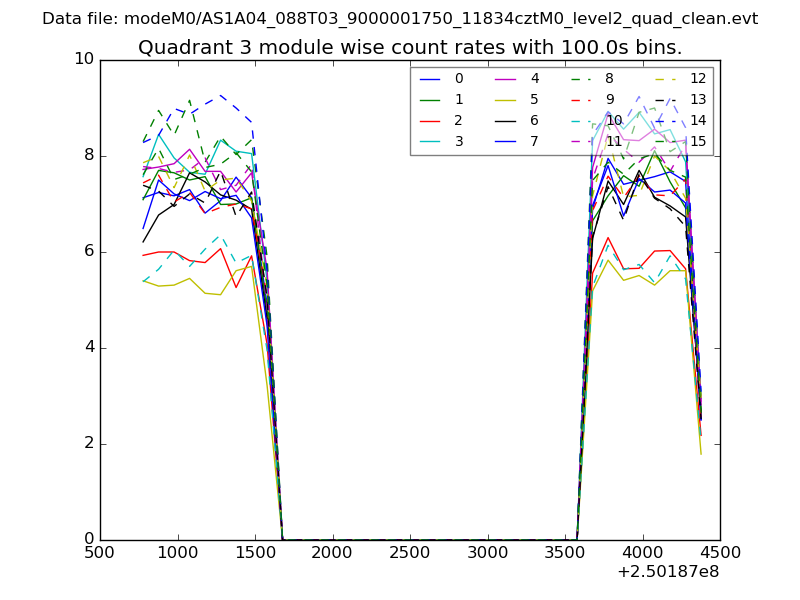
| Module-wise count rates for Quadrant A Data is divided into 100 sec bins |
 |
 |
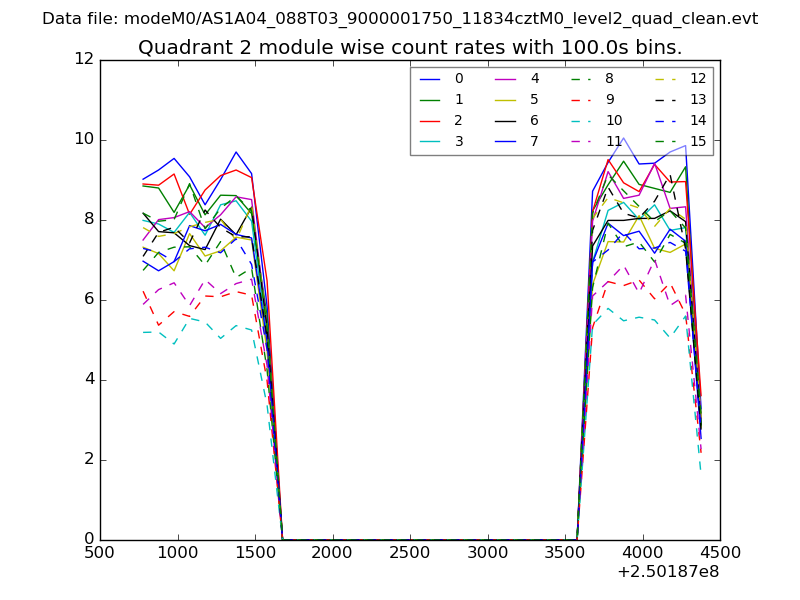
| Module-wise count rates for Quadrant B Data is divided into 100 sec bins |
 |
 |
| Module-wise count rates for Quadrant C Data is divided into 100 sec bins |
 |
 |
| Module-wise count rates for Quadrant D Data is divided into 100 sec bins |
 |
 |
| Parameter | Plot |
|---|---|
| CZT HV Monitor | 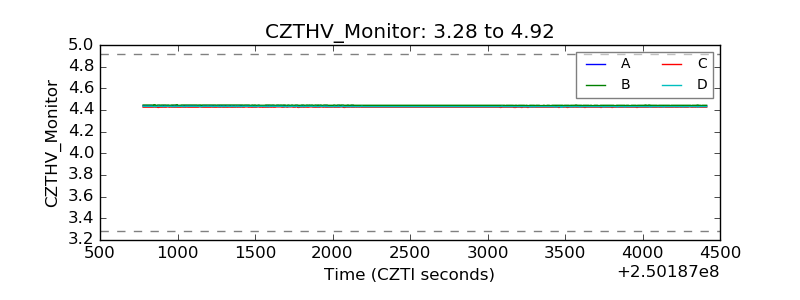 |
| D_VDD | 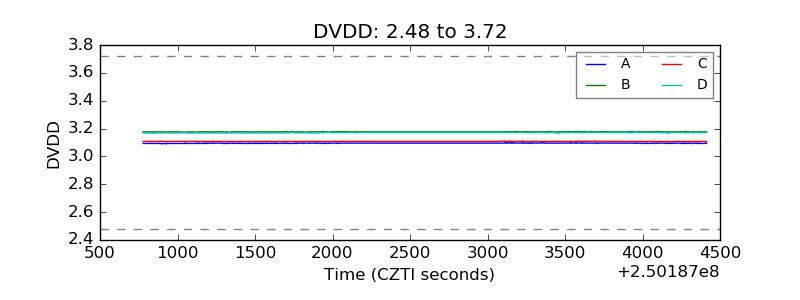 |
| Temperature 1 |  |
| Veto HV Monitor | 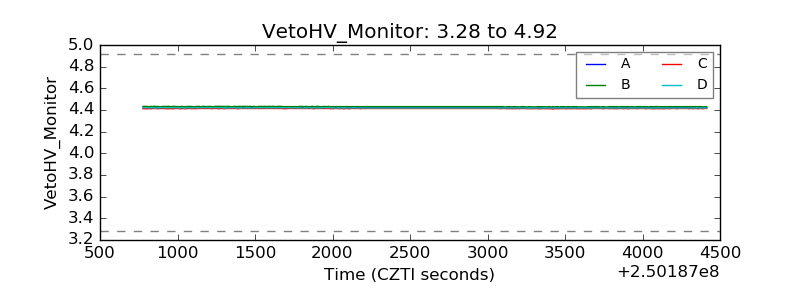 |
| Veto LLD | 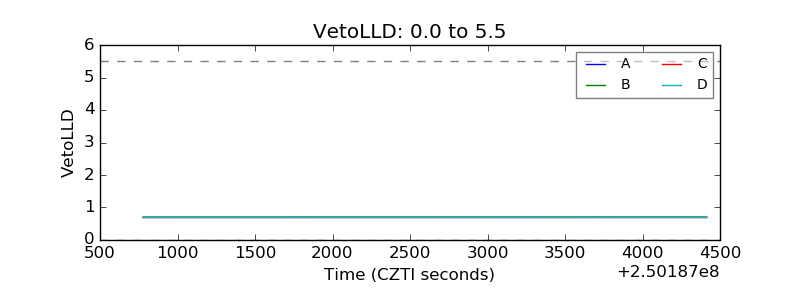 |
| Alpha Counter | 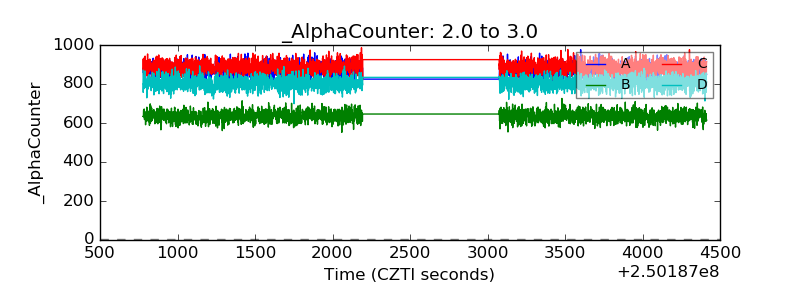 |
| _CPM_Rate | 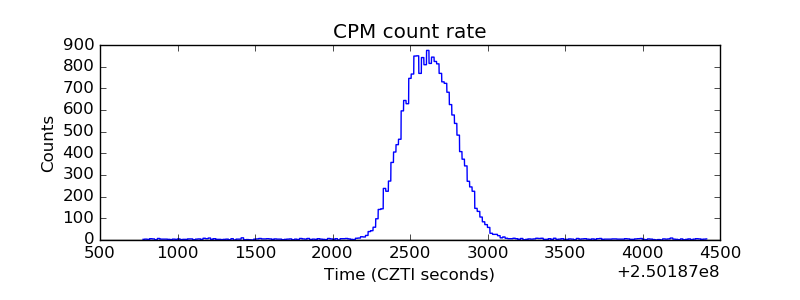 |
| CZT Counter | 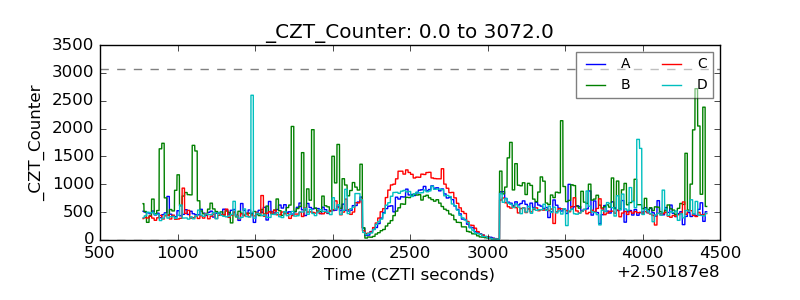 |
| +2.5 Volts monitor |  |
| +5 Volts monitor |  |
| _ROLL_ROT | 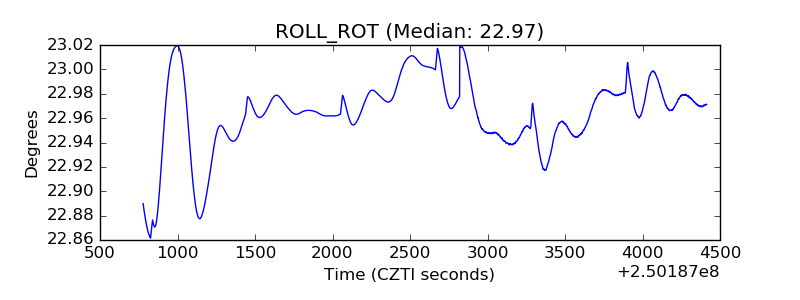 |
| _Roll_DEC | 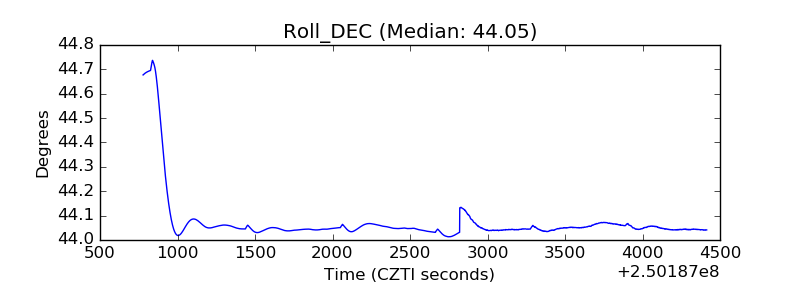 |
| _Roll_RA | 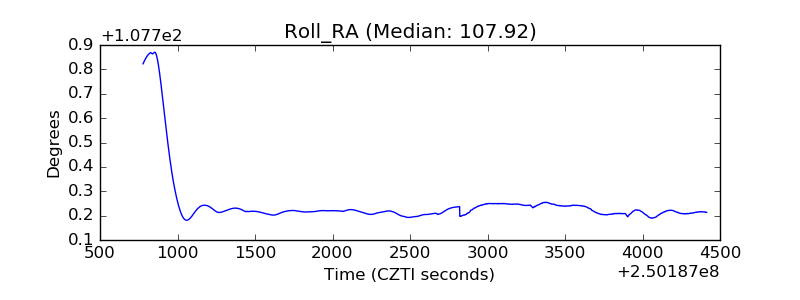 |
| Veto Counter | 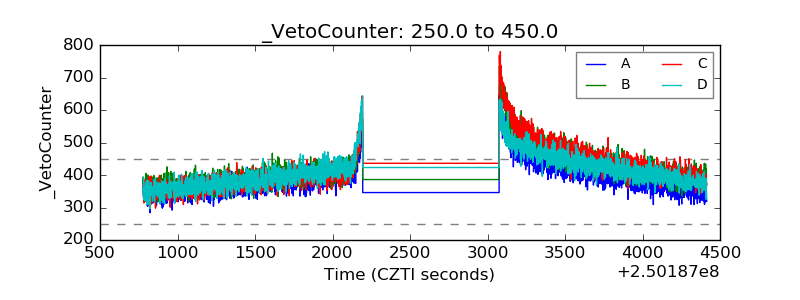 |