| Param | Original file | Final file |
|---|---|---|
| Filename | modeM0/AS1A04_088T03_9000001750_11837cztM0_level2.evt | modeM0/AS1A04_088T03_9000001750_11837cztM0_level2_quad_clean.evt |
| Size (bytes) | 509,935,680 | 98,216,640 |
| Size | 486.3 MB | 93.7 MB |
| Events in quadrant A | 3,193,579 | 656,075 |
| Events in quadrant B | 4,781,326 | 627,330 |
| Events in quadrant C | 2,987,581 | 645,504 |
| Events in quadrant D | 4,056,051 | 608,294 |
| Mode SS | |||
|---|---|---|---|
| Quadrant | BADHDUFLAG | Total packets | Discarded packets |
| A | 0 | 128 | 0 |
| B | 0 | 128 | 0 |
| C | 0 | 128 | 0 |
| D | 0 | 128 | 0 |
| Mode M0 | |||
|---|---|---|---|
| Quadrant | BADHDUFLAG | Total packets | Discarded packets |
| A | 0 | 13860 | 3 |
| B | 0 | 18563 | 2 |
| C | 0 | 13378 | 2 |
| D | 0 | 16336 | 2 |
| Mode M9 | |||
|---|---|---|---|
| Quadrant | BADHDUFLAG | Total packets | Discarded packets |
| A | 0 | 12 | 0 |
| B | 0 | 12 | 0 |
| C | 0 | 12 | 0 |
| D | 0 | 13 | 0 |
| Quadrant | Total seconds | Saturated seconds | Saturation percentage |
|---|---|---|---|
| A | 6258 | 31 | 0.495366% |
| B | 6258 | 573 | 9.156280% |
| C | 6258 | 66 | 1.054650% |
| D | 6258 | 242 | 3.867050% |
Noise dominated data is calculated using 1-second bins in cleaned event files. If a bin has >2000 counts, and if more than 50% of those come from <1% of pixels, then it is considered to be noise-dominated and hence unusable.
| Quadrant | # 1 sec bins | Bins with >0 counts | Bins with >2000 counts | High rate bins dominated by noise | Noise dominated (total time) | Noise dominated (detector-on time) | Marked lightcurve |
|---|---|---|---|---|---|---|---|
| A | 7439 | 6260 | 4 | 4 | 0.05% | 0.06% |  |
| B | 7439 | 6260 | 320 | 320 | 4.30% | 5.11% | 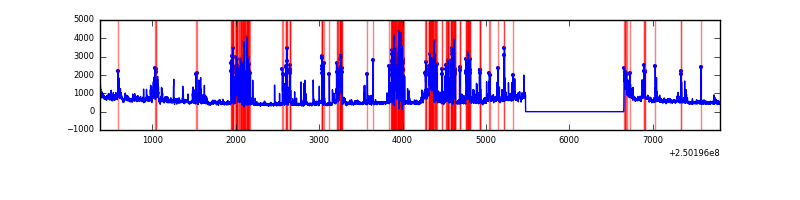 |
| C | 7439 | 6260 | 11 | 11 | 0.15% | 0.18% | 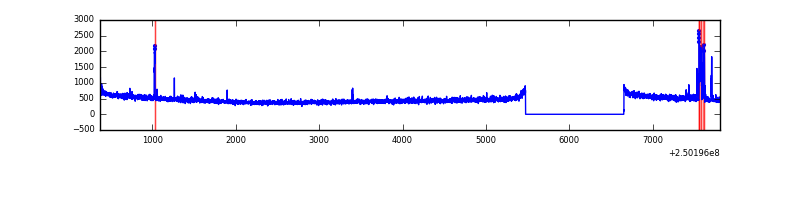 |
| D | 7439 | 6260 | 240 | 240 | 3.23% | 3.83% | 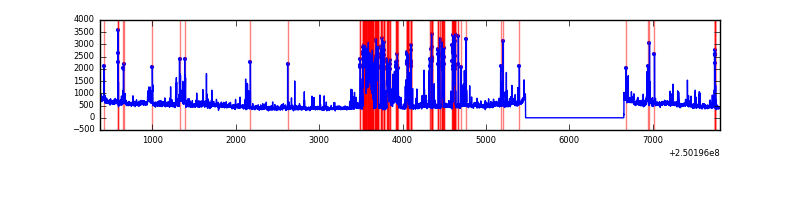 |
Top three noisy pixels from each quadrant. If the there are fewer than three noisy pixels in the level2.evt file, extra rows are filled as -1
| Pixel properties | Quadrant properties | ||||||
|---|---|---|---|---|---|---|---|
| Quadrant | DetID | PixID | Counts | Sigma | Mean | Median | Sigma |
| A | 15 | 174 | 74042 | 479.93 | 756 | 741 | 152.7 |
| A | 1 | 162 | 66943 | 433.45 | 756 | 741 | 152.7 |
| A | 13 | 251 | 40943 | 263.22 | 756 | 741 | 152.7 |
| B | 3 | 64 | 1184943 | 8626.02 | 726 | 708 | 137.3 |
| B | 4 | 239 | 428307 | 3114.65 | 726 | 708 | 137.3 |
| B | 15 | 204 | 252098 | 1831.14 | 726 | 708 | 137.3 |
| C | 7 | 238 | 111039 | 648.28 | 737 | 741 | 170.1 |
| C | 13 | 61 | 5400 | 27.38 | 737 | 741 | 170.1 |
| C | 12 | 4 | 3509 | 16.27 | 737 | 741 | 170.1 |
| D | 1 | 52 | 788493 | 4538.34 | 721 | 702 | 173.6 |
| D | 8 | 195 | 219745 | 1261.87 | 721 | 702 | 173.6 |
| D | 13 | 104 | 92784 | 530.47 | 721 | 702 | 173.6 |
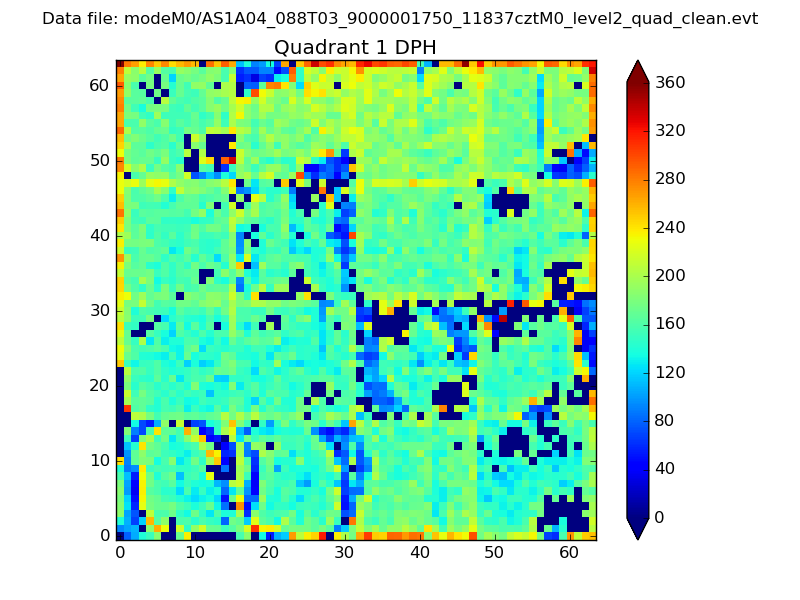
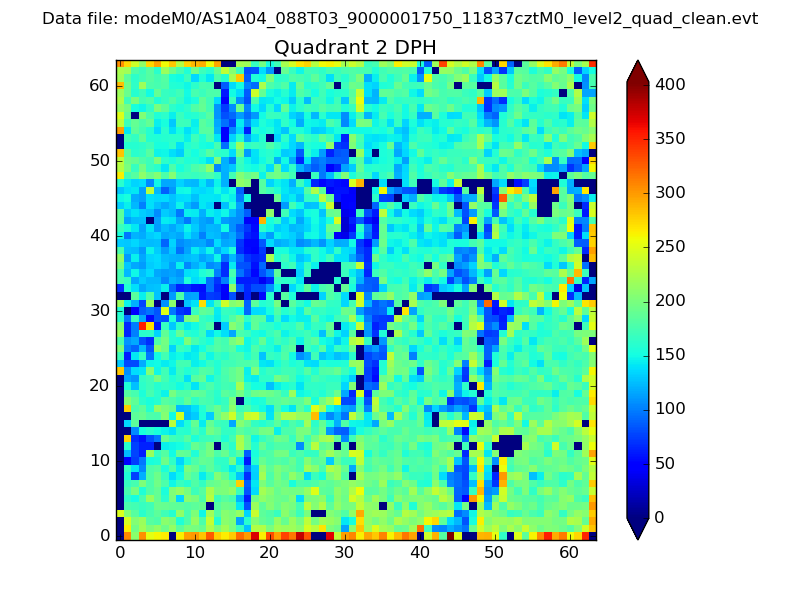
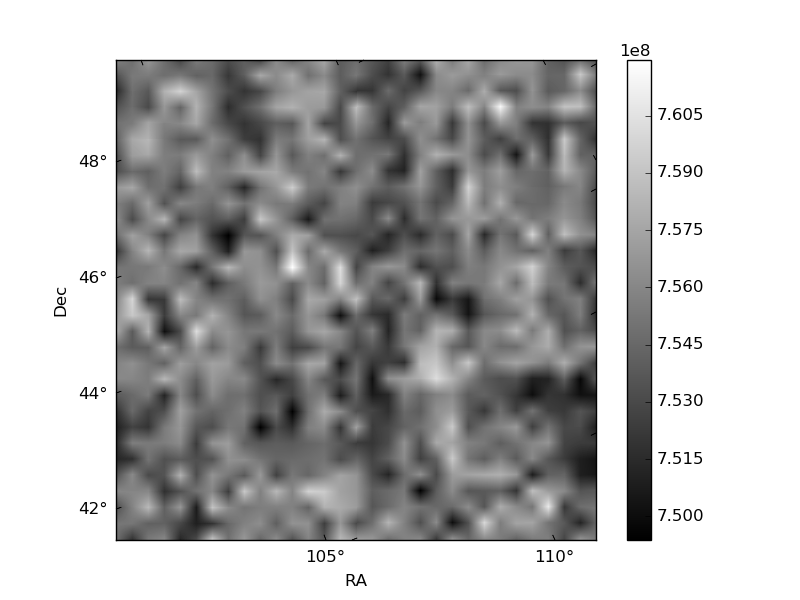
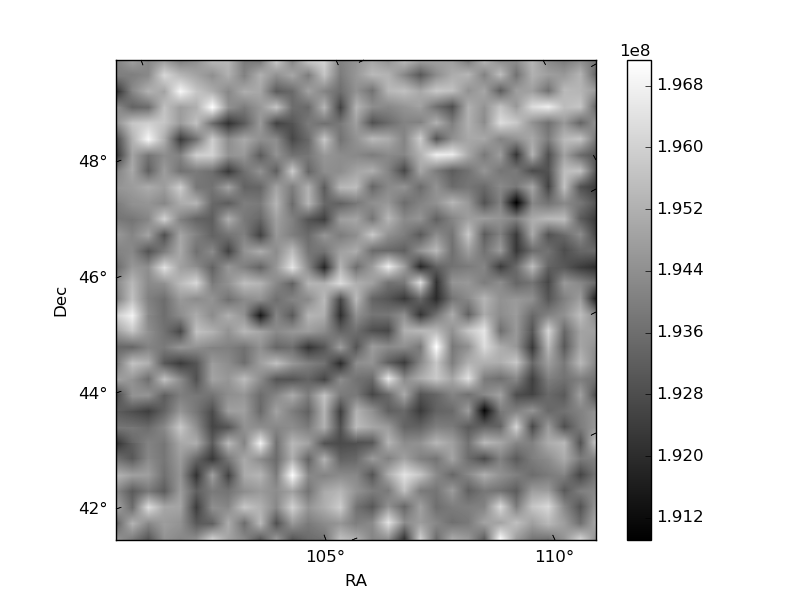
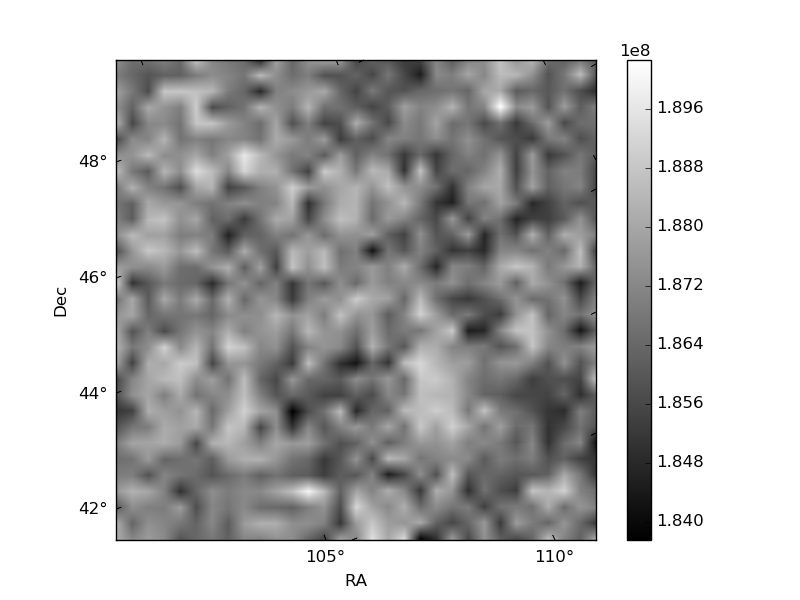
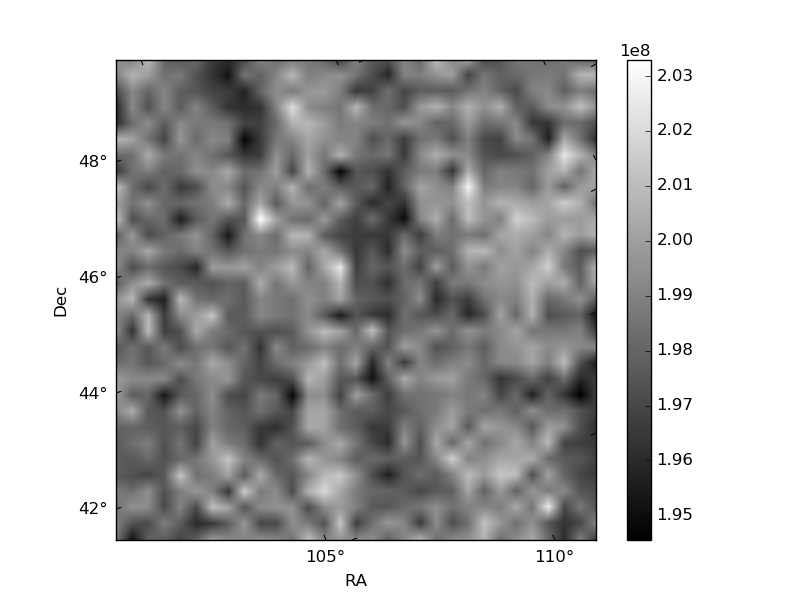
Histogram calculated using DETX and DETY for each event in the final _common_clean file
| Quadrant A | 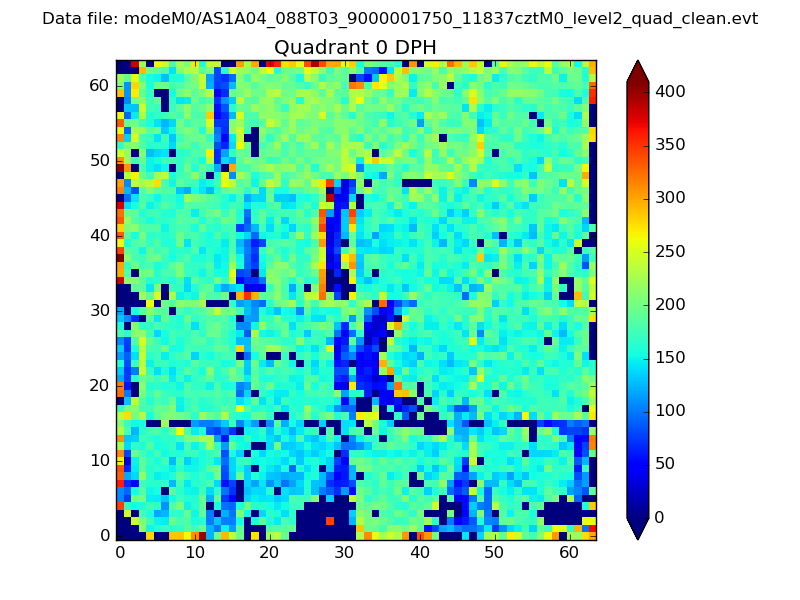 |
 |
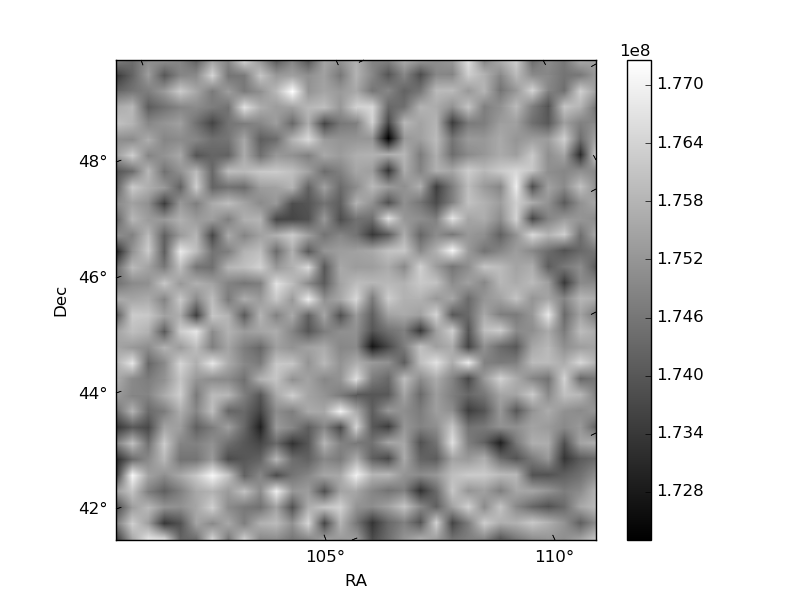
Quadrant B |
|---|---|---|---|
| Quadrant D | 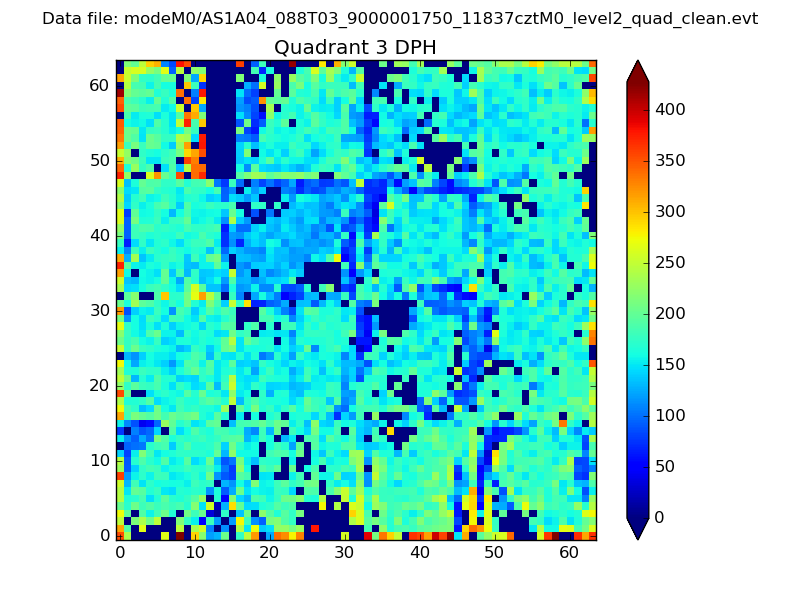 |
 |
Quadrant C |
| Plot type | Count rate plots | Images |
|---|---|---|
| Comparison with Poisson distribution Blue bars denote a histogram of data divided into 1 sec bins. Red curve is a Poisson curve with rate = median count rate of data. |
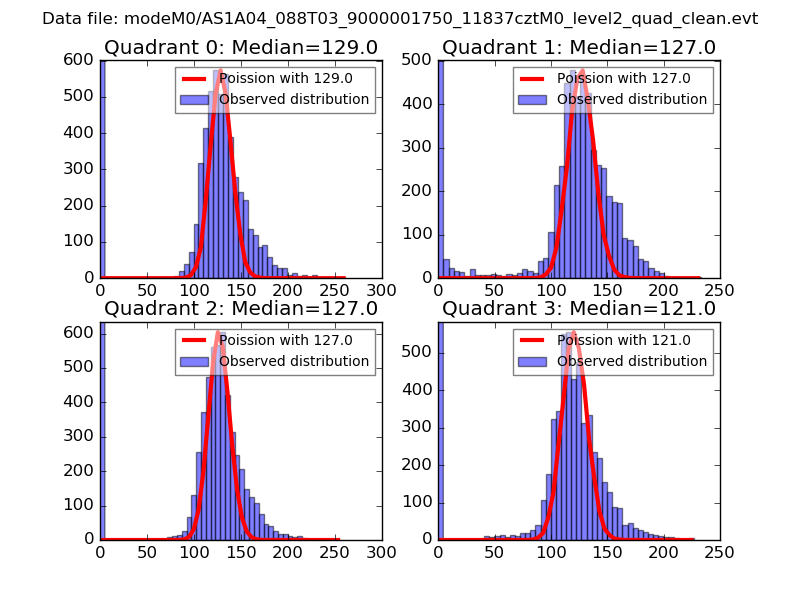 |
 |
| Quadrant-wise count rates Data is divided into 100 sec bins |
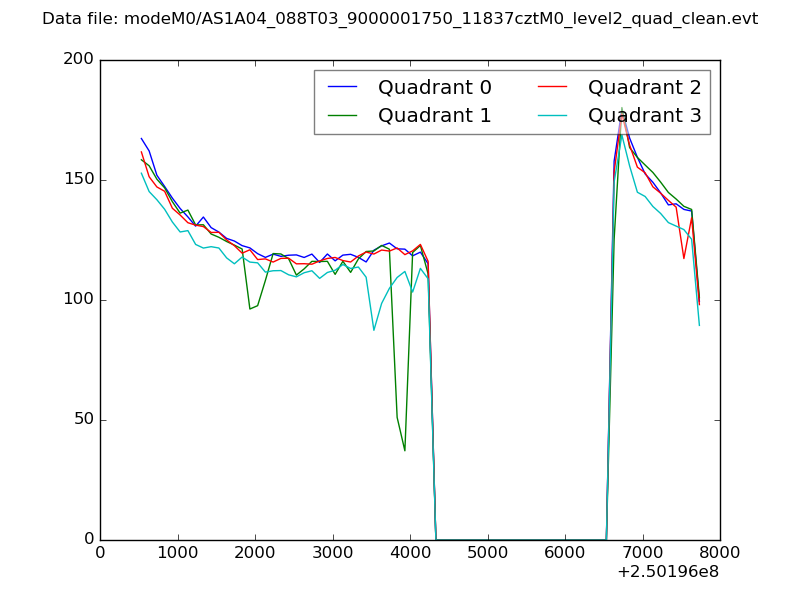 |
|
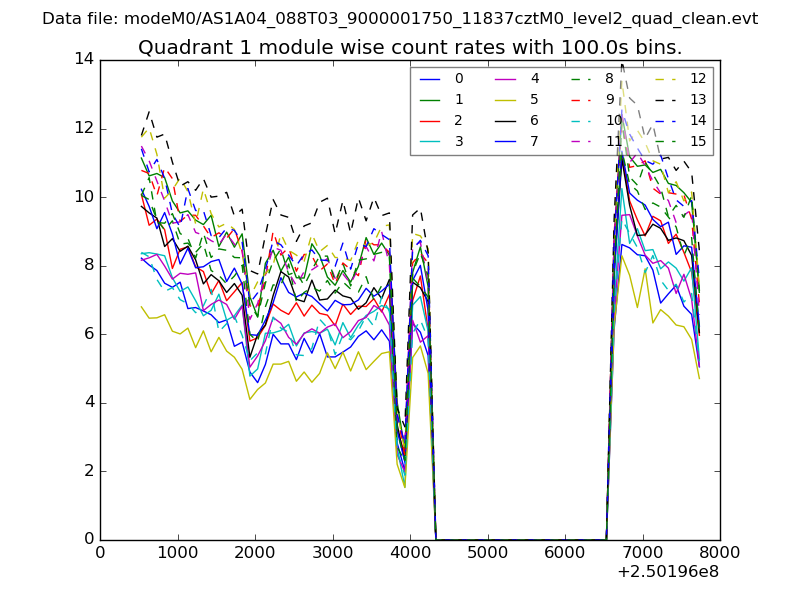
| Module-wise count rates for Quadrant A Data is divided into 100 sec bins |
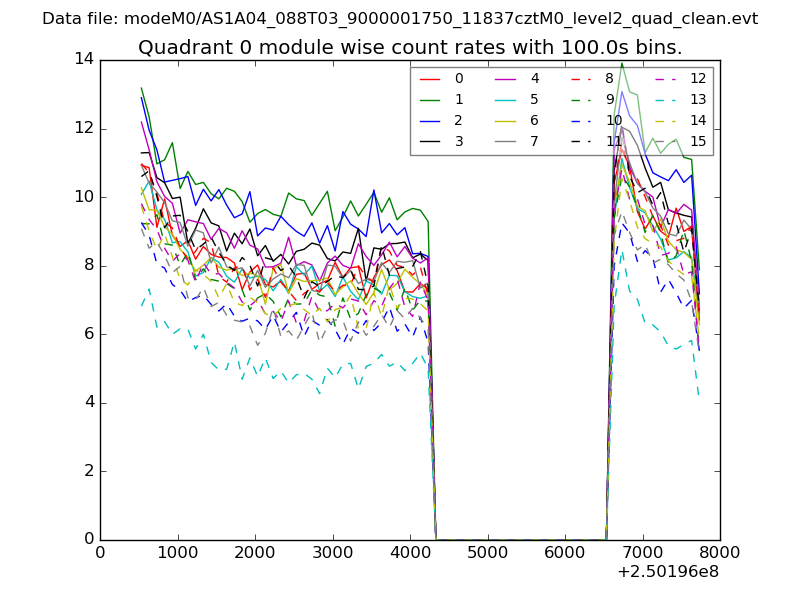 |
 |
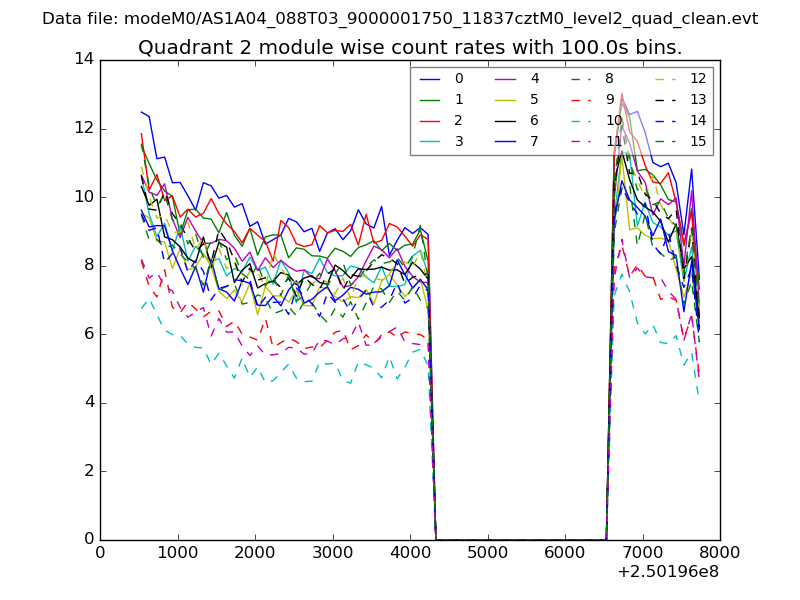
| Module-wise count rates for Quadrant B Data is divided into 100 sec bins |
 |
 |
| Module-wise count rates for Quadrant C Data is divided into 100 sec bins |
 |
 |
| Module-wise count rates for Quadrant D Data is divided into 100 sec bins |
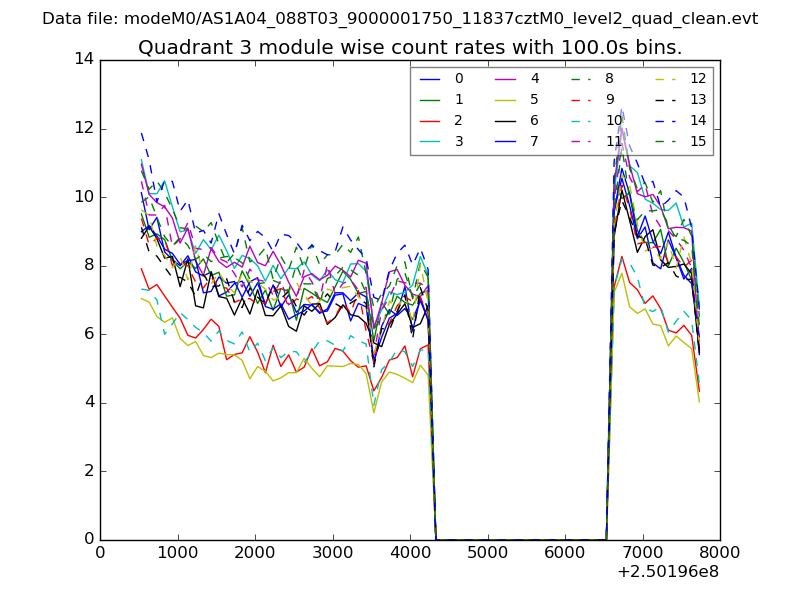 |
 |
| Parameter | Plot |
|---|---|
| CZT HV Monitor | 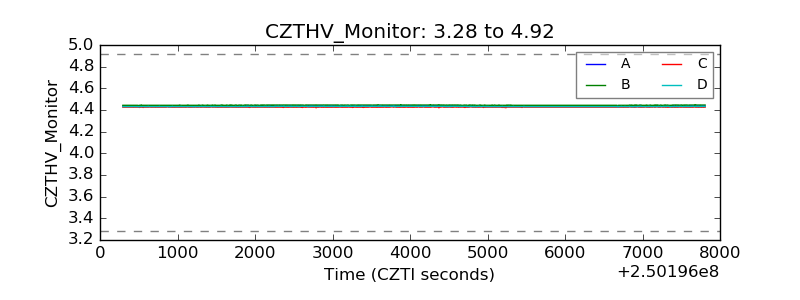 |
| D_VDD | 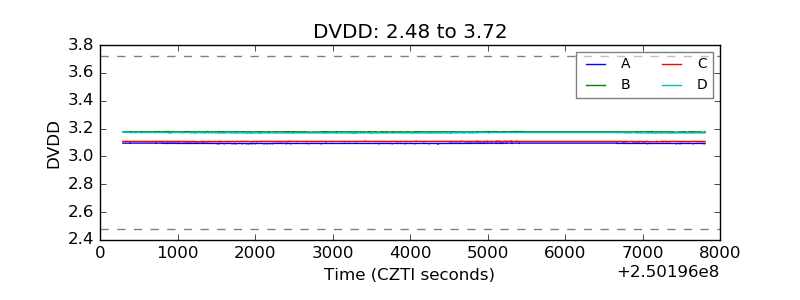 |
| Temperature 1 | 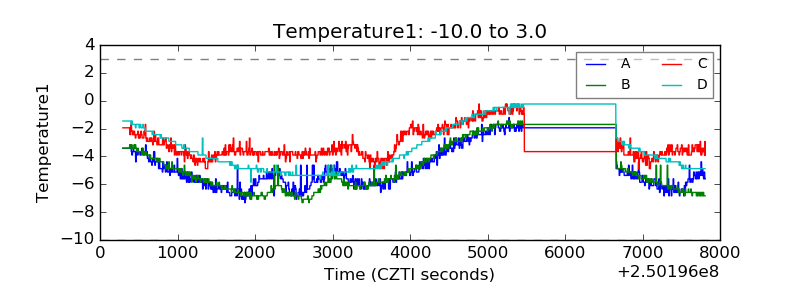 |
| Veto HV Monitor | 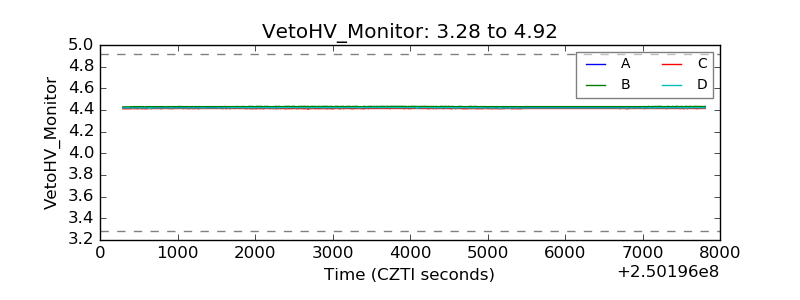 |
| Veto LLD |  |
| Alpha Counter | 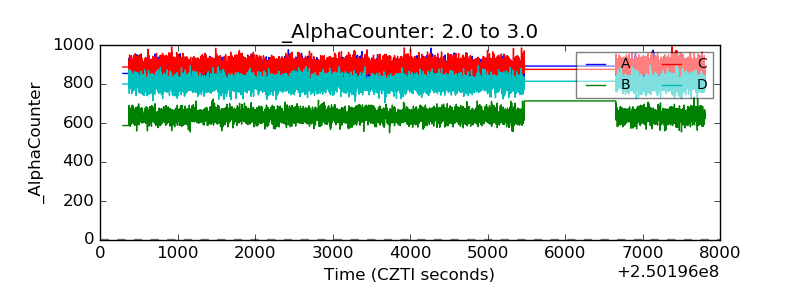 |
| _CPM_Rate | 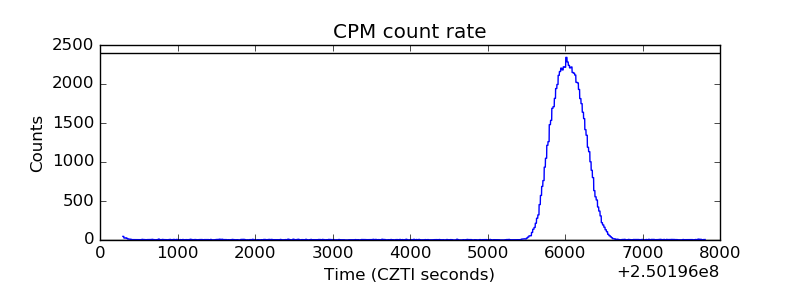 |
| CZT Counter | 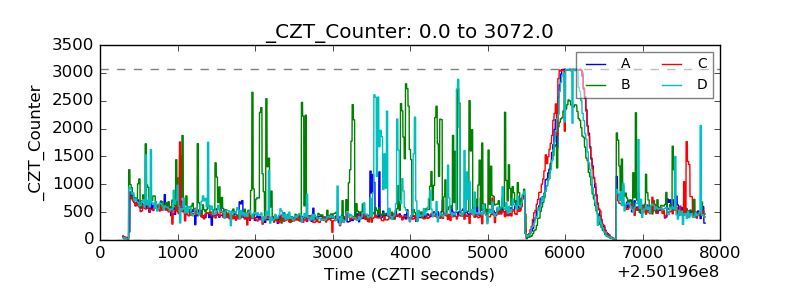 |
| +2.5 Volts monitor |  |
| +5 Volts monitor |  |
| _ROLL_ROT | 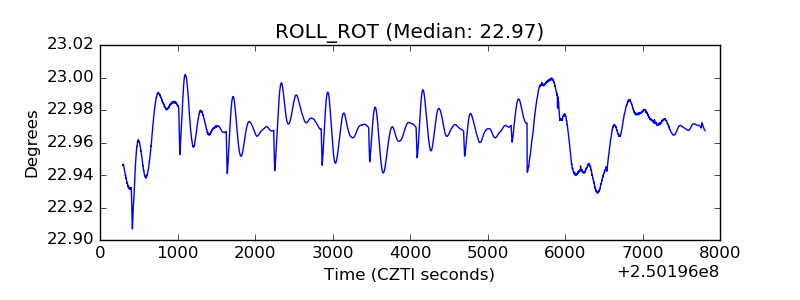 |
| _Roll_DEC | 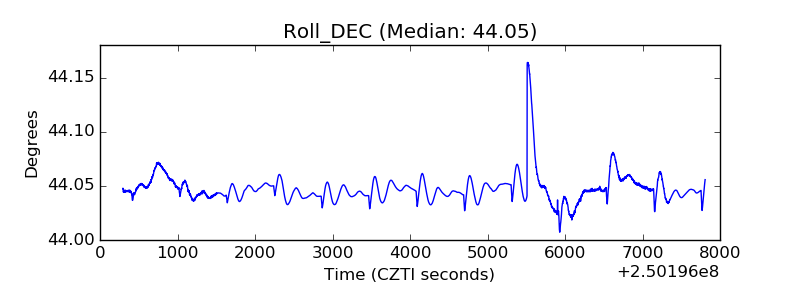 |
| _Roll_RA | 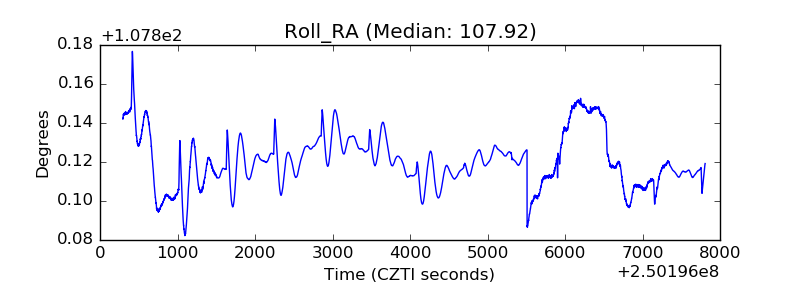 |
| Veto Counter | 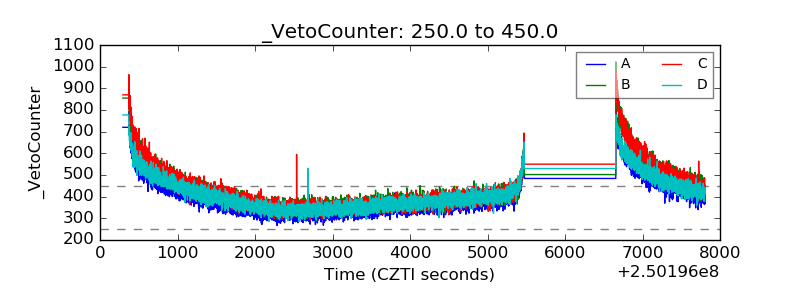 |