| Param | Original file | Final file |
|---|---|---|
| Filename | modeM0/AS1A04_088T03_9000001750_11838cztM0_level2.evt | modeM0/AS1A04_088T03_9000001750_11838cztM0_level2_quad_clean.evt |
| Size (bytes) | 541,742,400 | 100,238,400 |
| Size | 516.6 MB | 95.6 MB |
| Events in quadrant A | 3,361,794 | 666,036 |
| Events in quadrant B | 5,683,590 | 630,330 |
| Events in quadrant C | 3,216,007 | 651,686 |
| Events in quadrant D | 3,693,386 | 622,988 |
| Mode SS | |||
|---|---|---|---|
| Quadrant | BADHDUFLAG | Total packets | Discarded packets |
| A | 0 | 136 | 0 |
| B | 0 | 136 | 0 |
| C | 0 | 136 | 0 |
| D | 0 | 136 | 0 |
| Mode M0 | |||
|---|---|---|---|
| Quadrant | BADHDUFLAG | Total packets | Discarded packets |
| A | 0 | 14388 | 3 |
| B | 0 | 21404 | 2 |
| C | 0 | 14195 | 2 |
| D | 0 | 15553 | 2 |
| Mode M9 | |||
|---|---|---|---|
| Quadrant | BADHDUFLAG | Total packets | Discarded packets |
| A | 0 | 25 | 0 |
| B | 0 | 25 | 0 |
| C | 0 | 25 | 0 |
| D | 0 | 25 | 0 |
| Quadrant | Total seconds | Saturated seconds | Saturation percentage |
|---|---|---|---|
| A | 6666 | 24 | 0.360036% |
| B | 6666 | 781 | 11.716172% |
| C | 6666 | 71 | 1.065107% |
| D | 6666 | 93 | 1.395140% |
Noise dominated data is calculated using 1-second bins in cleaned event files. If a bin has >2000 counts, and if more than 50% of those come from <1% of pixels, then it is considered to be noise-dominated and hence unusable.
| Quadrant | # 1 sec bins | Bins with >0 counts | Bins with >2000 counts | High rate bins dominated by noise | Noise dominated (total time) | Noise dominated (detector-on time) | Marked lightcurve |
|---|---|---|---|---|---|---|---|
| A | 9142 | 6669 | 1 | 1 | 0.01% | 0.01% | 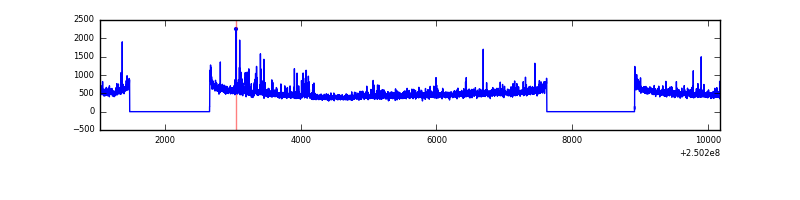 |
| B | 9142 | 6669 | 578 | 578 | 6.32% | 8.67% | 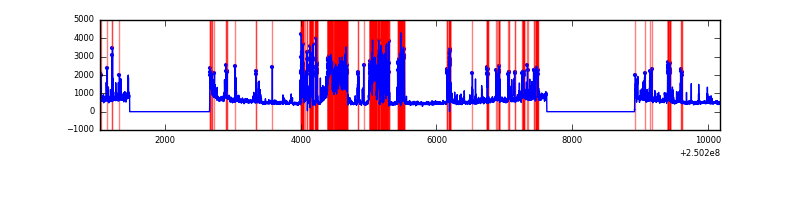 |
| C | 9142 | 6669 | 13 | 13 | 0.14% | 0.19% | 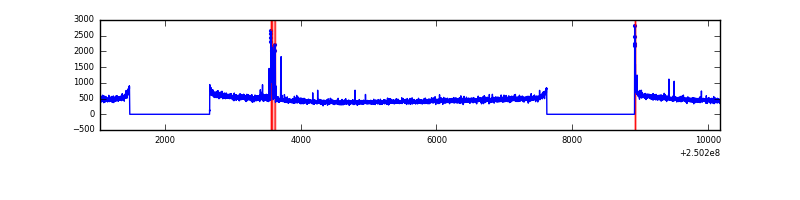 |
| D | 9142 | 6669 | 51 | 51 | 0.56% | 0.76% | 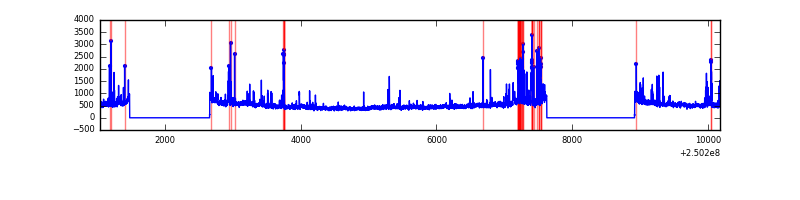 |
Top three noisy pixels from each quadrant. If the there are fewer than three noisy pixels in the level2.evt file, extra rows are filled as -1
| Pixel properties | Quadrant properties | ||||||
|---|---|---|---|---|---|---|---|
| Quadrant | DetID | PixID | Counts | Sigma | Mean | Median | Sigma |
| A | 1 | 162 | 70812 | 424.17 | 817 | 800 | 165.1 |
| A | 13 | 251 | 54672 | 326.39 | 817 | 800 | 165.1 |
| A | 1 | 178 | 33286 | 196.82 | 817 | 800 | 165.1 |
| B | 3 | 64 | 1649368 | 11177.56 | 790 | 770 | 147.5 |
| B | 4 | 239 | 549945 | 3723.43 | 790 | 770 | 147.5 |
| B | 15 | 204 | 304689 | 2060.58 | 790 | 770 | 147.5 |
| C | 7 | 238 | 94246 | 514.73 | 794 | 799 | 181.5 |
| C | 0 | 10 | 20897 | 110.7 | 794 | 799 | 181.5 |
| C | 13 | 61 | 5990 | 28.59 | 794 | 799 | 181.5 |
| D | 8 | 195 | 280073 | 1395.87 | 776 | 759 | 200.1 |
| D | 12 | 17 | 137358 | 682.65 | 776 | 759 | 200.1 |
| D | 13 | 249 | 78799 | 390.01 | 776 | 759 | 200.1 |
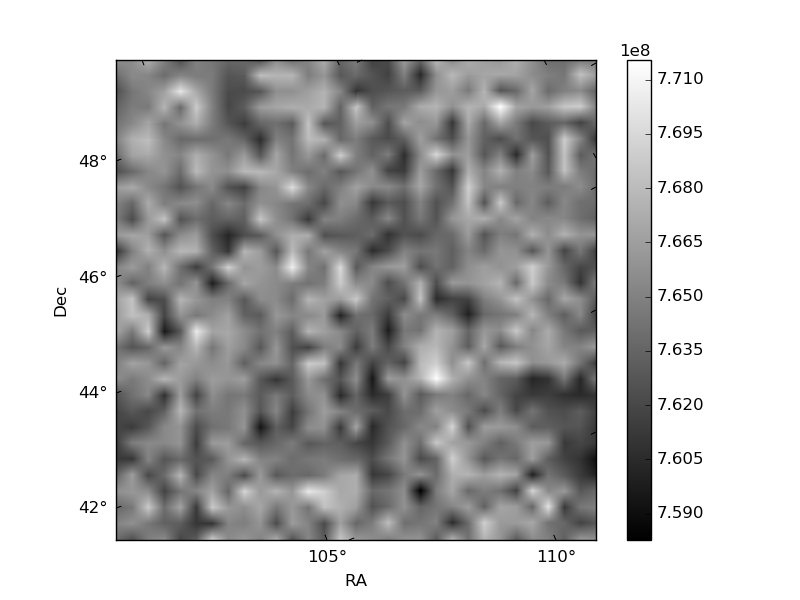
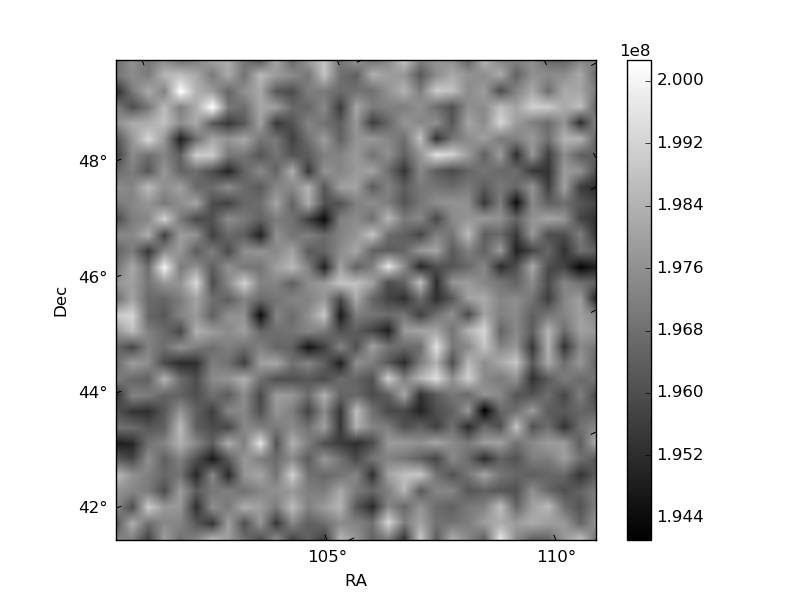
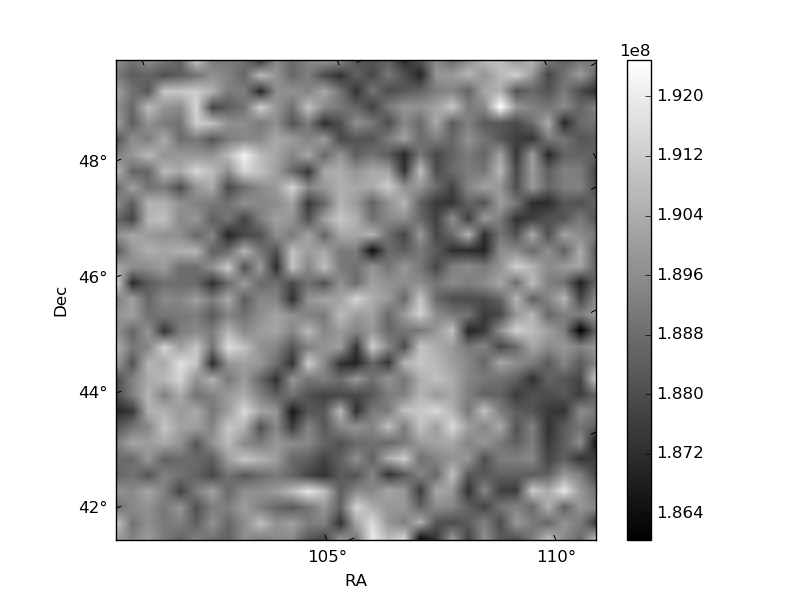
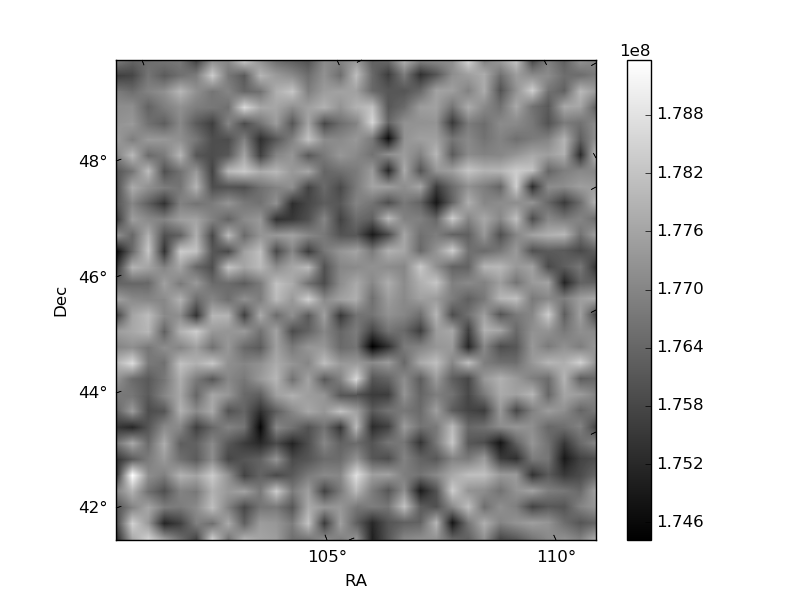
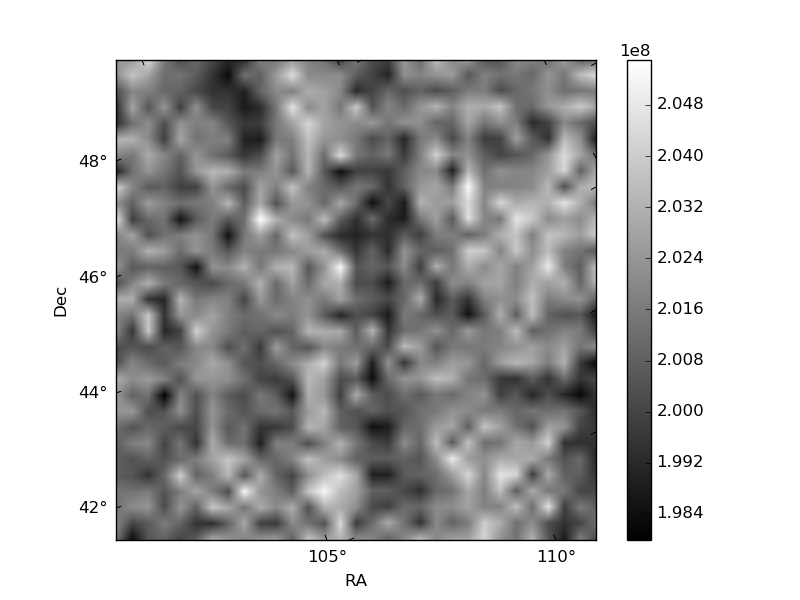
Histogram calculated using DETX and DETY for each event in the final _common_clean file
| Quadrant A | 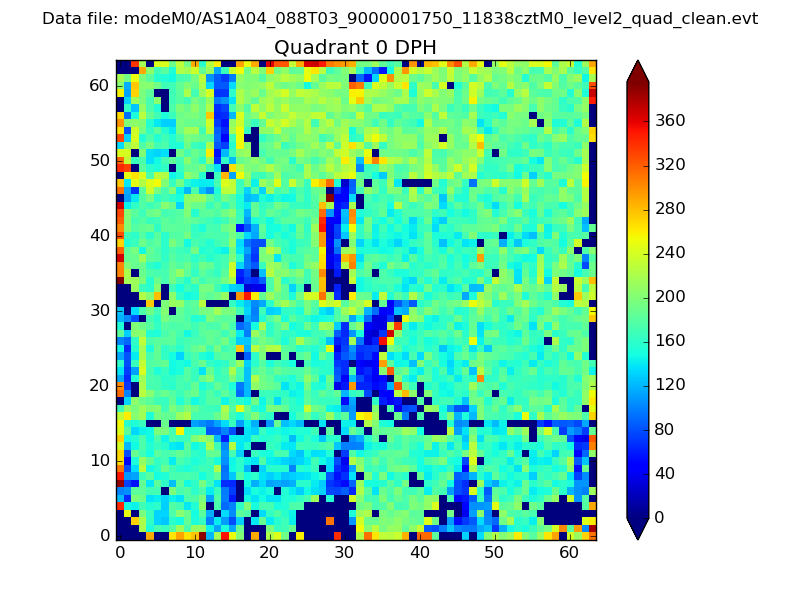 |
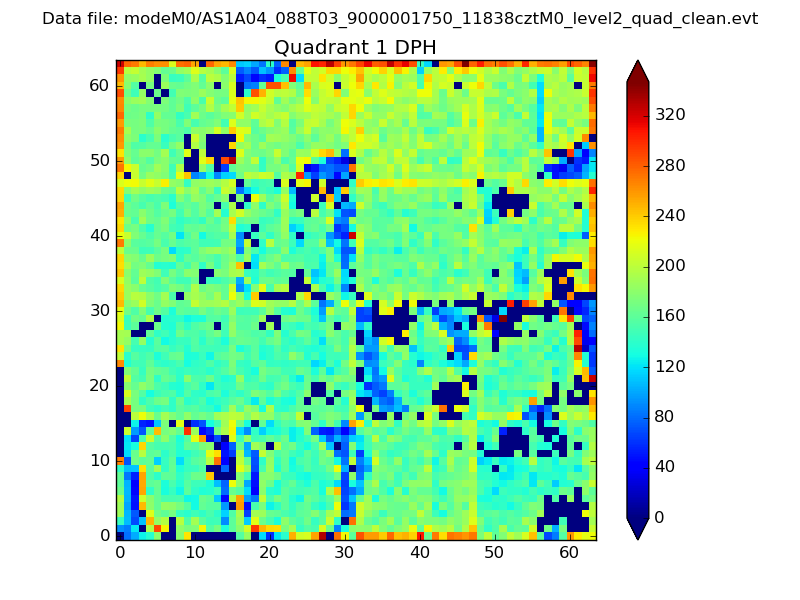 |
Quadrant B |
|---|---|---|---|
| Quadrant D | 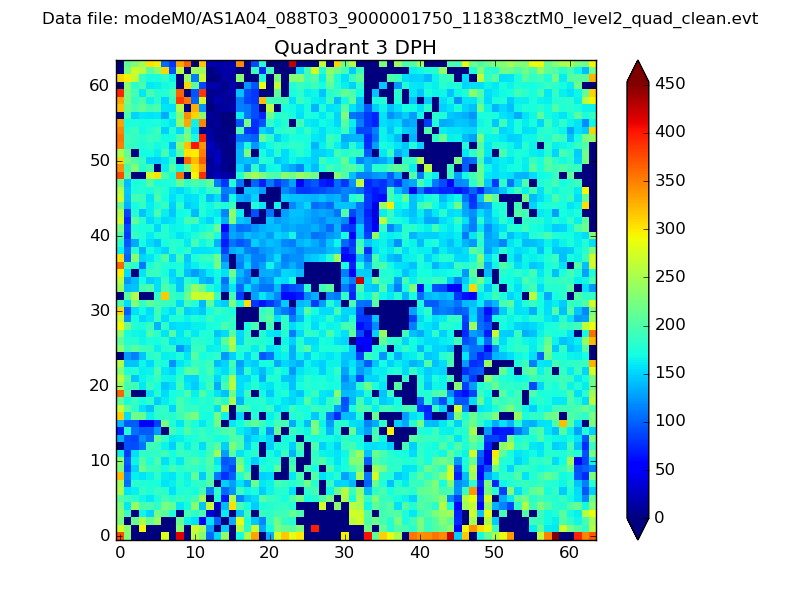 |
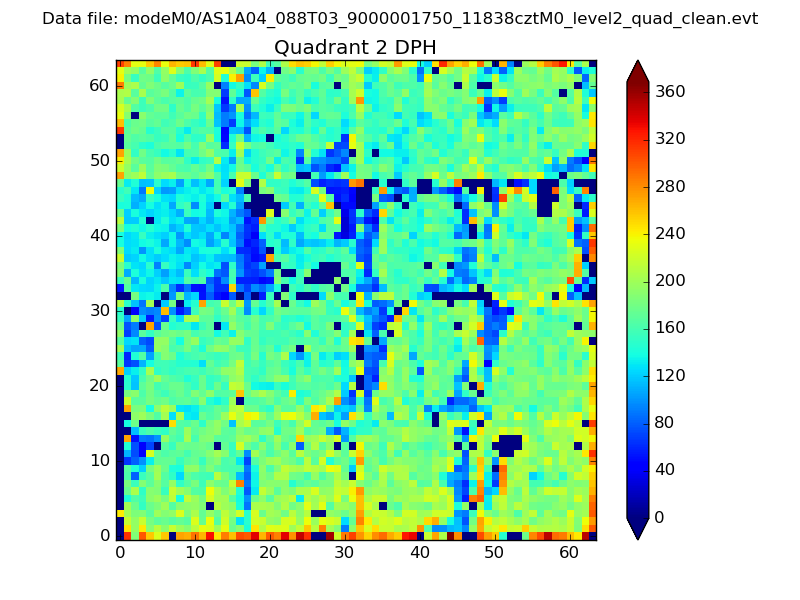 |
Quadrant C |
| Plot type | Count rate plots | Images |
|---|---|---|
| Comparison with Poisson distribution Blue bars denote a histogram of data divided into 1 sec bins. Red curve is a Poisson curve with rate = median count rate of data. |
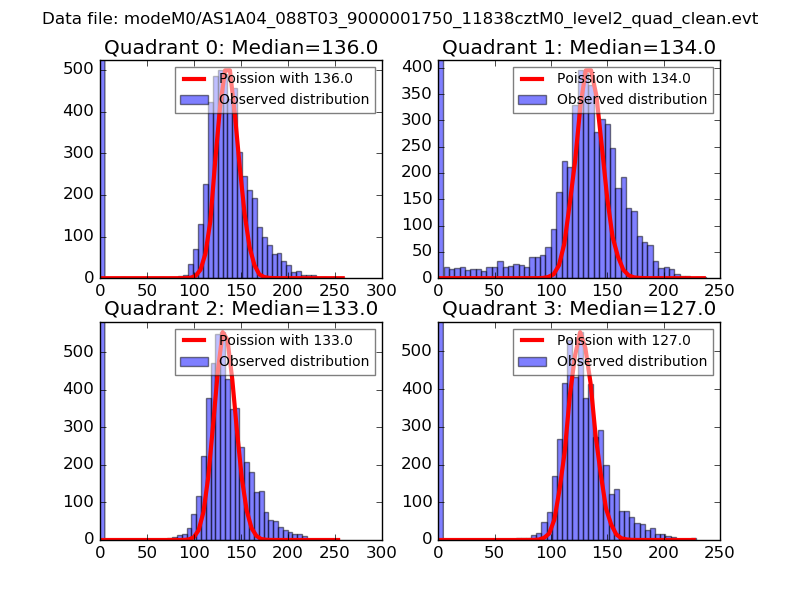 |
 |
| Quadrant-wise count rates Data is divided into 100 sec bins |
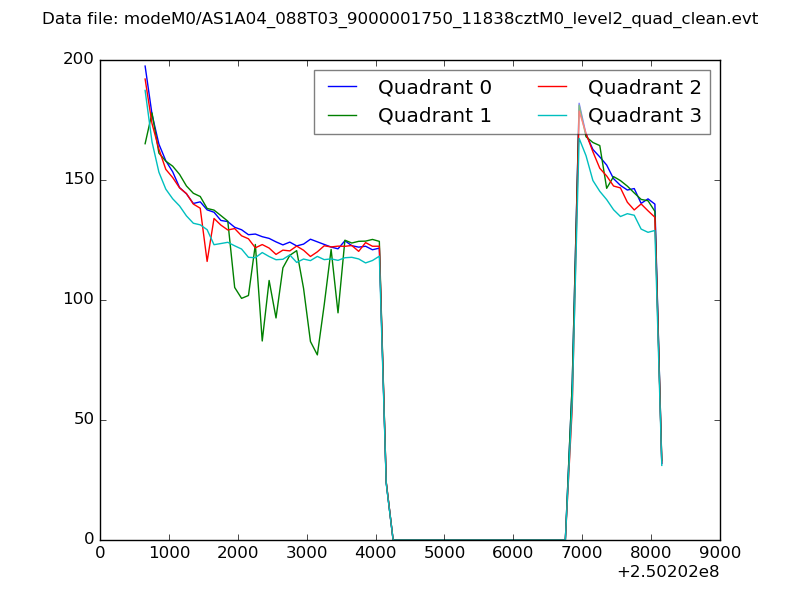 |
|
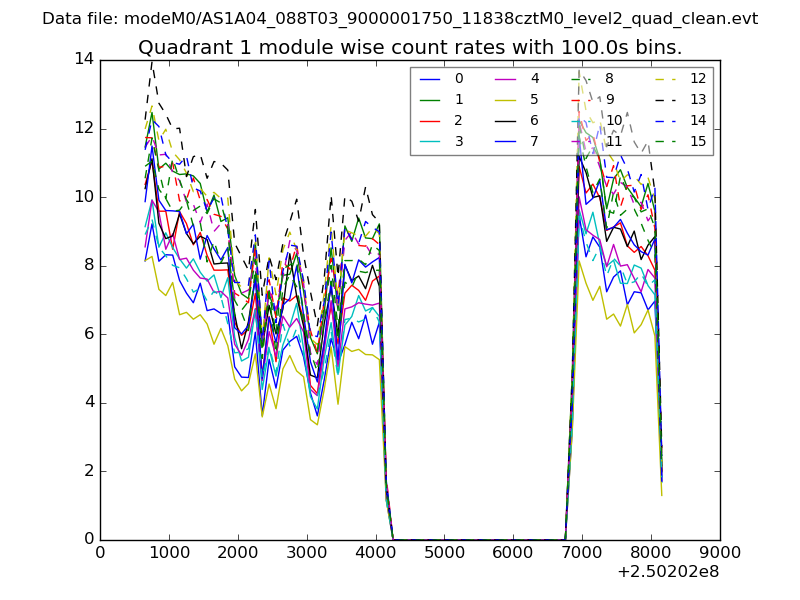
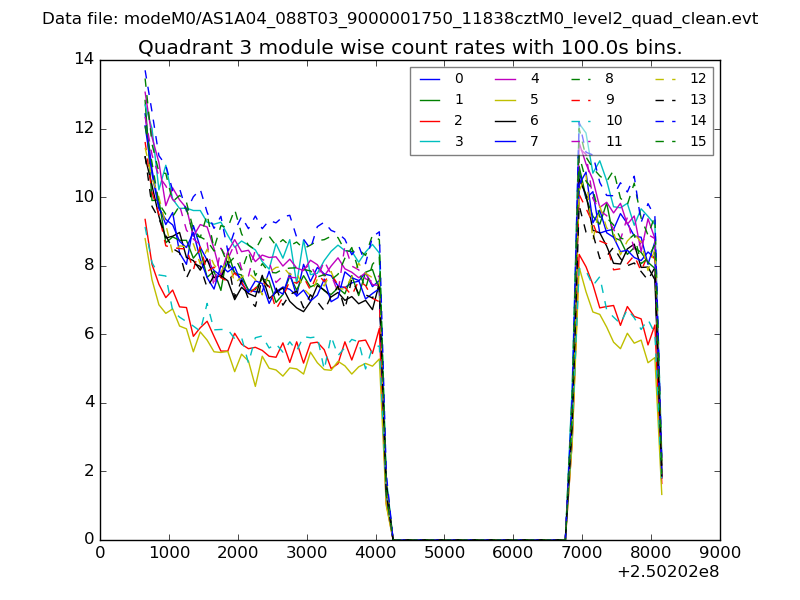
| Module-wise count rates for Quadrant A Data is divided into 100 sec bins |
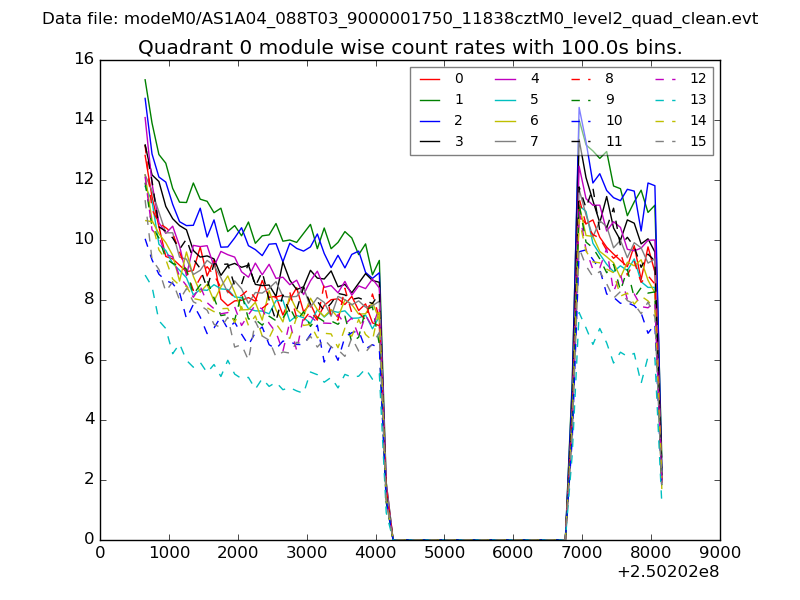 |
 |
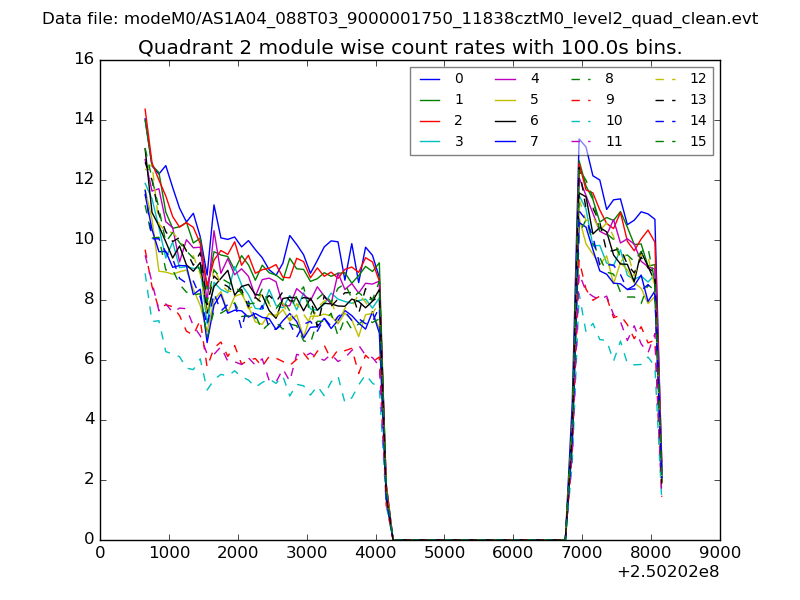
| Module-wise count rates for Quadrant B Data is divided into 100 sec bins |
 |
 |
| Module-wise count rates for Quadrant C Data is divided into 100 sec bins |
 |
 |
| Module-wise count rates for Quadrant D Data is divided into 100 sec bins |
 |
 |
| Parameter | Plot |
|---|---|
| CZT HV Monitor | 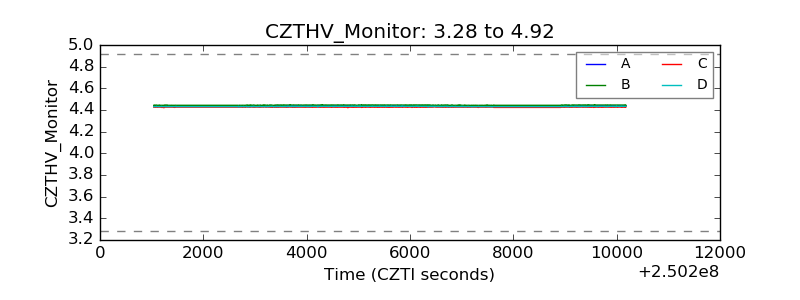 |
| D_VDD | 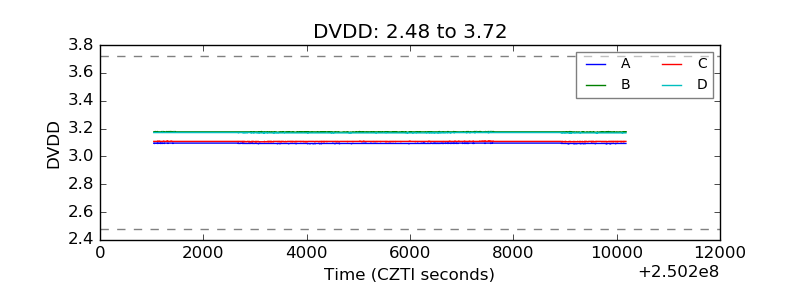 |
| Temperature 1 | 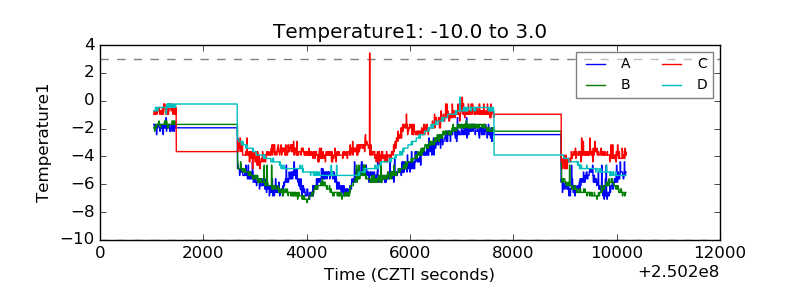 |
| Veto HV Monitor | 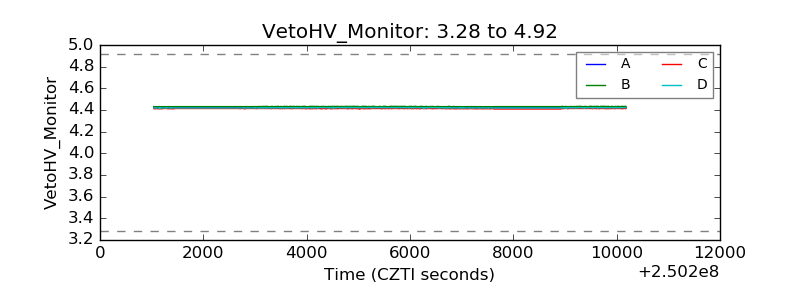 |
| Veto LLD | 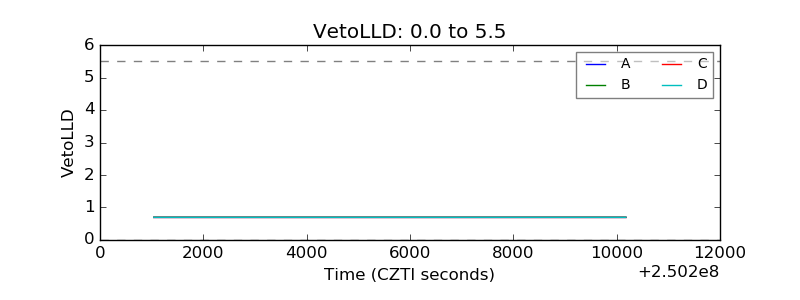 |
| Alpha Counter | 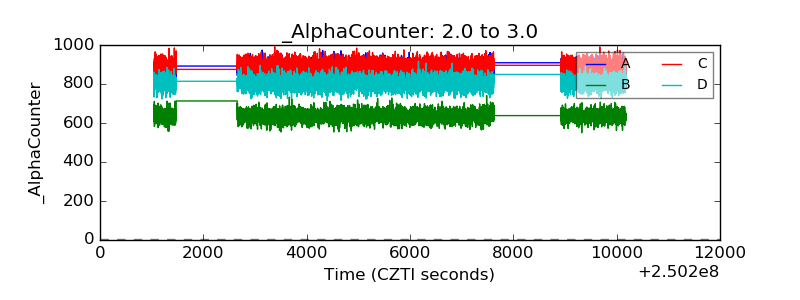 |
| _CPM_Rate | 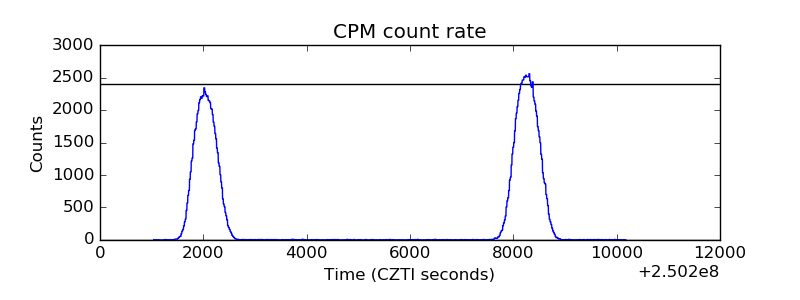 |
| CZT Counter | 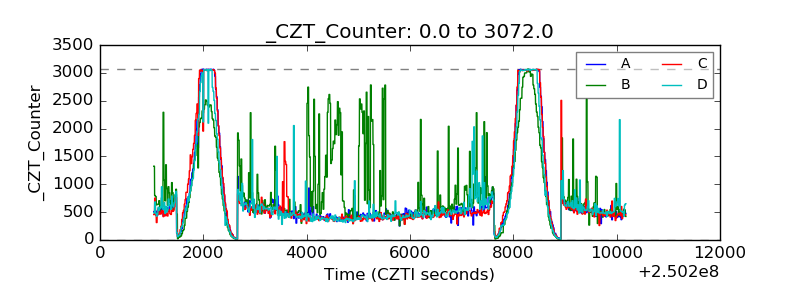 |
| +2.5 Volts monitor |  |
| +5 Volts monitor |  |
| _ROLL_ROT | 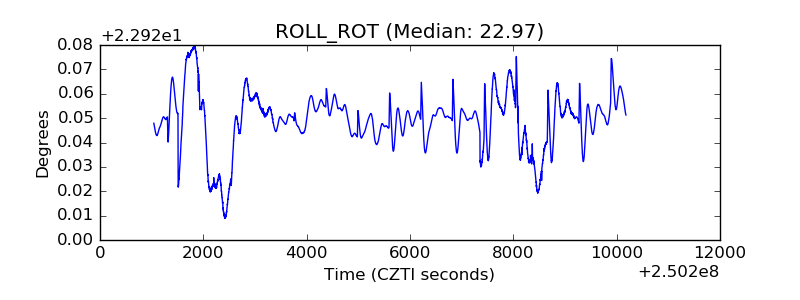 |
| _Roll_DEC | 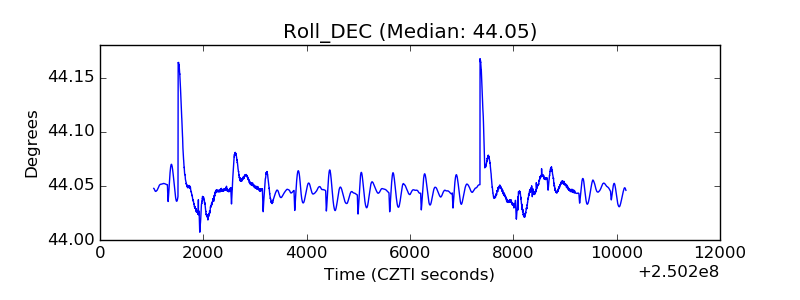 |
| _Roll_RA | 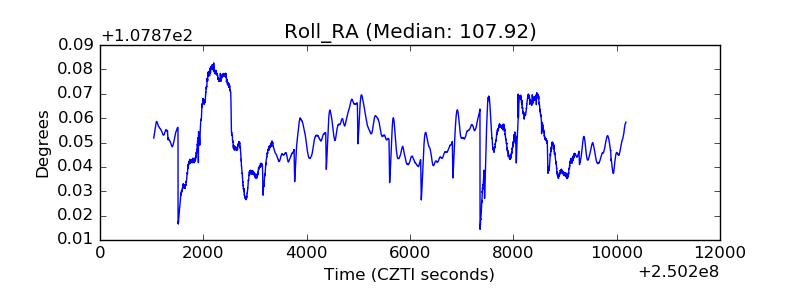 |
| Veto Counter | 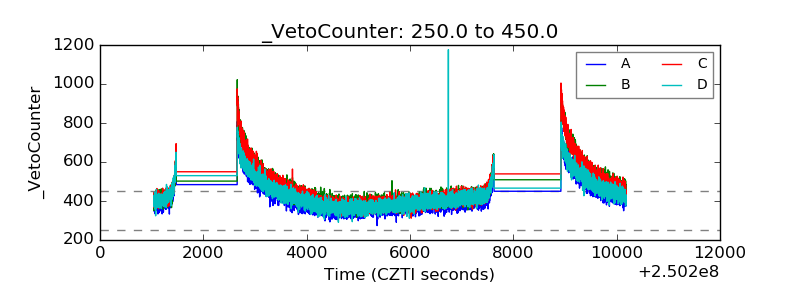 |