| Param | Original file | Final file |
|---|---|---|
| Filename | modeM0/AS1A04_088T03_9000001750_11839cztM0_level2.evt | modeM0/AS1A04_088T03_9000001750_11839cztM0_level2_quad_clean.evt |
| Size (bytes) | 474,163,200 | 91,454,400 |
| Size | 452.2 MB | 87.2 MB |
| Events in quadrant A | 2,972,658 | 601,232 |
| Events in quadrant B | 4,225,815 | 605,945 |
| Events in quadrant C | 2,820,910 | 588,737 |
| Events in quadrant D | 3,932,148 | 553,427 |
| Mode SS | |||
|---|---|---|---|
| Quadrant | BADHDUFLAG | Total packets | Discarded packets |
| A | 0 | 124 | 0 |
| B | 0 | 124 | 0 |
| C | 0 | 124 | 0 |
| D | 0 | 124 | 0 |
| Mode M0 | |||
|---|---|---|---|
| Quadrant | BADHDUFLAG | Total packets | Discarded packets |
| A | 0 | 12703 | 3 |
| B | 0 | 16433 | 2 |
| C | 0 | 12485 | 2 |
| D | 0 | 15601 | 2 |
| Mode M9 | |||
|---|---|---|---|
| Quadrant | BADHDUFLAG | Total packets | Discarded packets |
| A | 0 | 21 | 0 |
| B | 0 | 21 | 0 |
| C | 0 | 21 | 0 |
| D | 0 | 22 | 0 |
| Quadrant | Total seconds | Saturated seconds | Saturation percentage |
|---|---|---|---|
| A | 6011 | 18 | 0.299451% |
| B | 6011 | 489 | 8.135086% |
| C | 6011 | 25 | 0.415904% |
| D | 6011 | 136 | 2.262519% |
Noise dominated data is calculated using 1-second bins in cleaned event files. If a bin has >2000 counts, and if more than 50% of those come from <1% of pixels, then it is considered to be noise-dominated and hence unusable.
| Quadrant | # 1 sec bins | Bins with >0 counts | Bins with >2000 counts | High rate bins dominated by noise | Noise dominated (total time) | Noise dominated (detector-on time) | Marked lightcurve |
|---|---|---|---|---|---|---|---|
| A | 7377 | 6013 | 1 | 1 | 0.01% | 0.02% | 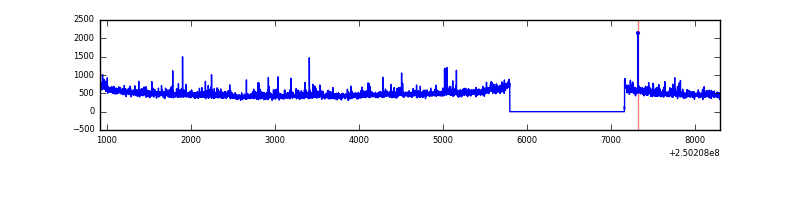 |
| B | 7377 | 6013 | 250 | 250 | 3.39% | 4.16% | 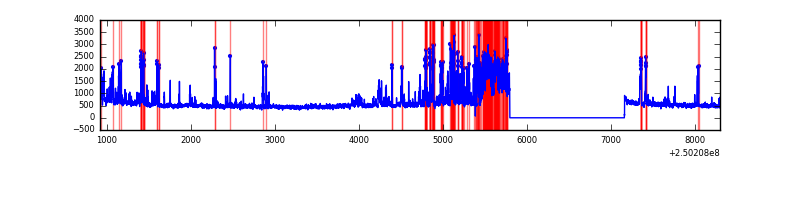 |
| C | 7377 | 6013 | 11 | 11 | 0.15% | 0.18% | 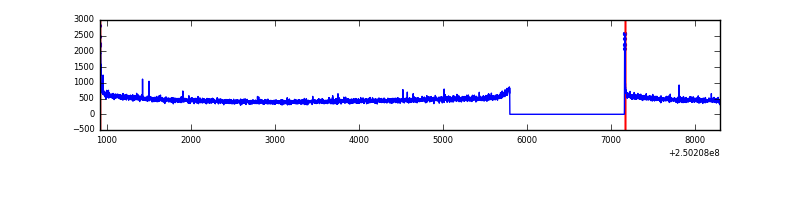 |
| D | 7377 | 6013 | 102 | 102 | 1.38% | 1.70% | 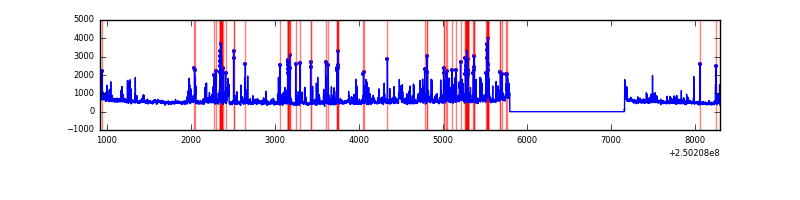 |
Top three noisy pixels from each quadrant. If the there are fewer than three noisy pixels in the level2.evt file, extra rows are filled as -1
| Pixel properties | Quadrant properties | ||||||
|---|---|---|---|---|---|---|---|
| Quadrant | DetID | PixID | Counts | Sigma | Mean | Median | Sigma |
| A | 1 | 162 | 51667 | 346.27 | 734 | 720 | 147.1 |
| A | 1 | 178 | 25750 | 170.12 | 734 | 720 | 147.1 |
| A | 1 | 161 | 22848 | 150.39 | 734 | 720 | 147.1 |
| B | 4 | 239 | 597507 | 4445.6 | 719 | 703 | 134.2 |
| B | 3 | 64 | 548806 | 4082.82 | 719 | 703 | 134.2 |
| B | 15 | 204 | 156729 | 1162.24 | 719 | 703 | 134.2 |
| C | 0 | 10 | 38581 | 234.18 | 712 | 716 | 161.7 |
| C | 13 | 61 | 5380 | 28.85 | 712 | 716 | 161.7 |
| C | 12 | 4 | 3993 | 20.27 | 712 | 716 | 161.7 |
| D | 1 | 52 | 827516 | 4546.15 | 688 | 676 | 181.9 |
| D | 8 | 195 | 321149 | 1762.03 | 688 | 676 | 181.9 |
| D | 12 | 17 | 61343 | 333.56 | 688 | 676 | 181.9 |
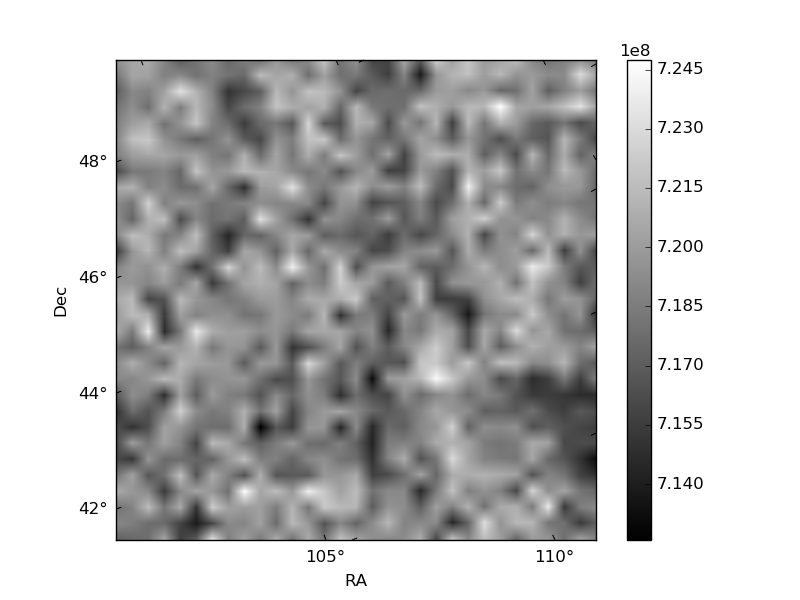
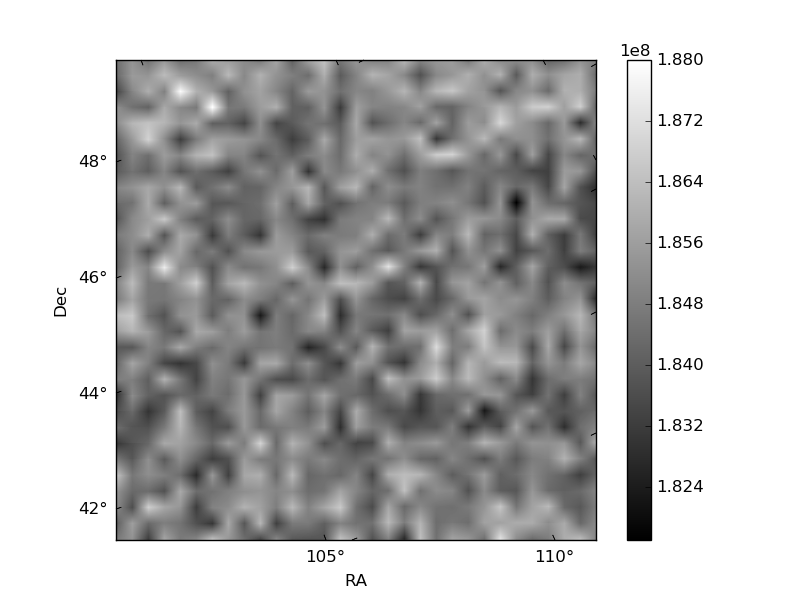
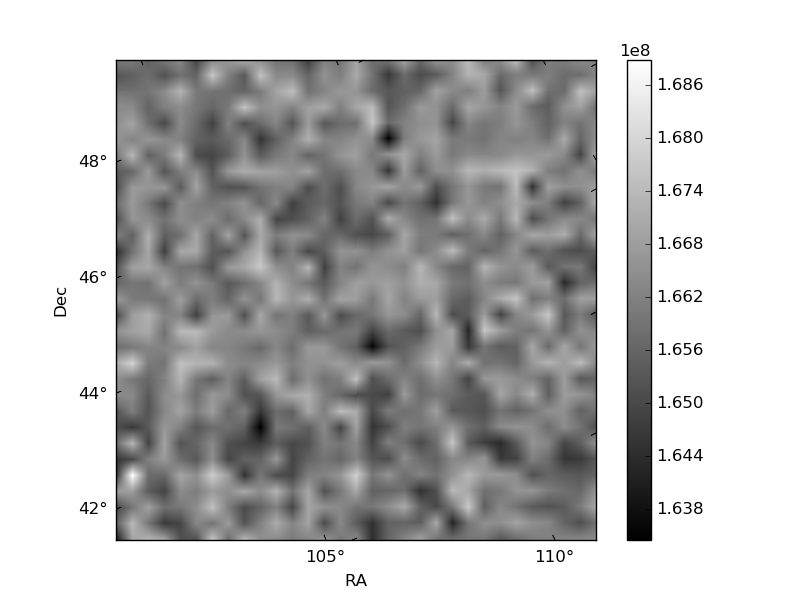
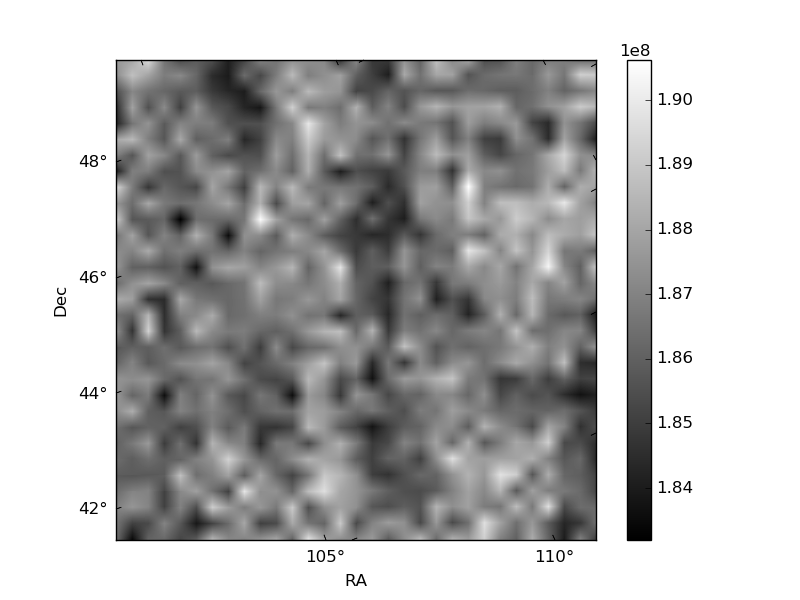
Histogram calculated using DETX and DETY for each event in the final _common_clean file
| Quadrant A | 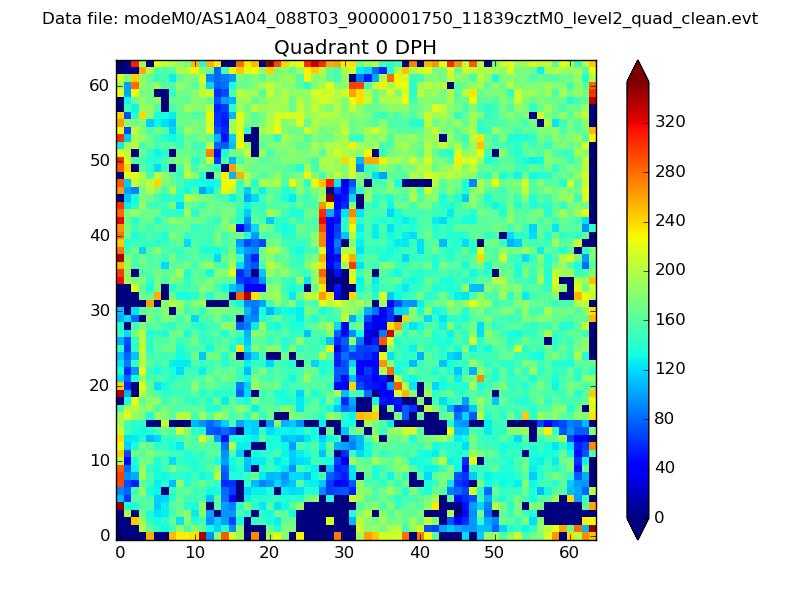 |
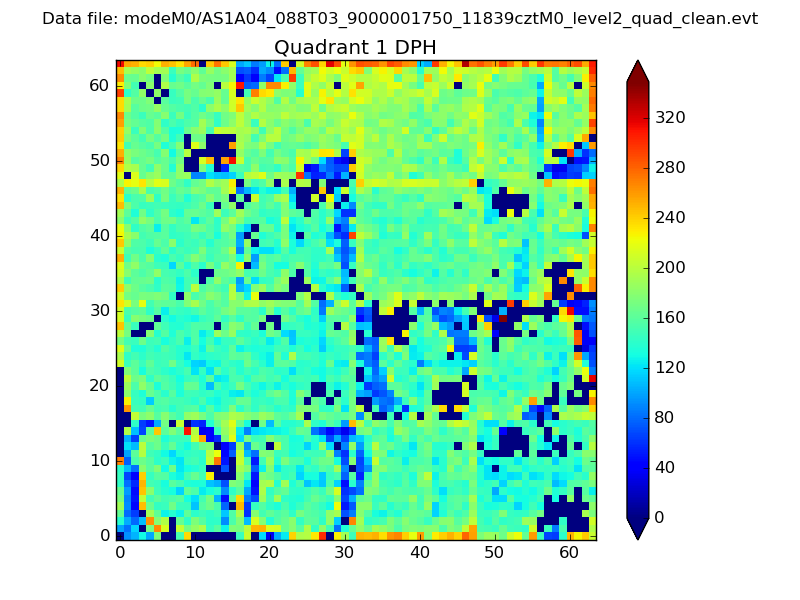 |
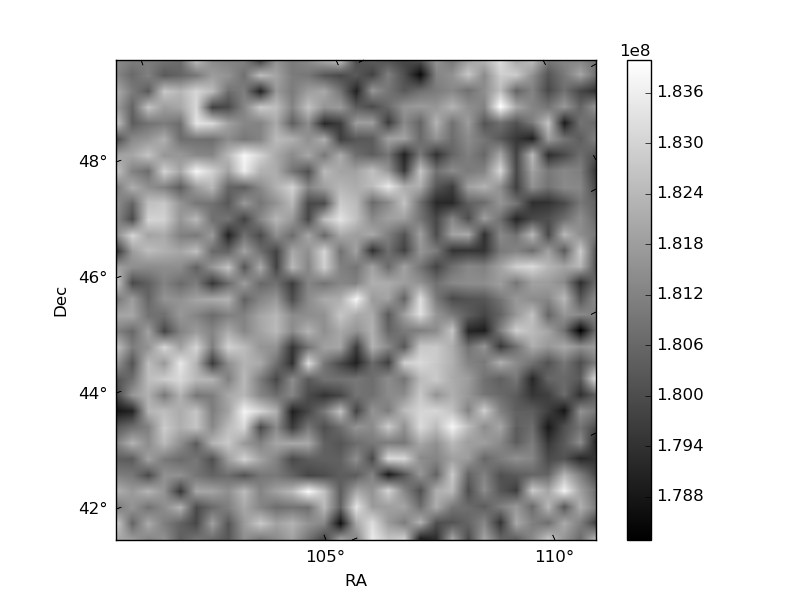
Quadrant B |
|---|---|---|---|
| Quadrant D | 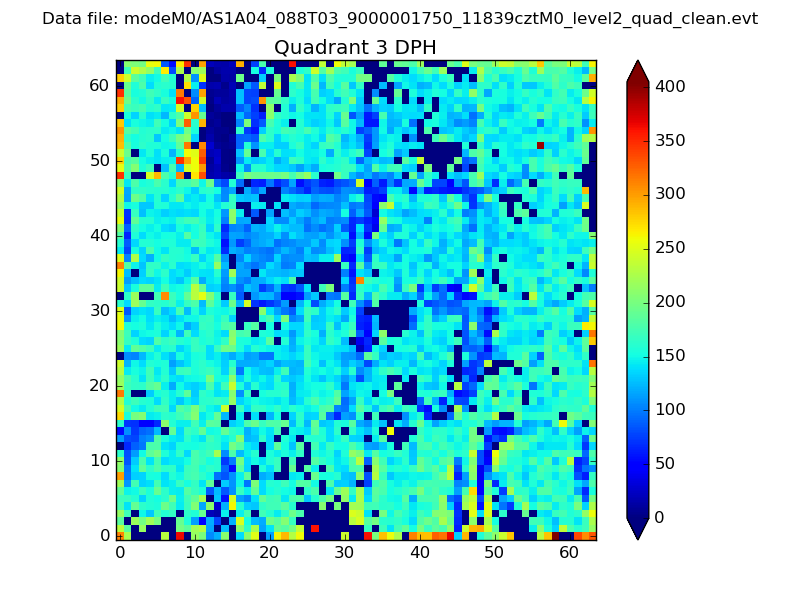 |
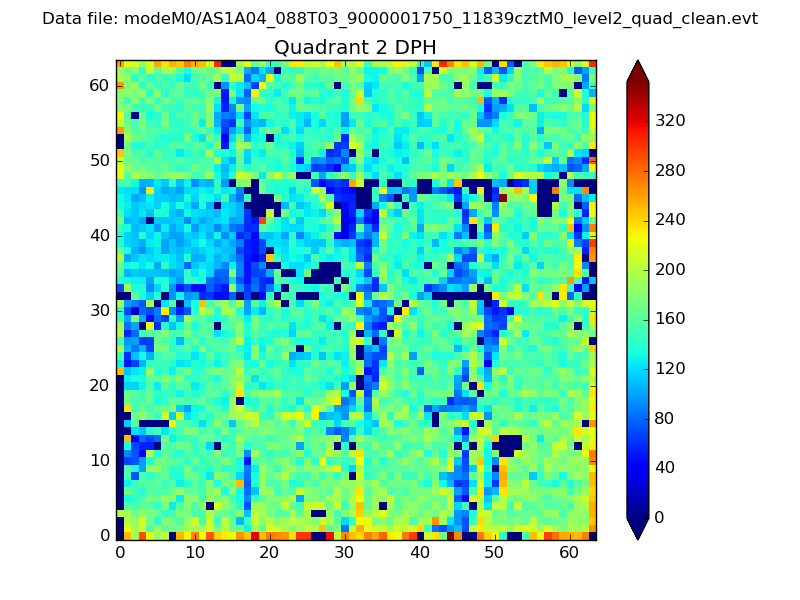 |
Quadrant C |
| Plot type | Count rate plots | Images |
|---|---|---|
| Comparison with Poisson distribution Blue bars denote a histogram of data divided into 1 sec bins. Red curve is a Poisson curve with rate = median count rate of data. |
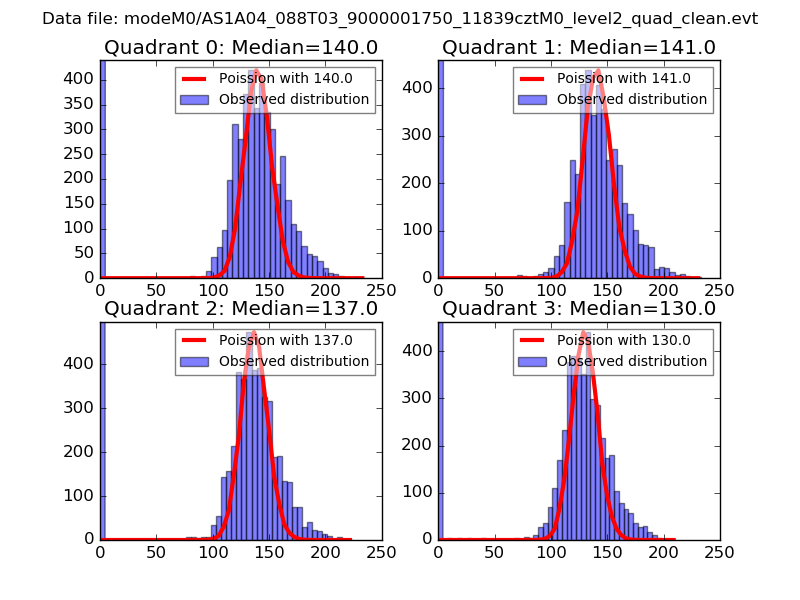 |
 |
| Quadrant-wise count rates Data is divided into 100 sec bins |
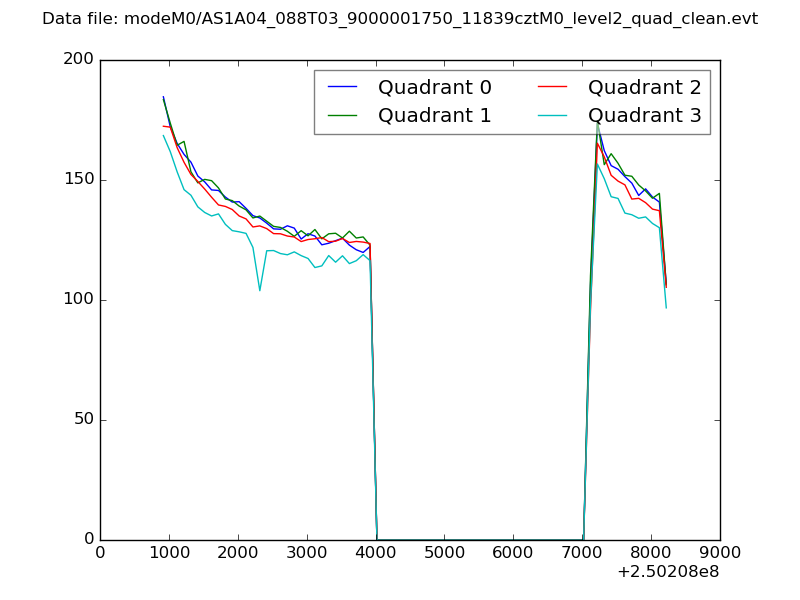 |
|
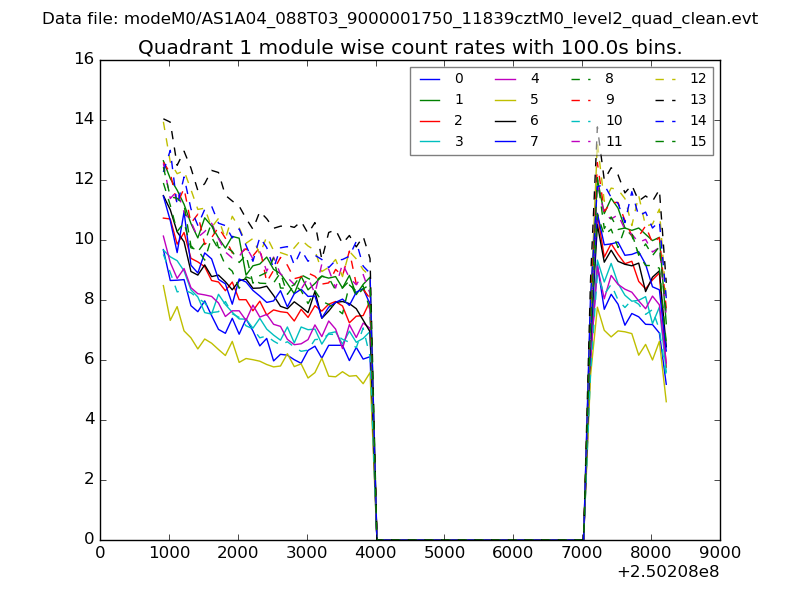
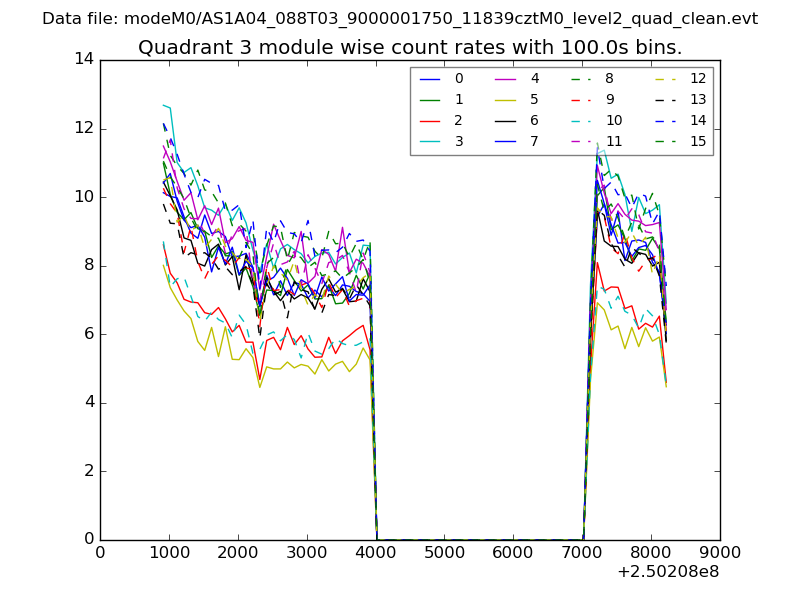
| Module-wise count rates for Quadrant A Data is divided into 100 sec bins |
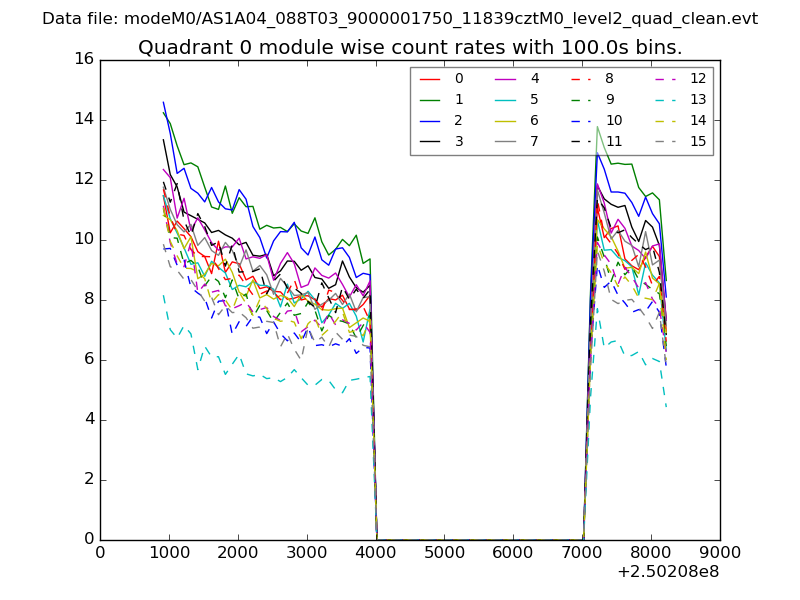 |
 |
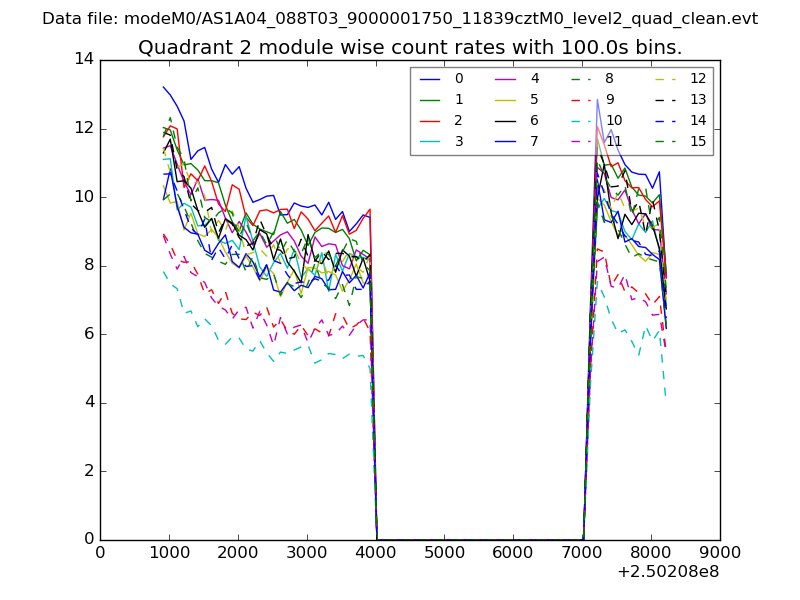
| Module-wise count rates for Quadrant B Data is divided into 100 sec bins |
 |
 |
| Module-wise count rates for Quadrant C Data is divided into 100 sec bins |
 |
 |
| Module-wise count rates for Quadrant D Data is divided into 100 sec bins |
 |
 |
| Parameter | Plot |
|---|---|
| CZT HV Monitor | 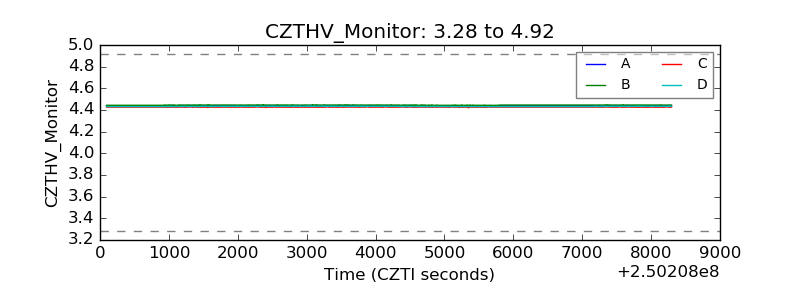 |
| D_VDD | 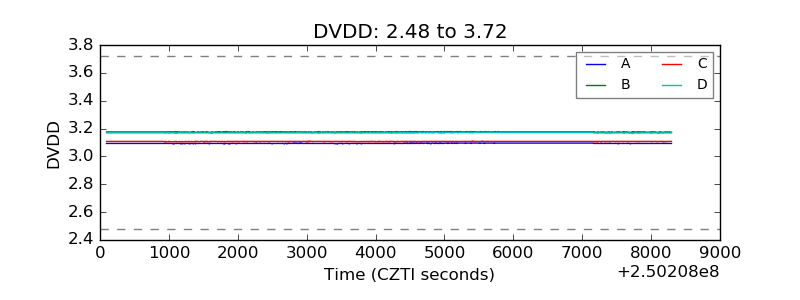 |
| Temperature 1 |  |
| Veto HV Monitor | 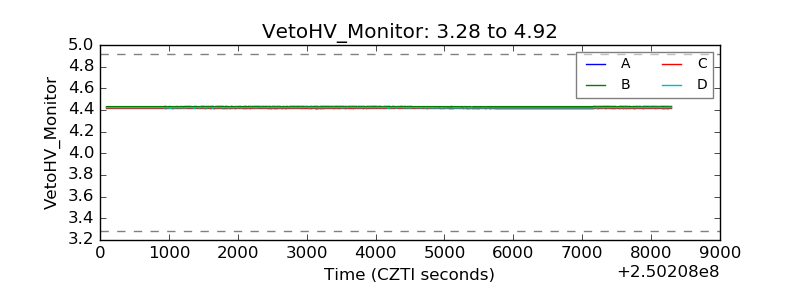 |
| Veto LLD |  |
| Alpha Counter | 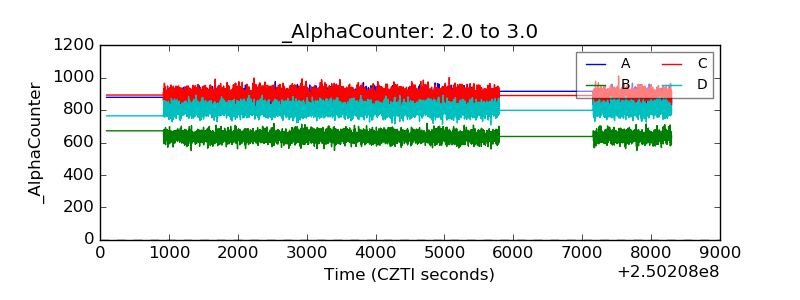 |
| _CPM_Rate | 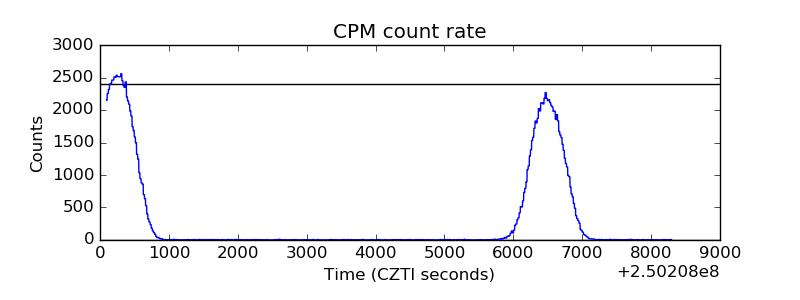 |
| CZT Counter | 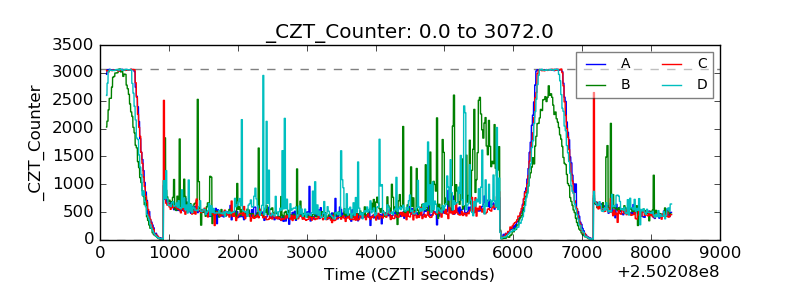 |
| +2.5 Volts monitor |  |
| +5 Volts monitor |  |
| _ROLL_ROT | 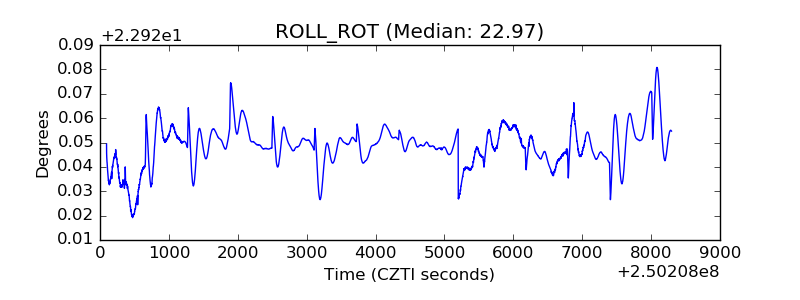 |
| _Roll_DEC | 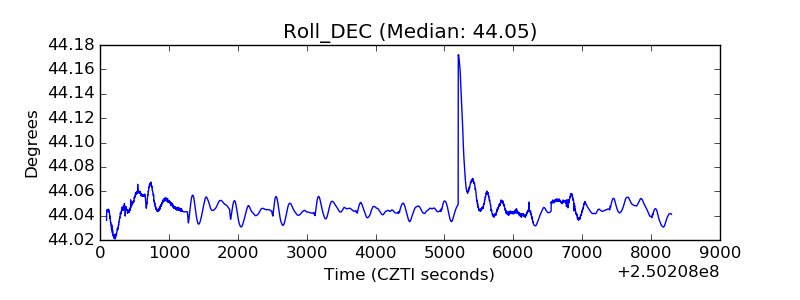 |
| _Roll_RA | 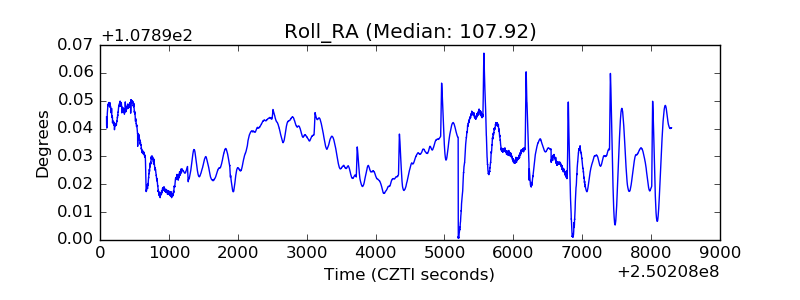 |
| Veto Counter | 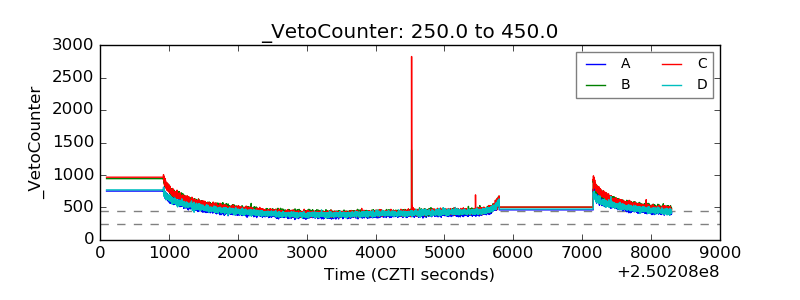 |