| Param | Original file | Final file |
|---|---|---|
| Filename | modeM0/AS1A04_088T03_9000001750_11840cztM0_level2.evt | modeM0/AS1A04_088T03_9000001750_11840cztM0_level2_quad_clean.evt |
| Size (bytes) | 493,116,480 | 89,913,600 |
| Size | 470.3 MB | 85.7 MB |
| Events in quadrant A | 3,151,822 | 590,014 |
| Events in quadrant B | 3,917,759 | 589,341 |
| Events in quadrant C | 2,883,797 | 572,904 |
| Events in quadrant D | 4,558,602 | 536,446 |
| Mode SS | |||
|---|---|---|---|
| Quadrant | BADHDUFLAG | Total packets | Discarded packets |
| A | 0 | 126 | 0 |
| B | 0 | 126 | 0 |
| C | 0 | 126 | 0 |
| D | 0 | 126 | 0 |
| Mode M0 | |||
|---|---|---|---|
| Quadrant | BADHDUFLAG | Total packets | Discarded packets |
| A | 0 | 13360 | 3 |
| B | 0 | 15656 | 2 |
| C | 0 | 12831 | 2 |
| D | 0 | 17744 | 2 |
| Mode M9 | |||
|---|---|---|---|
| Quadrant | BADHDUFLAG | Total packets | Discarded packets |
| A | 0 | 22 | 0 |
| B | 0 | 22 | 0 |
| C | 0 | 22 | 0 |
| D | 0 | 23 | 0 |
| Quadrant | Total seconds | Saturated seconds | Saturation percentage |
|---|---|---|---|
| A | 6222 | 48 | 0.771456% |
| B | 6222 | 260 | 4.178721% |
| C | 6222 | 25 | 0.401800% |
| D | 6222 | 372 | 5.978785% |
Noise dominated data is calculated using 1-second bins in cleaned event files. If a bin has >2000 counts, and if more than 50% of those come from <1% of pixels, then it is considered to be noise-dominated and hence unusable.
| Quadrant | # 1 sec bins | Bins with >0 counts | Bins with >2000 counts | High rate bins dominated by noise | Noise dominated (total time) | Noise dominated (detector-on time) | Marked lightcurve |
|---|---|---|---|---|---|---|---|
| A | 7548 | 6224 | 4 | 4 | 0.05% | 0.06% | 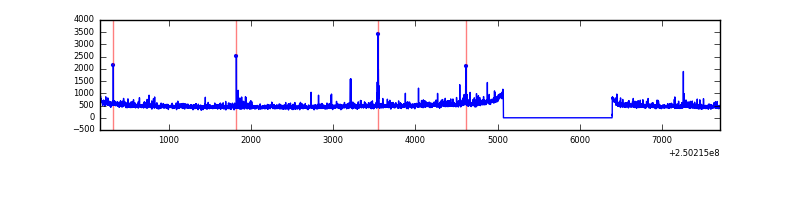 |
| B | 7548 | 6224 | 124 | 124 | 1.64% | 1.99% | 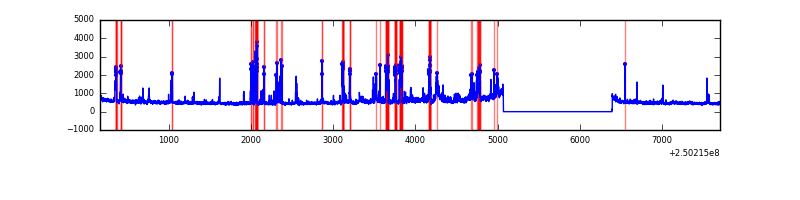 |
| C | 7548 | 6224 | 7 | 7 | 0.09% | 0.11% | 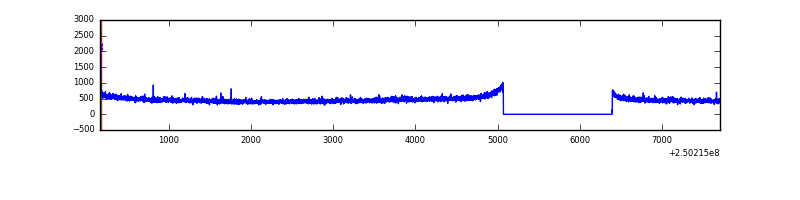 |
| D | 7548 | 6224 | 378 | 378 | 5.01% | 6.07% | 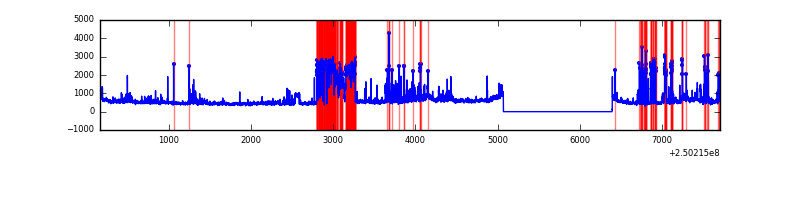 |
Top three noisy pixels from each quadrant. If the there are fewer than three noisy pixels in the level2.evt file, extra rows are filled as -1
| Pixel properties | Quadrant properties | ||||||
|---|---|---|---|---|---|---|---|
| Quadrant | DetID | PixID | Counts | Sigma | Mean | Median | Sigma |
| A | 1 | 162 | 79041 | 509.61 | 763 | 750 | 153.6 |
| A | 1 | 178 | 38661 | 246.77 | 763 | 750 | 153.6 |
| A | 1 | 161 | 34339 | 218.64 | 763 | 750 | 153.6 |
| B | 4 | 239 | 500522 | 3532.0 | 756 | 739 | 141.5 |
| B | 15 | 204 | 237475 | 1673.03 | 756 | 739 | 141.5 |
| B | 3 | 64 | 195498 | 1376.37 | 756 | 739 | 141.5 |
| C | 0 | 10 | 18833 | 107.01 | 734 | 739 | 169.1 |
| C | 13 | 61 | 5623 | 28.89 | 734 | 739 | 169.1 |
| C | 12 | 4 | 1888 | 6.8 | 734 | 739 | 169.1 |
| D | 1 | 52 | 1467928 | 8711.4 | 710 | 692 | 168.4 |
| D | 8 | 195 | 272959 | 1616.53 | 710 | 692 | 168.4 |
| D | 9 | 85 | 50712 | 296.98 | 710 | 692 | 168.4 |
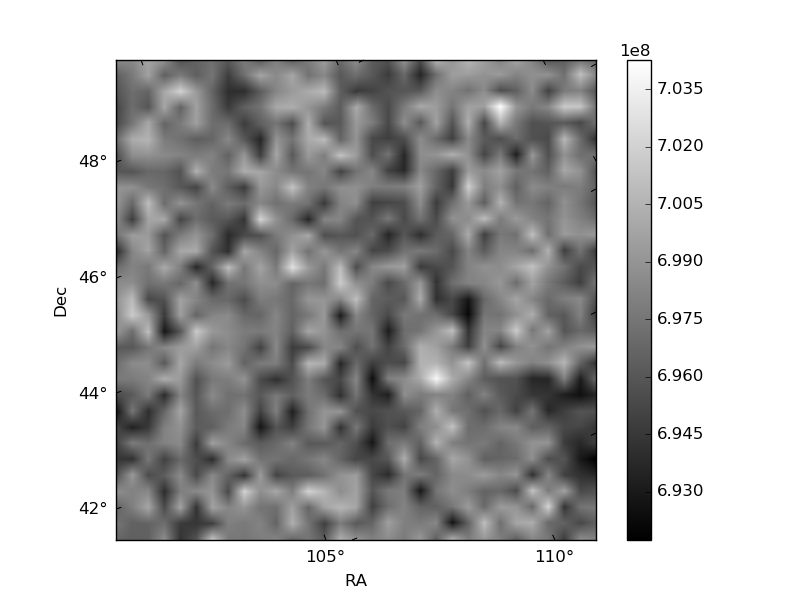
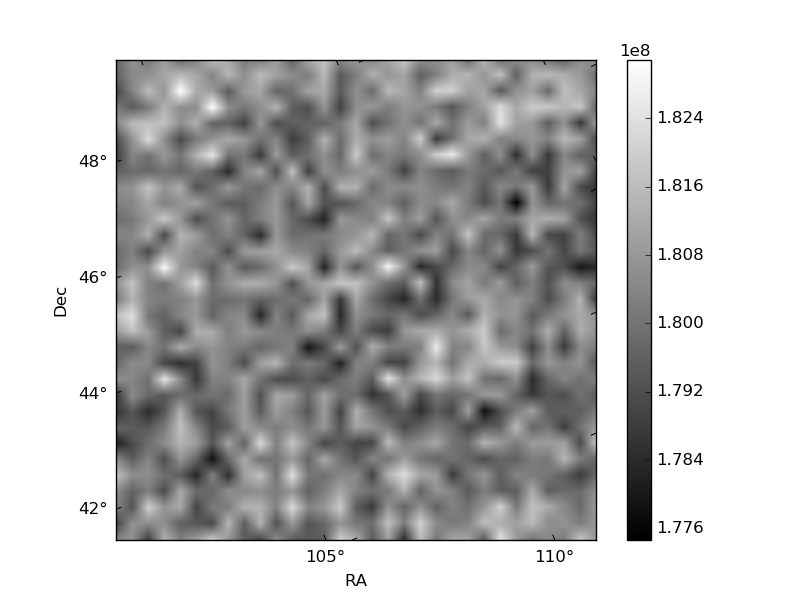
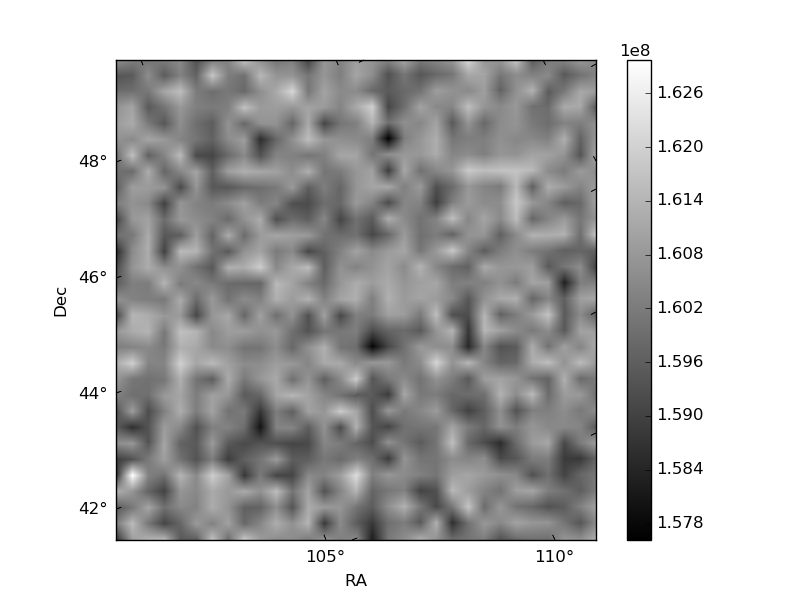
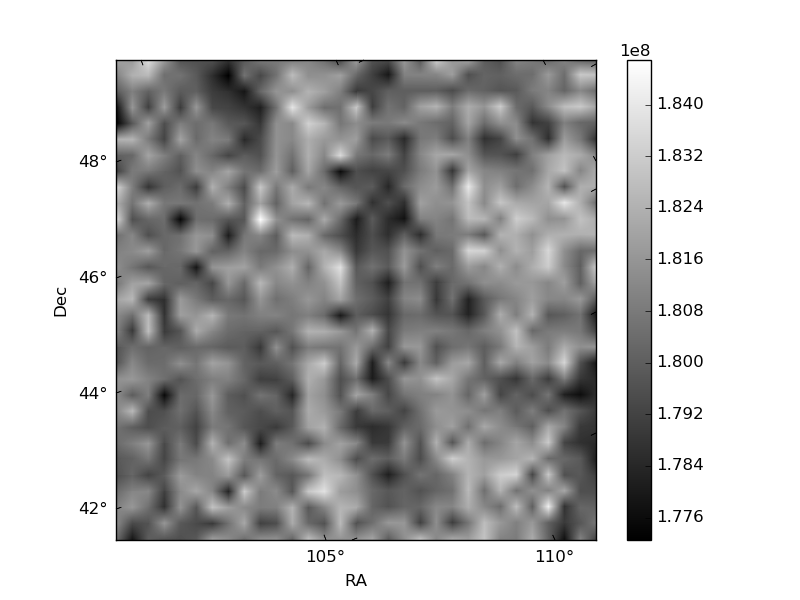
Histogram calculated using DETX and DETY for each event in the final _common_clean file
| Quadrant A | 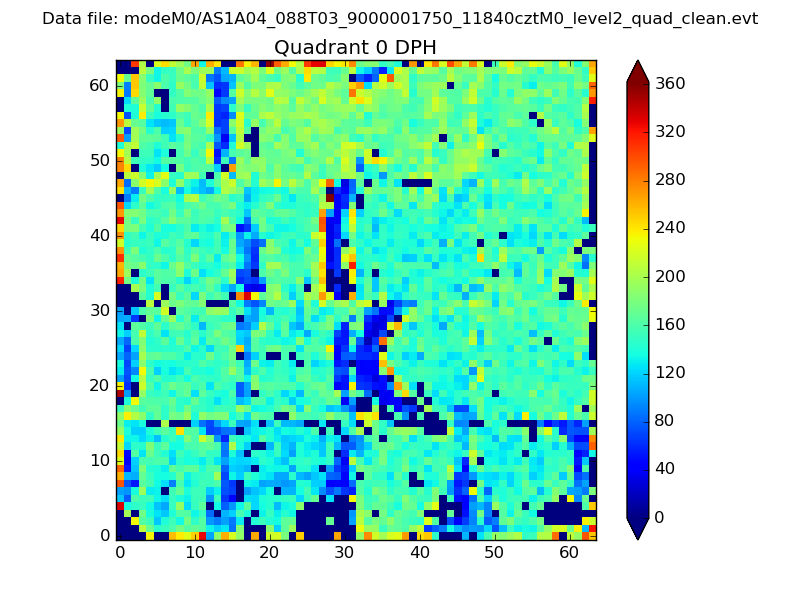 |
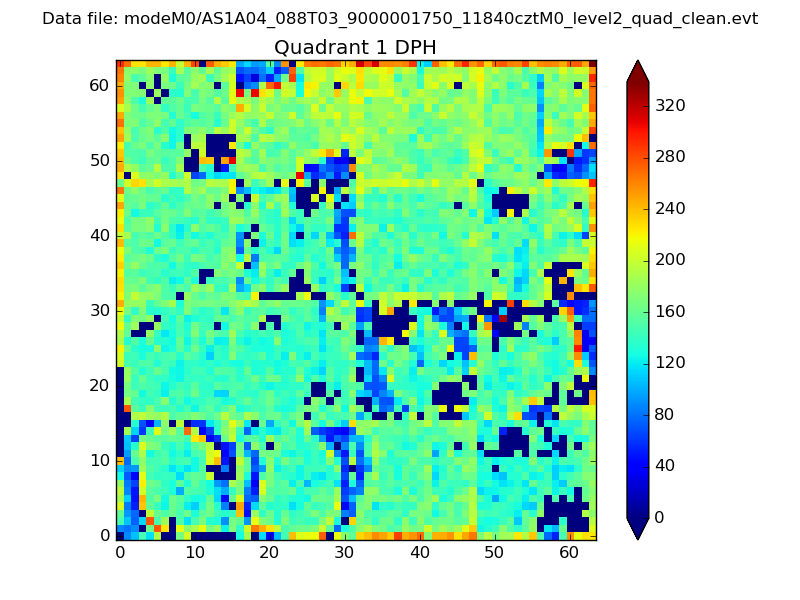 |
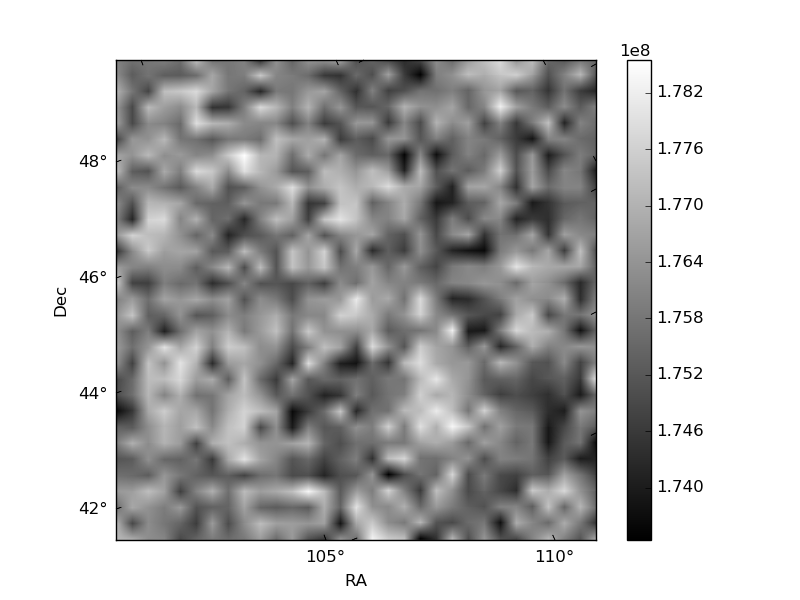
Quadrant B |
|---|---|---|---|
| Quadrant D | 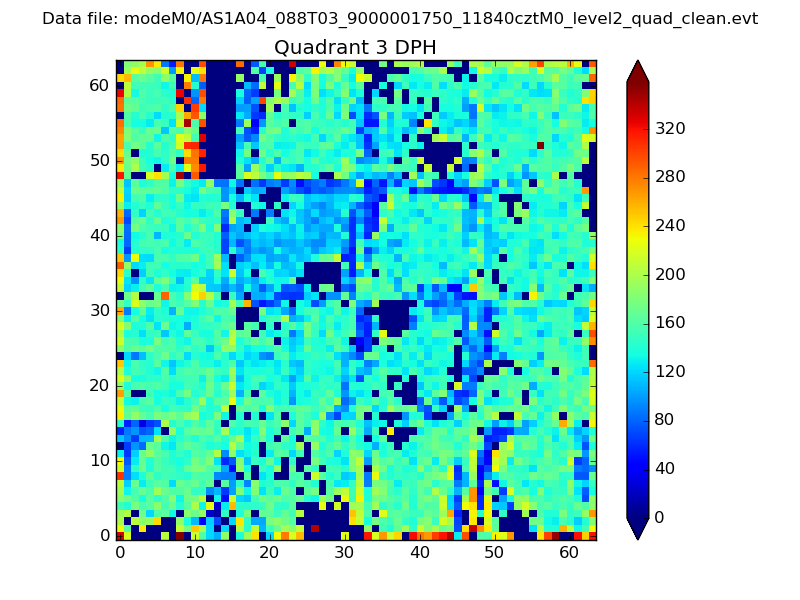 |
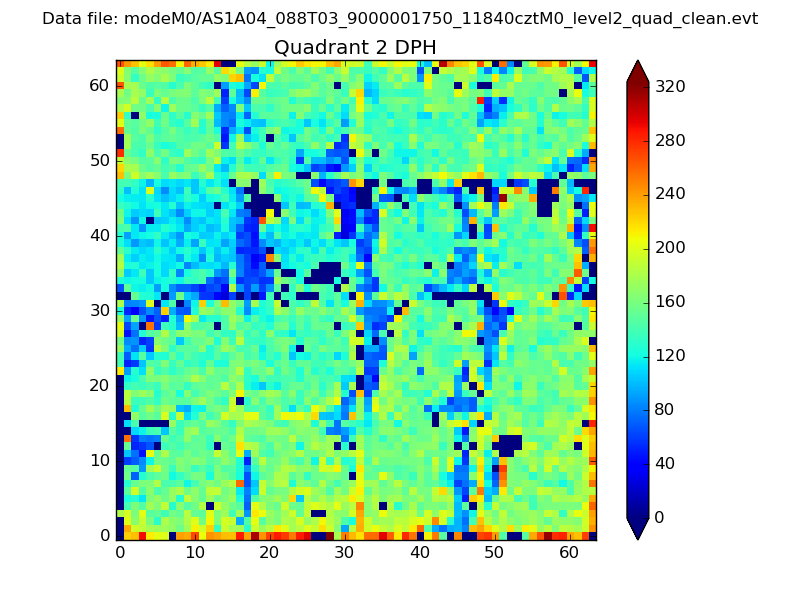 |
Quadrant C |
| Plot type | Count rate plots | Images |
|---|---|---|
| Comparison with Poisson distribution Blue bars denote a histogram of data divided into 1 sec bins. Red curve is a Poisson curve with rate = median count rate of data. |
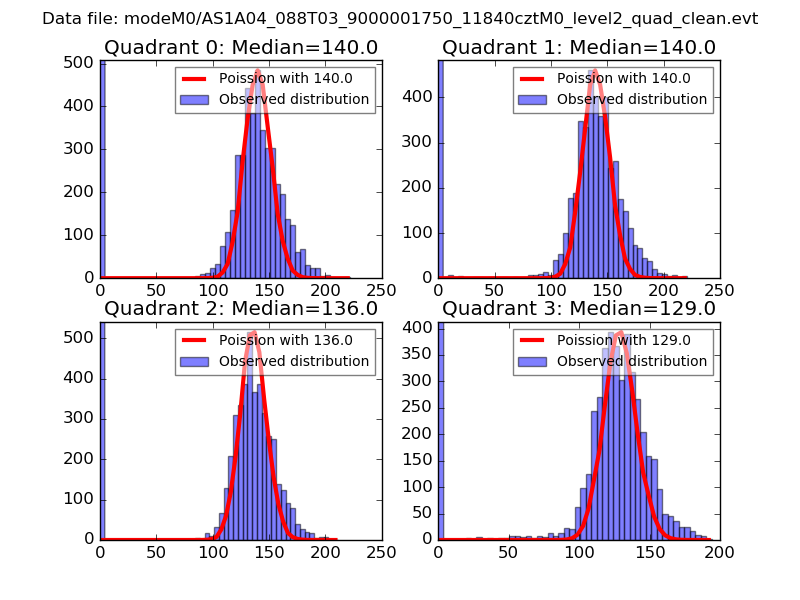 |
 |
| Quadrant-wise count rates Data is divided into 100 sec bins |
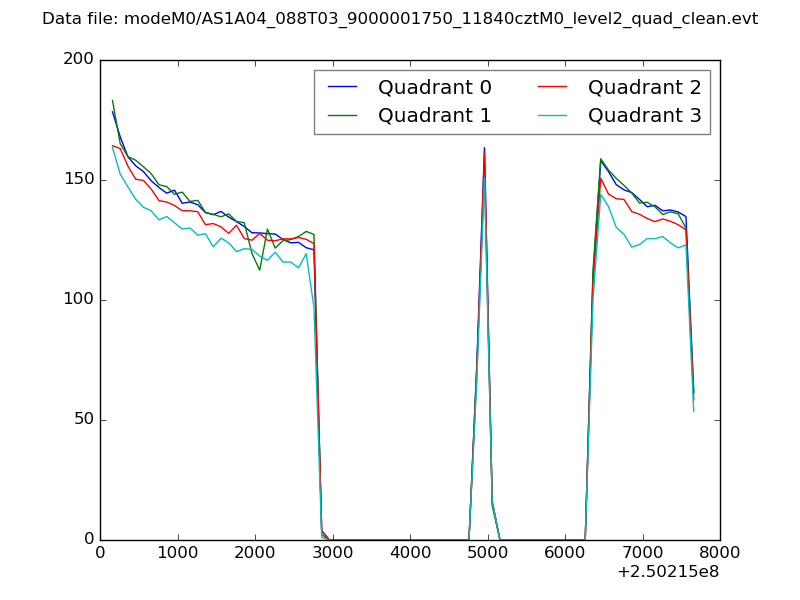 |
|
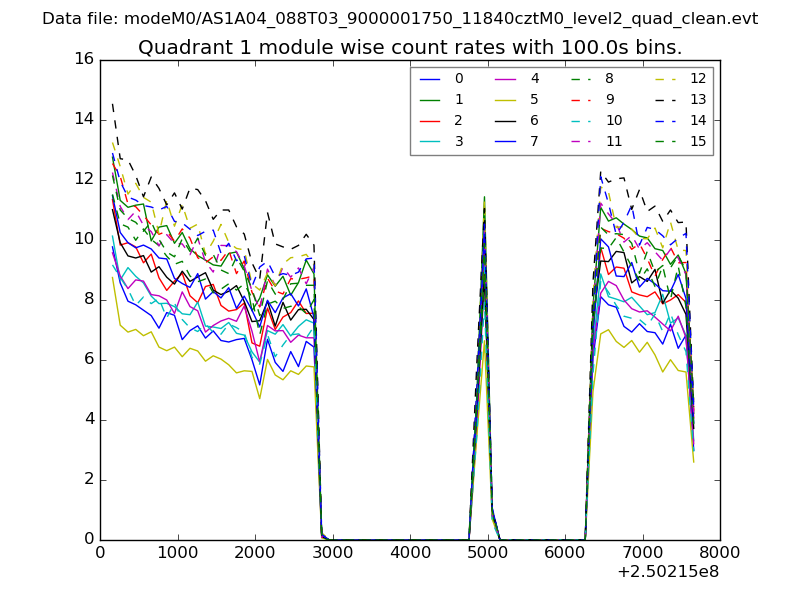
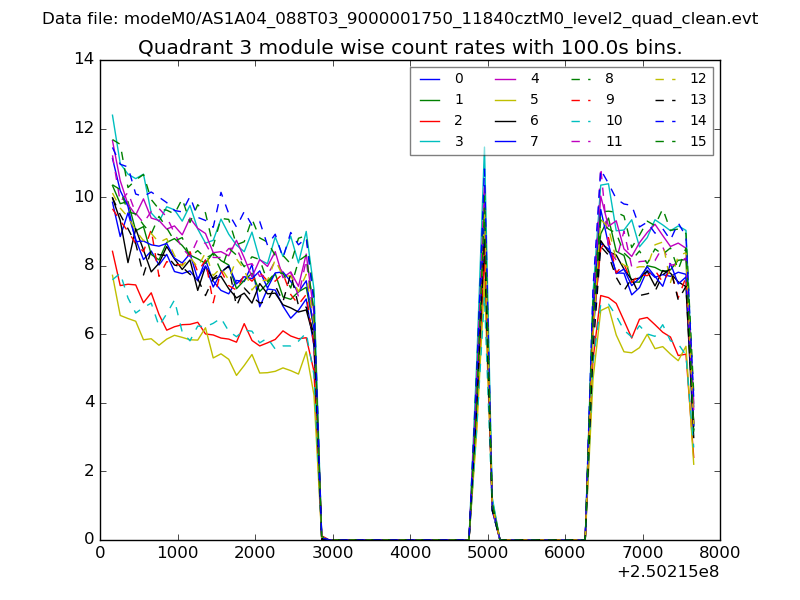
| Module-wise count rates for Quadrant A Data is divided into 100 sec bins |
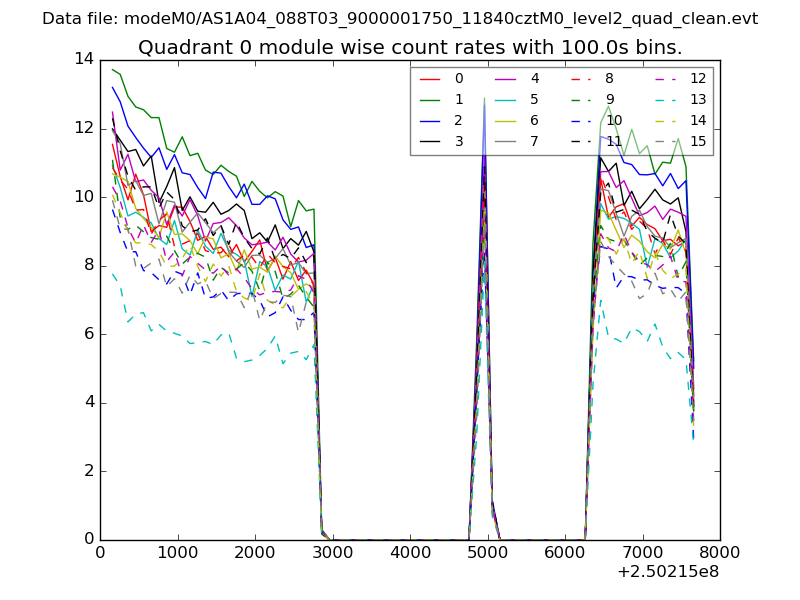 |
 |
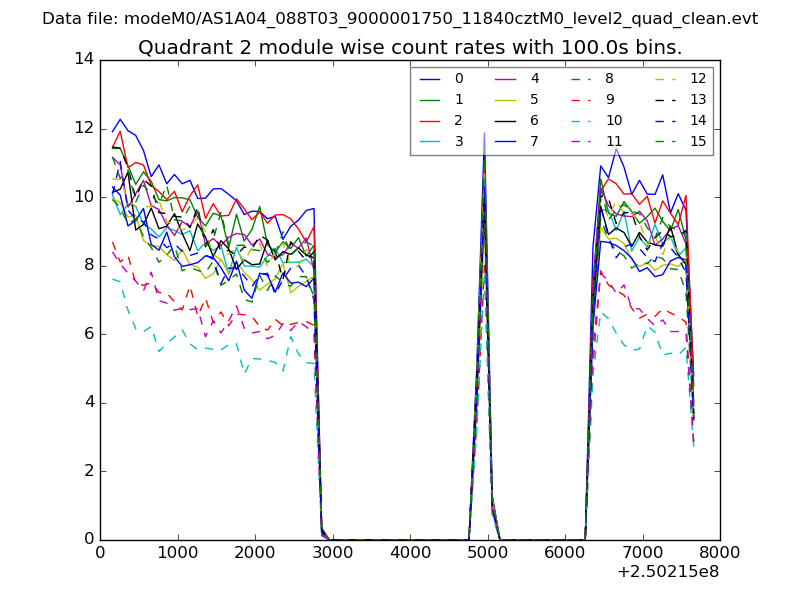
| Module-wise count rates for Quadrant B Data is divided into 100 sec bins |
 |
 |
| Module-wise count rates for Quadrant C Data is divided into 100 sec bins |
 |
 |
| Module-wise count rates for Quadrant D Data is divided into 100 sec bins |
 |
 |
| Parameter | Plot |
|---|---|
| CZT HV Monitor | 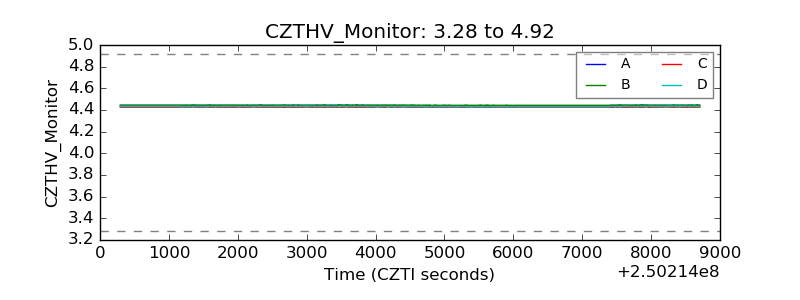 |
| D_VDD | 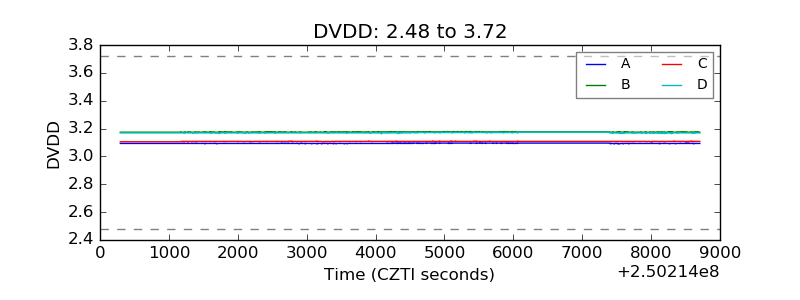 |
| Temperature 1 | 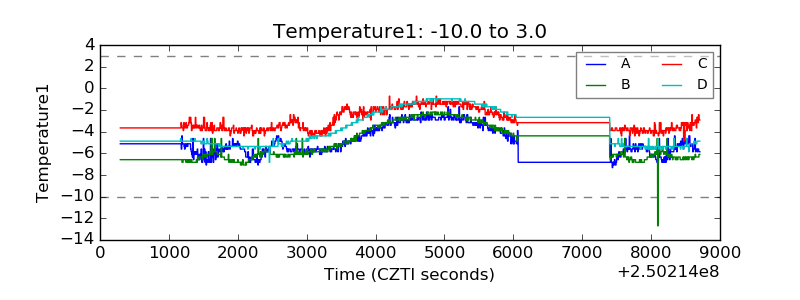 |
| Veto HV Monitor | 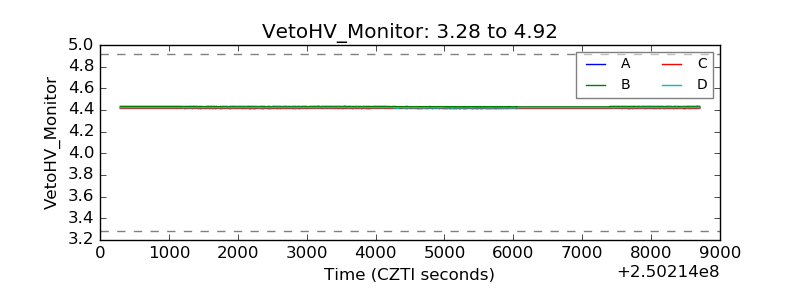 |
| Veto LLD | 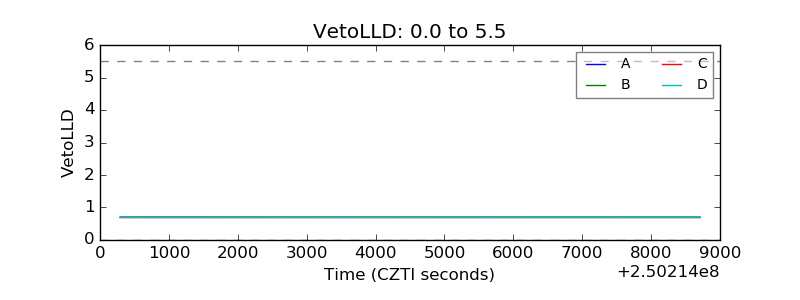 |
| Alpha Counter | 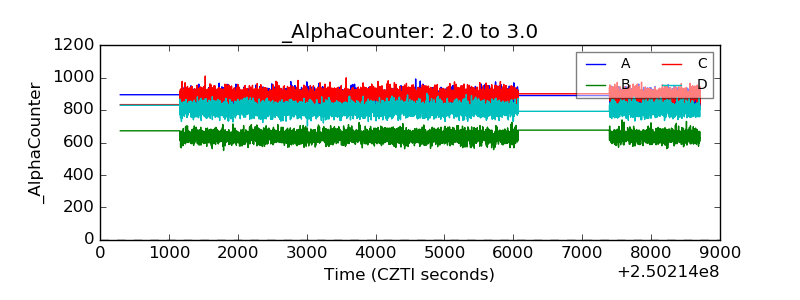 |
| _CPM_Rate | 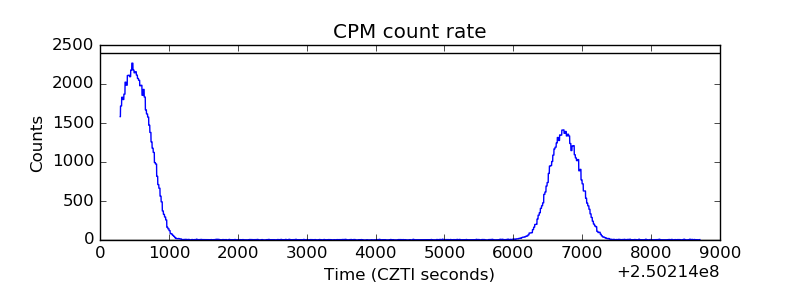 |
| CZT Counter | 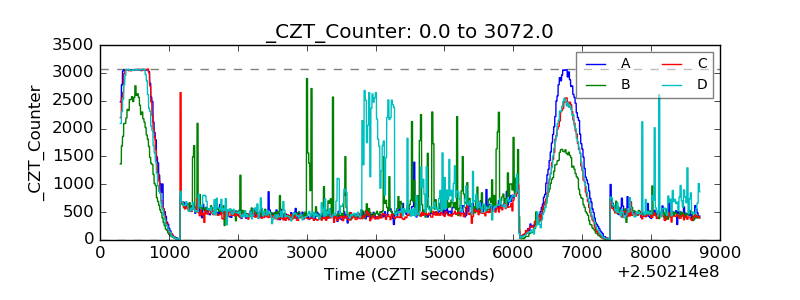 |
| +2.5 Volts monitor |  |
| +5 Volts monitor |  |
| _ROLL_ROT | 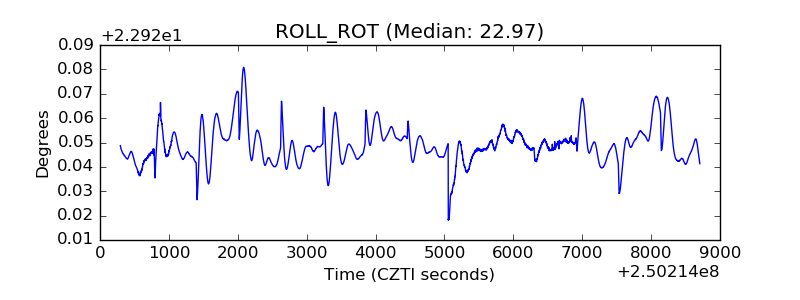 |
| _Roll_DEC | 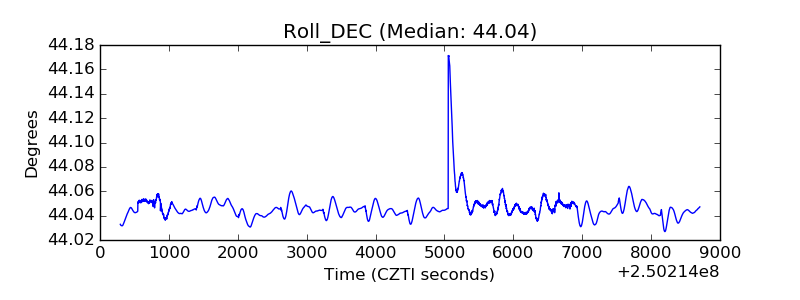 |
| _Roll_RA | 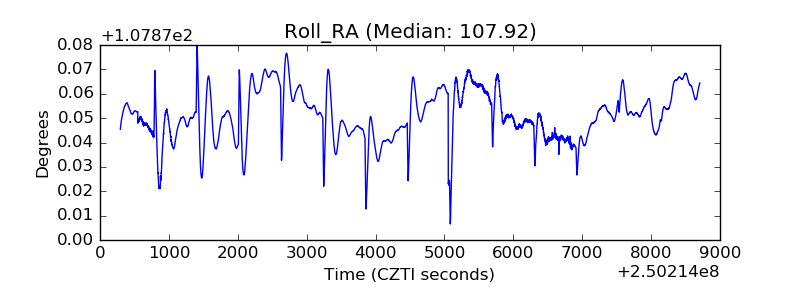 |
| Veto Counter | 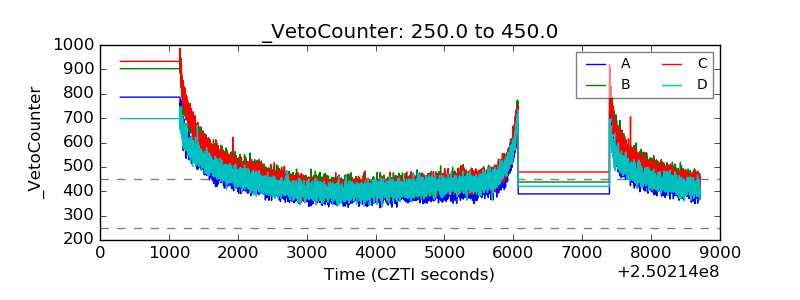 |