| Param | Original file | Final file |
|---|---|---|
| Filename | modeM0/AS1A04_088T03_9000001750_11842cztM0_level2.evt | modeM0/AS1A04_088T03_9000001750_11842cztM0_level2_quad_clean.evt |
| Size (bytes) | 484,545,600 | 97,277,760 |
| Size | 462.1 MB | 92.8 MB |
| Events in quadrant A | 3,344,347 | 634,565 |
| Events in quadrant B | 4,497,236 | 619,723 |
| Events in quadrant C | 3,033,711 | 617,814 |
| Events in quadrant D | 3,335,437 | 597,944 |
| Mode SS | |||
|---|---|---|---|
| Quadrant | BADHDUFLAG | Total packets | Discarded packets |
| A | 0 | 138 | 0 |
| B | 0 | 138 | 0 |
| C | 0 | 138 | 0 |
| D | 0 | 138 | 0 |
| Mode M0 | |||
|---|---|---|---|
| Quadrant | BADHDUFLAG | Total packets | Discarded packets |
| A | 0 | 14354 | 3 |
| B | 0 | 17913 | 2 |
| C | 0 | 13938 | 2 |
| D | 0 | 14876 | 2 |
| Mode M9 | |||
|---|---|---|---|
| Quadrant | BADHDUFLAG | Total packets | Discarded packets |
| A | 0 | 13 | 0 |
| B | 0 | 13 | 0 |
| C | 0 | 13 | 0 |
| D | 0 | 14 | 0 |
| Quadrant | Total seconds | Saturated seconds | Saturation percentage |
|---|---|---|---|
| A | 6830 | 92 | 1.346999% |
| B | 6830 | 285 | 4.172767% |
| C | 6830 | 23 | 0.336750% |
| D | 6830 | 79 | 1.156662% |
Noise dominated data is calculated using 1-second bins in cleaned event files. If a bin has >2000 counts, and if more than 50% of those come from <1% of pixels, then it is considered to be noise-dominated and hence unusable.
| Quadrant | # 1 sec bins | Bins with >0 counts | Bins with >2000 counts | High rate bins dominated by noise | Noise dominated (total time) | Noise dominated (detector-on time) | Marked lightcurve |
|---|---|---|---|---|---|---|---|
| A | 7741 | 6832 | 1 | 1 | 0.01% | 0.01% | 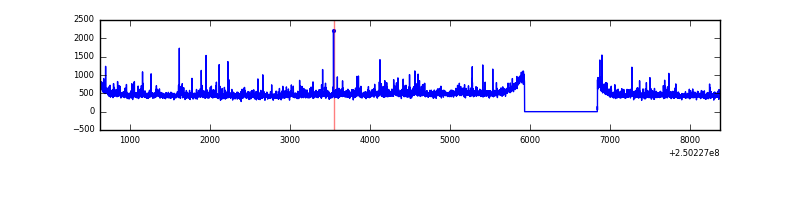 |
| B | 7741 | 6832 | 137 | 137 | 1.77% | 2.01% | 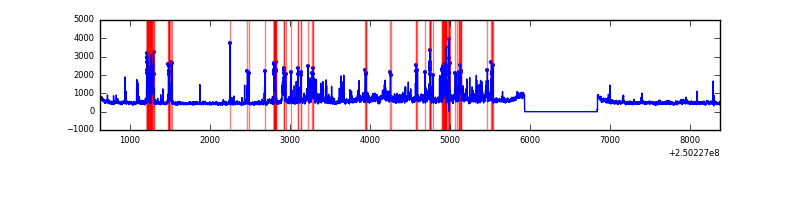 |
| C | 7741 | 6832 | 0 | 0 | 0.00% | 0.00% | 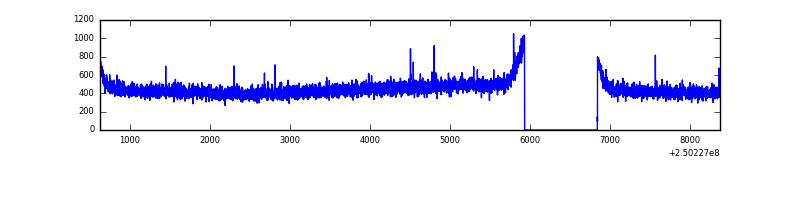 |
| D | 7741 | 6832 | 36 | 36 | 0.47% | 0.53% | 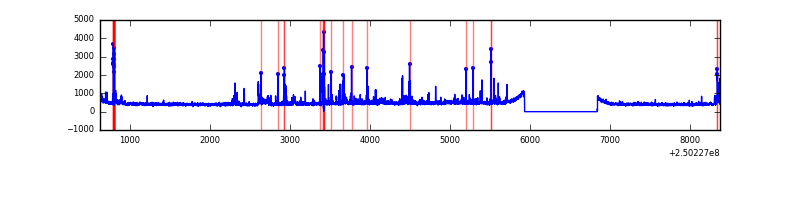 |
Top three noisy pixels from each quadrant. If the there are fewer than three noisy pixels in the level2.evt file, extra rows are filled as -1
| Pixel properties | Quadrant properties | ||||||
|---|---|---|---|---|---|---|---|
| Quadrant | DetID | PixID | Counts | Sigma | Mean | Median | Sigma |
| A | 1 | 162 | 84350 | 508.44 | 814 | 798 | 164.3 |
| A | 1 | 178 | 43067 | 257.22 | 814 | 798 | 164.3 |
| A | 1 | 161 | 37969 | 226.2 | 814 | 798 | 164.3 |
| B | 4 | 239 | 573205 | 3732.05 | 800 | 780 | 153.4 |
| B | 15 | 204 | 497173 | 3236.34 | 800 | 780 | 153.4 |
| B | 3 | 64 | 207753 | 1349.4 | 800 | 780 | 153.4 |
| C | 13 | 61 | 5646 | 27.25 | 776 | 779 | 178.6 |
| C | 12 | 4 | 4047 | 18.3 | 776 | 779 | 178.6 |
| C | 0 | 10 | 2130 | 7.56 | 776 | 779 | 178.6 |
| D | 1 | 52 | 281517 | 1526.19 | 775 | 753 | 184.0 |
| D | 9 | 85 | 51838 | 277.69 | 775 | 753 | 184.0 |
| D | 13 | 104 | 41281 | 220.3 | 775 | 753 | 184.0 |
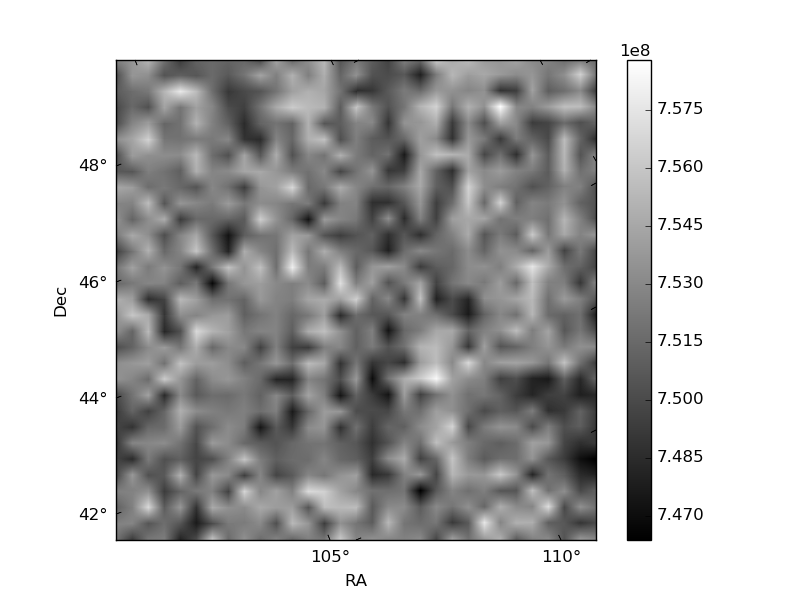
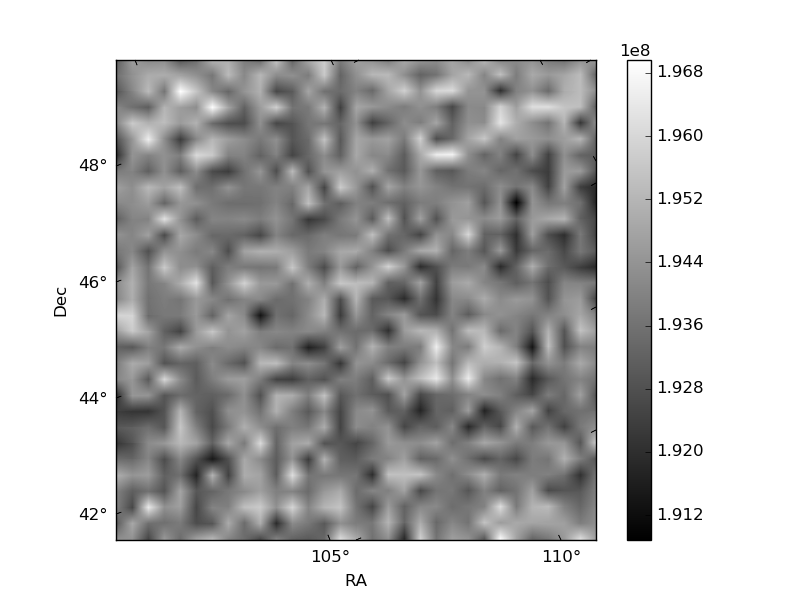
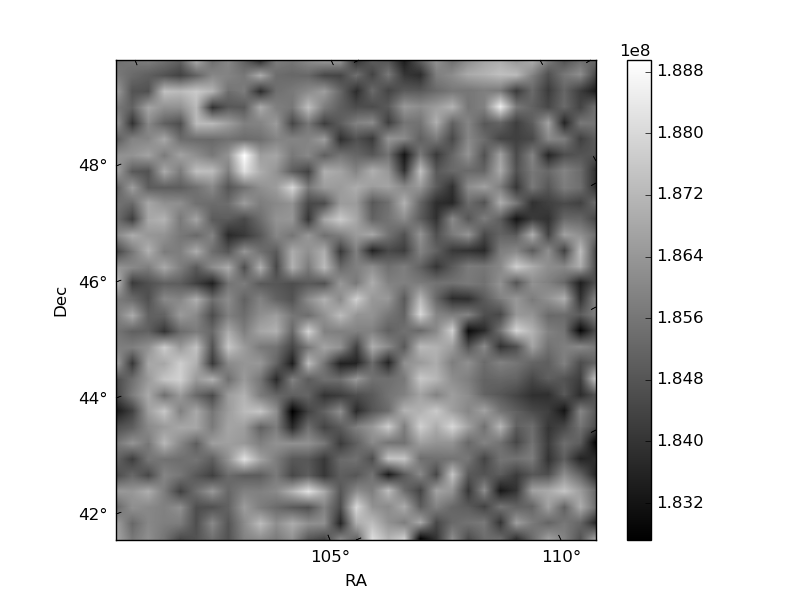
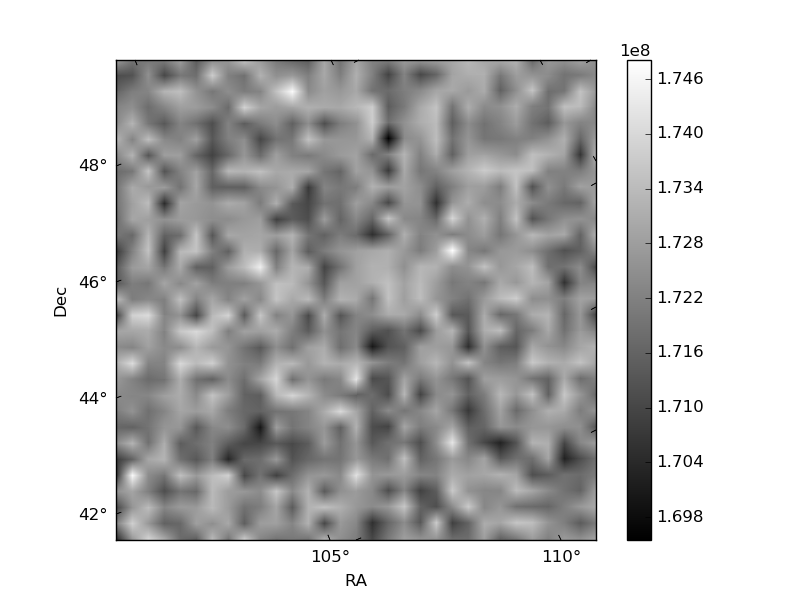
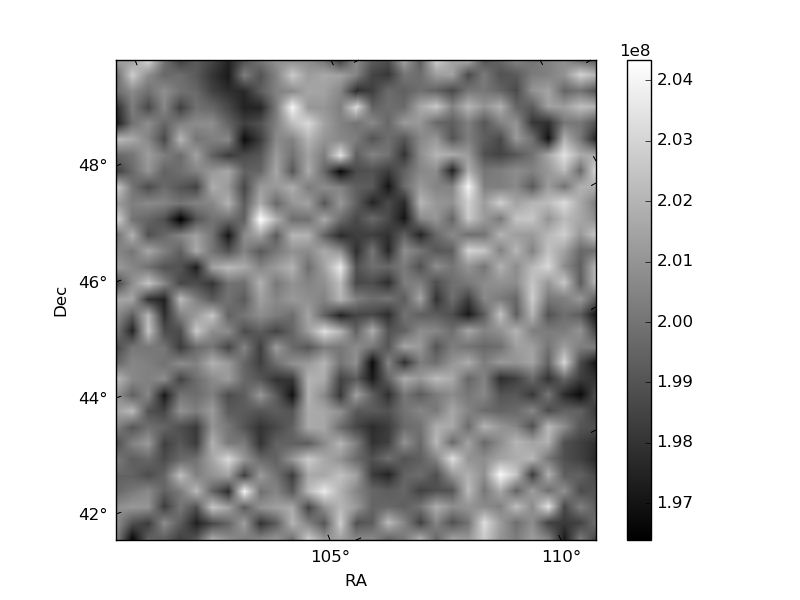
Histogram calculated using DETX and DETY for each event in the final _common_clean file
| Quadrant A | 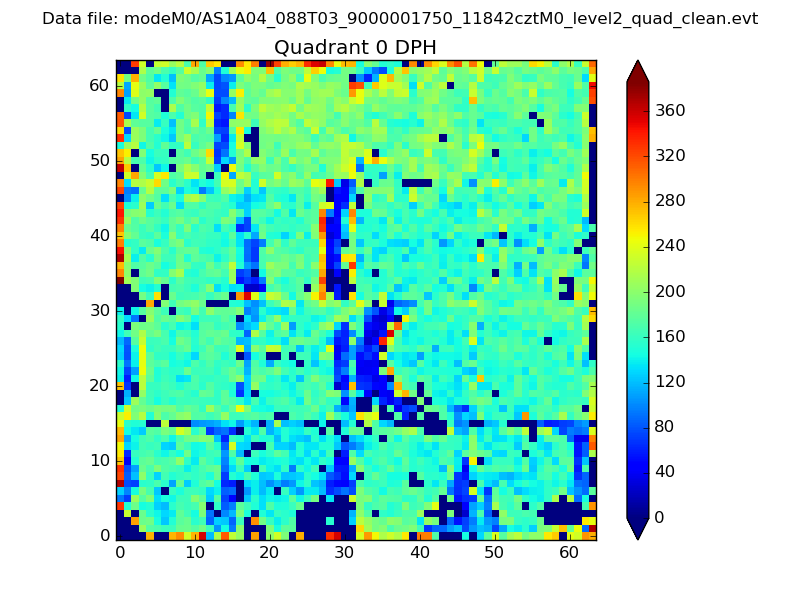 |
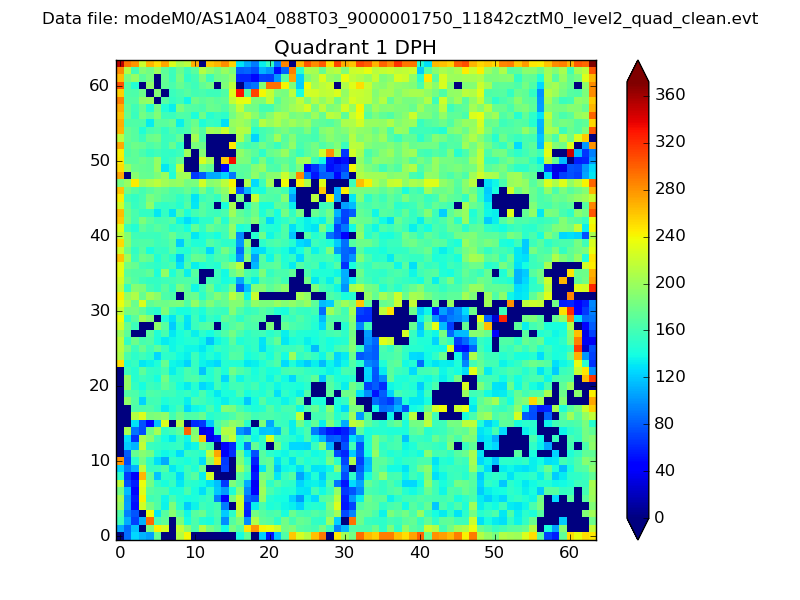 |
Quadrant B |
|---|---|---|---|
| Quadrant D | 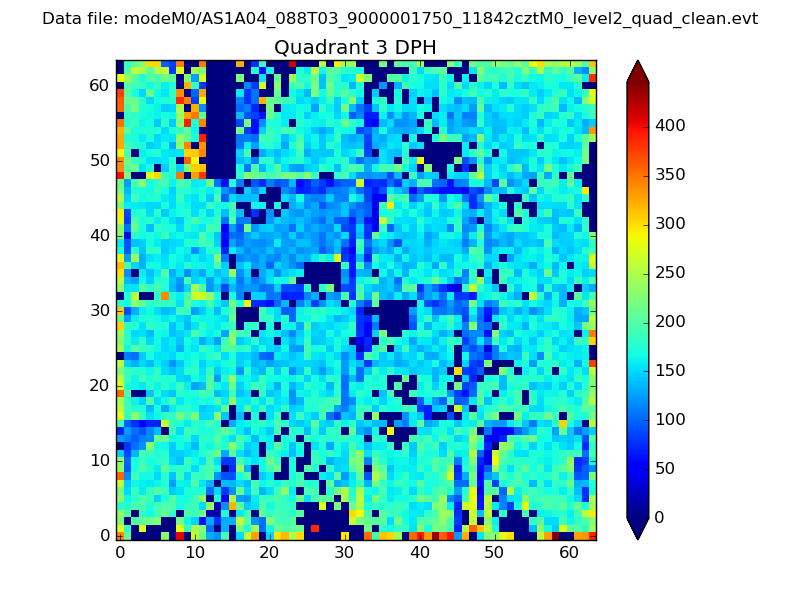 |
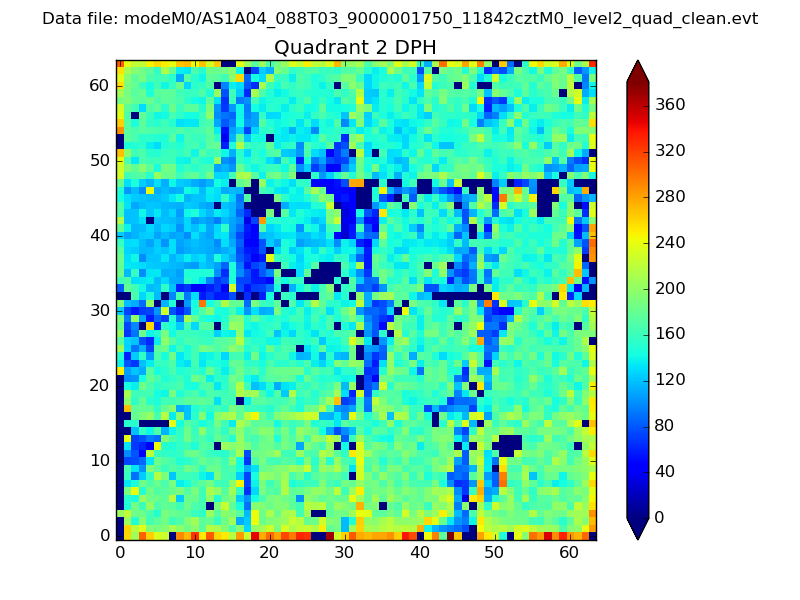 |
Quadrant C |
| Plot type | Count rate plots | Images |
|---|---|---|
| Comparison with Poisson distribution Blue bars denote a histogram of data divided into 1 sec bins. Red curve is a Poisson curve with rate = median count rate of data. |
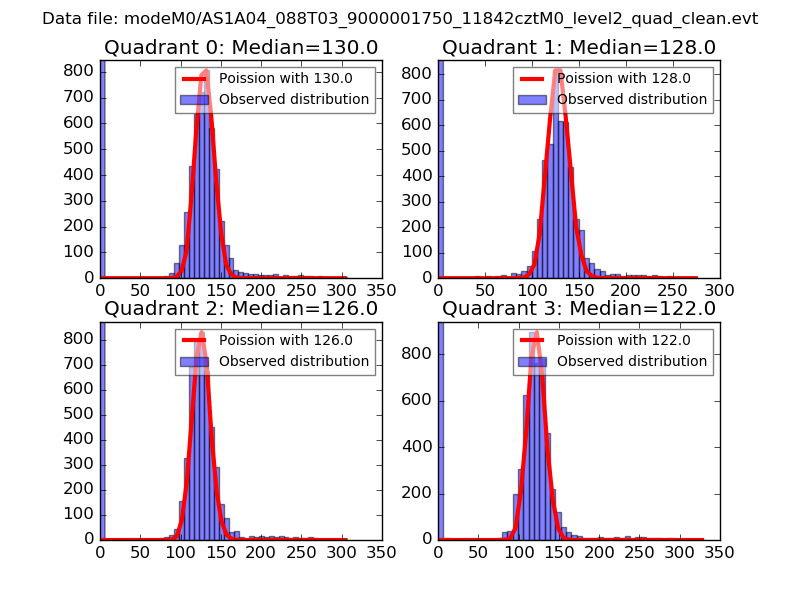 |
 |
| Quadrant-wise count rates Data is divided into 100 sec bins |
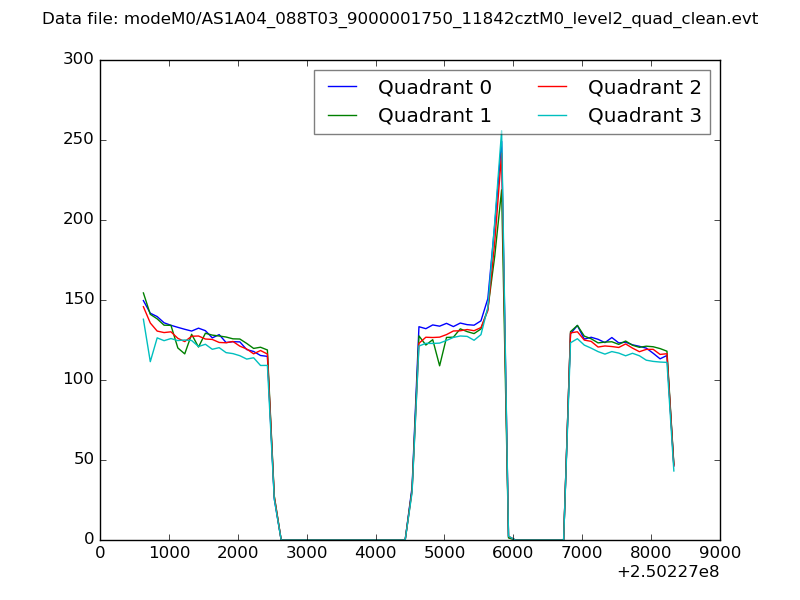 |
|
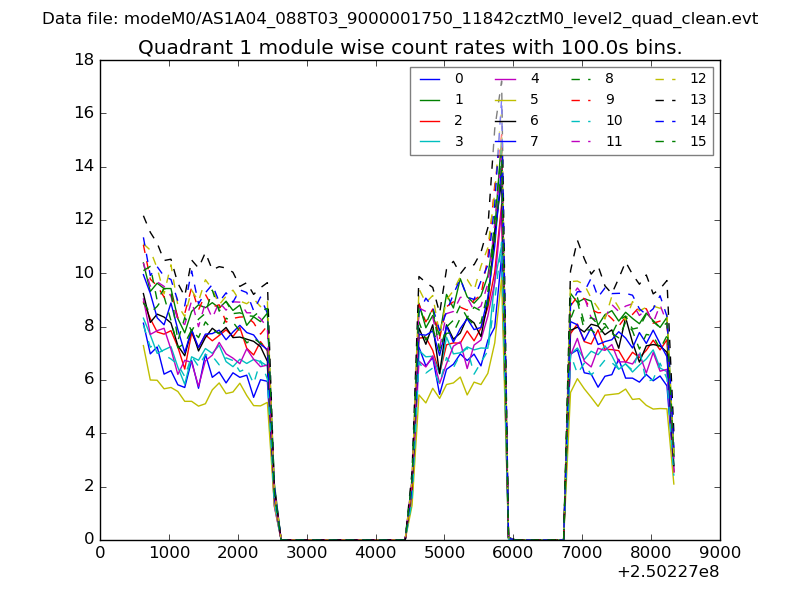
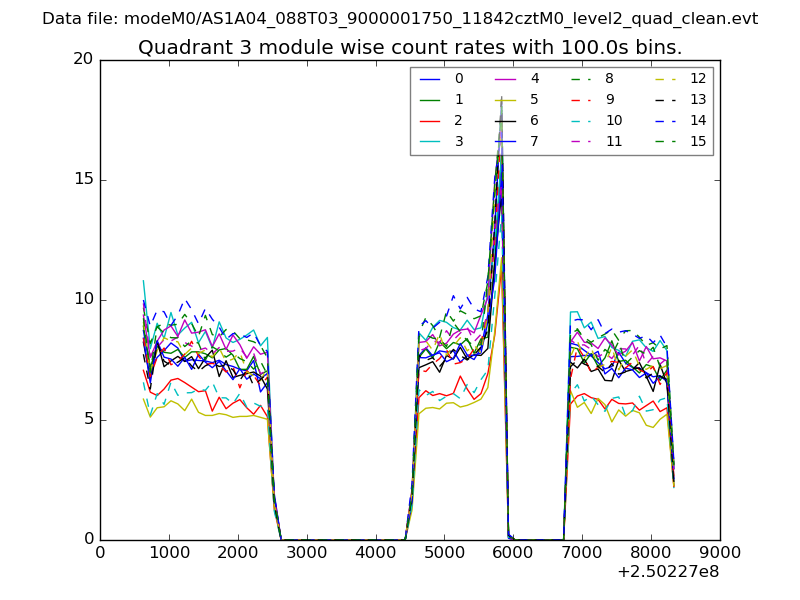
| Module-wise count rates for Quadrant A Data is divided into 100 sec bins |
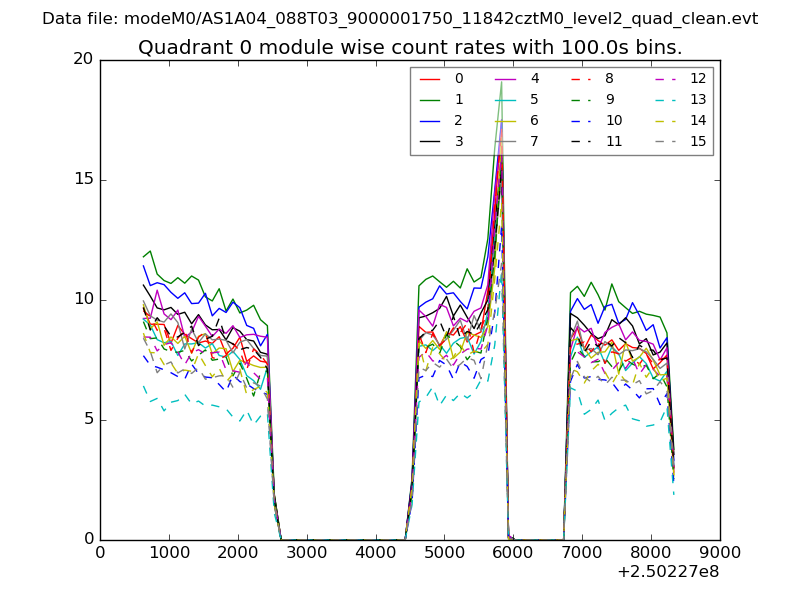 |
 |
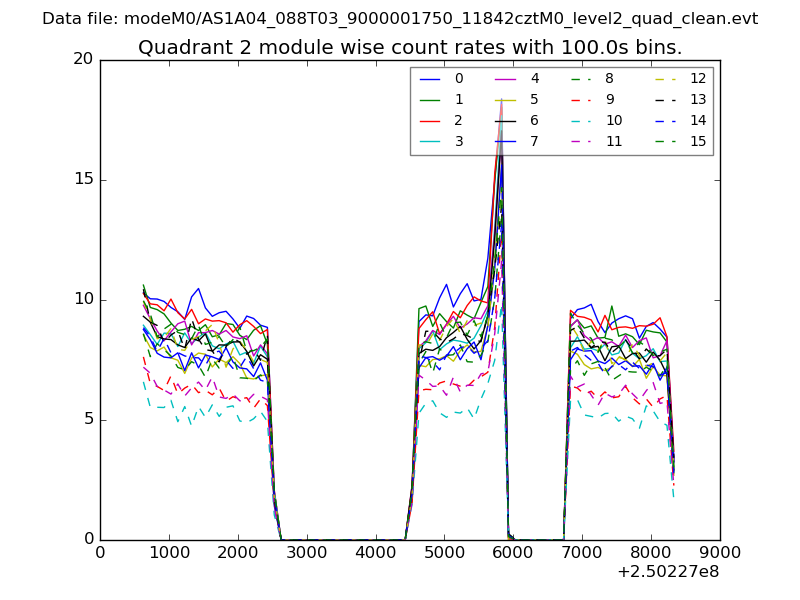
| Module-wise count rates for Quadrant B Data is divided into 100 sec bins |
 |
 |
| Module-wise count rates for Quadrant C Data is divided into 100 sec bins |
 |
 |
| Module-wise count rates for Quadrant D Data is divided into 100 sec bins |
 |
 |
| Parameter | Plot |
|---|---|
| CZT HV Monitor | 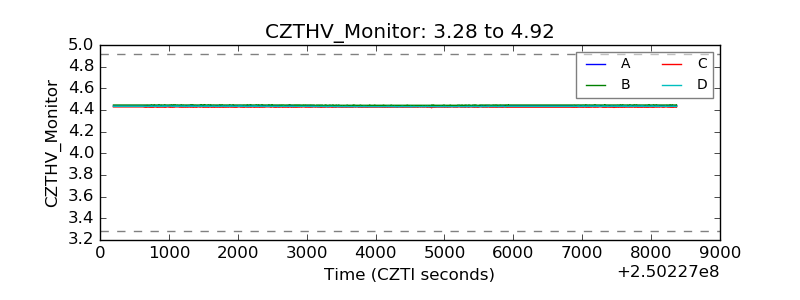 |
| D_VDD | 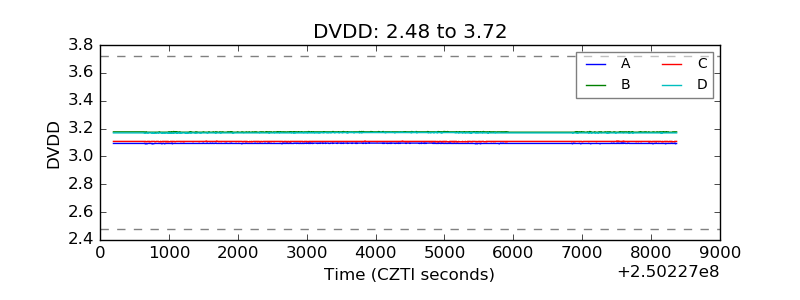 |
| Temperature 1 | 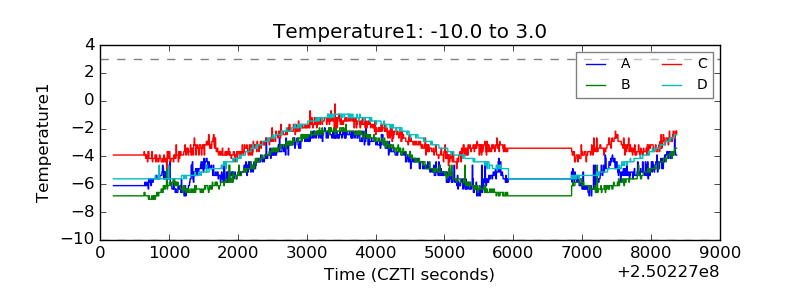 |
| Veto HV Monitor | 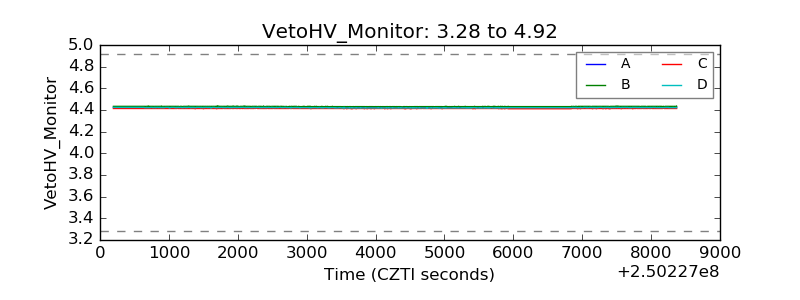 |
| Veto LLD | 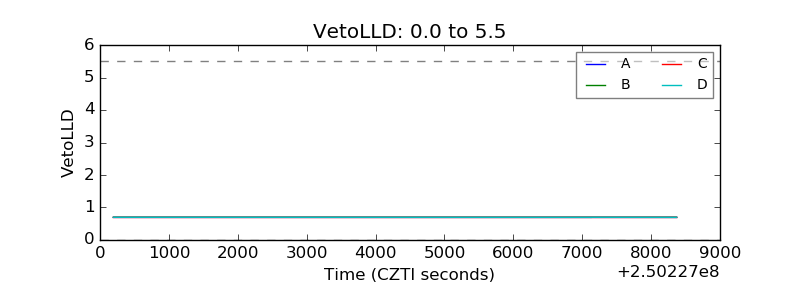 |
| Alpha Counter | 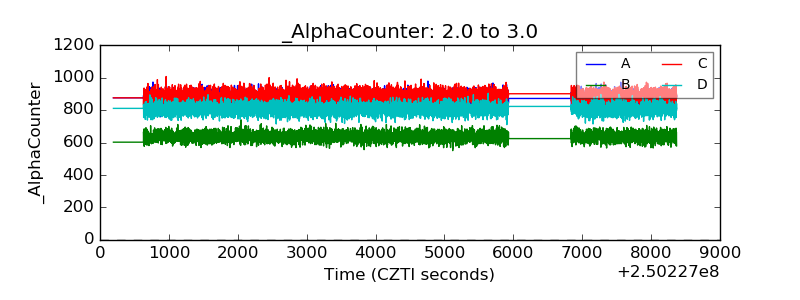 |
| _CPM_Rate | 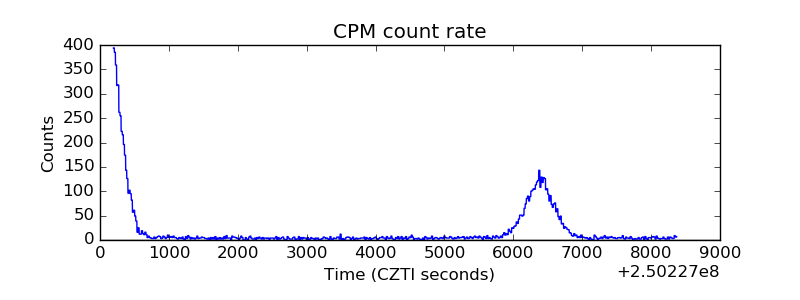 |
| CZT Counter | 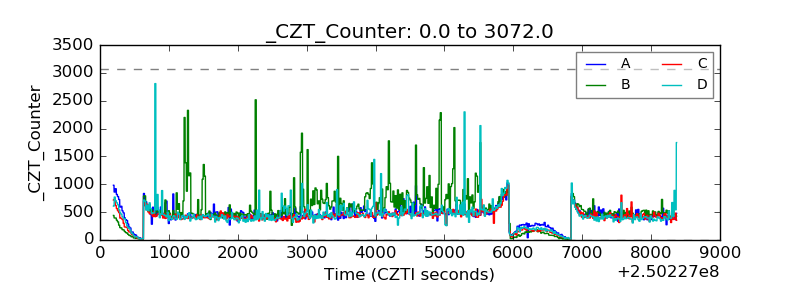 |
| +2.5 Volts monitor | 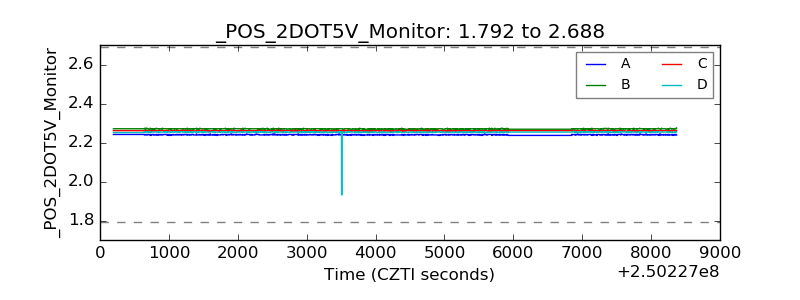 |
| +5 Volts monitor | 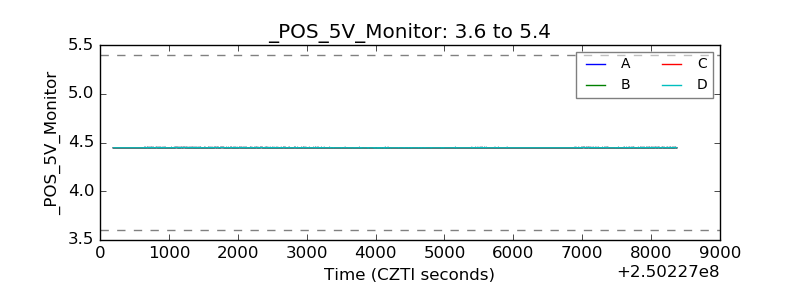 |
| _ROLL_ROT | 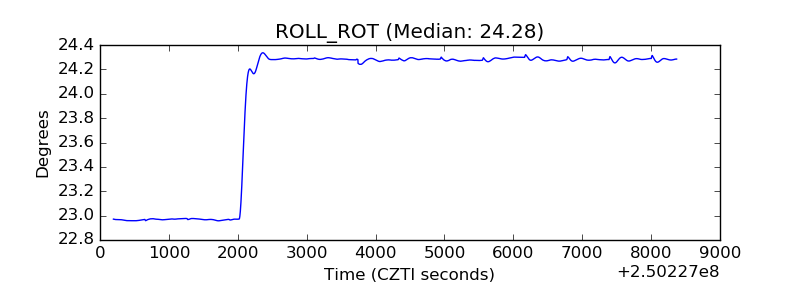 |
| _Roll_DEC | 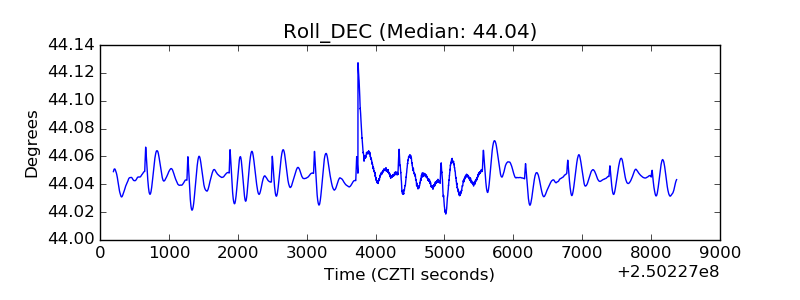 |
| _Roll_RA | 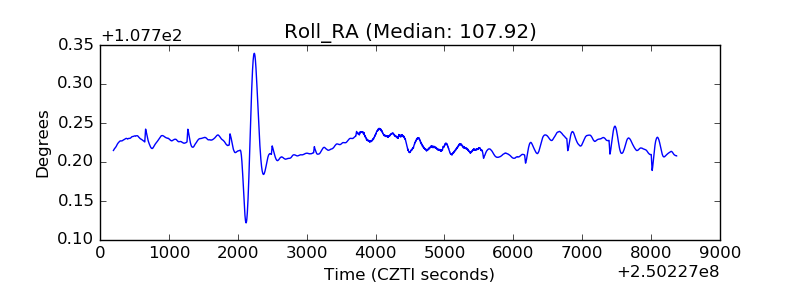 |
| Veto Counter | 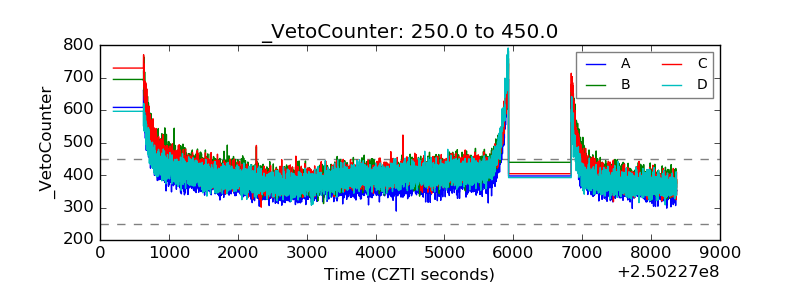 |