| Param | Original file | Final file |
|---|---|---|
| Filename | modeM0/AS1A04_088T03_9000001750_11843cztM0_level2.evt | modeM0/AS1A04_088T03_9000001750_11843cztM0_level2_quad_clean.evt |
| Size (bytes) | 455,765,760 | 85,996,800 |
| Size | 434.7 MB | 82.0 MB |
| Events in quadrant A | 3,237,242 | 547,956 |
| Events in quadrant B | 4,161,095 | 544,549 |
| Events in quadrant C | 2,886,683 | 537,539 |
| Events in quadrant D | 3,072,081 | 516,841 |
| Mode SS | |||
|---|---|---|---|
| Quadrant | BADHDUFLAG | Total packets | Discarded packets |
| A | 0 | 132 | 0 |
| B | 0 | 132 | 0 |
| C | 0 | 132 | 0 |
| D | 0 | 132 | 0 |
| Mode M0 | |||
|---|---|---|---|
| Quadrant | BADHDUFLAG | Total packets | Discarded packets |
| A | 0 | 13838 | 2 |
| B | 0 | 16654 | 1 |
| C | 0 | 13369 | 1 |
| D | 0 | 13865 | 1 |
| Mode M9 | |||
|---|---|---|---|
| Quadrant | BADHDUFLAG | Total packets | Discarded packets |
| A | 0 | 5 | 0 |
| B | 0 | 5 | 0 |
| C | 0 | 5 | 0 |
| D | 0 | 5 | 0 |
| Quadrant | Total seconds | Saturated seconds | Saturation percentage |
|---|---|---|---|
| A | 6560 | 134 | 2.042683% |
| B | 6560 | 316 | 4.817073% |
| C | 6560 | 53 | 0.807927% |
| D | 6560 | 89 | 1.356707% |
Noise dominated data is calculated using 1-second bins in cleaned event files. If a bin has >2000 counts, and if more than 50% of those come from <1% of pixels, then it is considered to be noise-dominated and hence unusable.
| Quadrant | # 1 sec bins | Bins with >0 counts | Bins with >2000 counts | High rate bins dominated by noise | Noise dominated (total time) | Noise dominated (detector-on time) | Marked lightcurve |
|---|---|---|---|---|---|---|---|
| A | 6990 | 6561 | 1 | 1 | 0.01% | 0.02% | 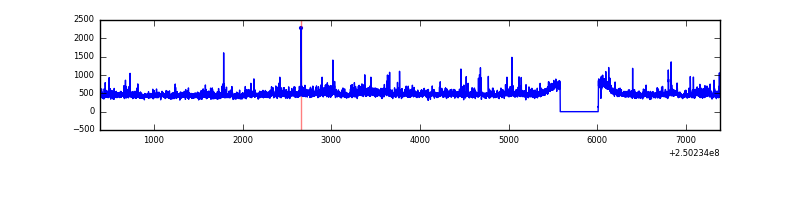 |
| B | 6991 | 6562 | 102 | 102 | 1.46% | 1.55% | 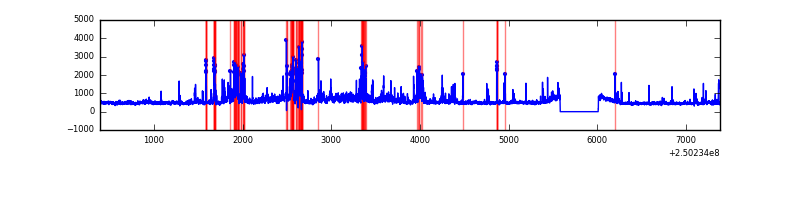 |
| C | 6991 | 6562 | 0 | 0 | 0.00% | 0.00% | 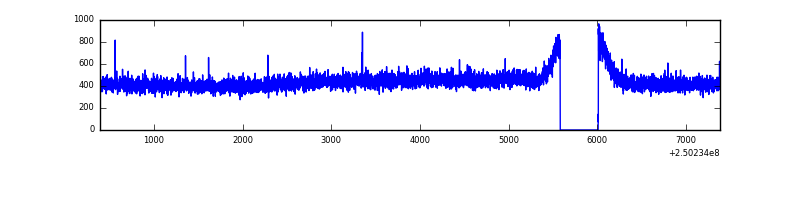 |
| D | 6991 | 6562 | 9 | 9 | 0.13% | 0.14% | 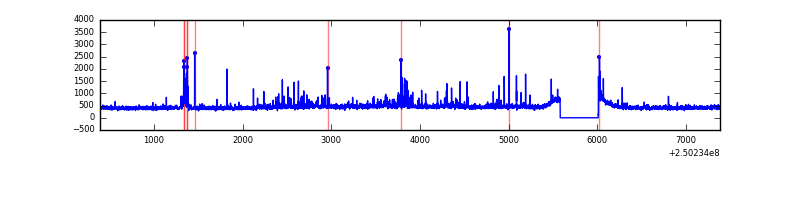 |
Top three noisy pixels from each quadrant. If the there are fewer than three noisy pixels in the level2.evt file, extra rows are filled as -1
| Pixel properties | Quadrant properties | ||||||
|---|---|---|---|---|---|---|---|
| Quadrant | DetID | PixID | Counts | Sigma | Mean | Median | Sigma |
| A | 1 | 162 | 92042 | 583.03 | 771 | 754 | 156.6 |
| A | 1 | 178 | 49019 | 308.26 | 771 | 754 | 156.6 |
| A | 1 | 161 | 42163 | 264.47 | 771 | 754 | 156.6 |
| B | 4 | 239 | 518896 | 3553.48 | 757 | 739 | 145.8 |
| B | 15 | 204 | 419463 | 2871.57 | 757 | 739 | 145.8 |
| B | 3 | 64 | 175622 | 1199.33 | 757 | 739 | 145.8 |
| C | 13 | 61 | 5442 | 27.26 | 739 | 741 | 172.4 |
| C | 14 | 234 | 2377 | 9.49 | 739 | 741 | 172.4 |
| C | 14 | 238 | 2091 | 7.83 | 739 | 741 | 172.4 |
| D | 1 | 52 | 85223 | 479.78 | 739 | 718 | 176.1 |
| D | 13 | 104 | 67039 | 376.54 | 739 | 718 | 176.1 |
| D | 9 | 85 | 51021 | 285.6 | 739 | 718 | 176.1 |
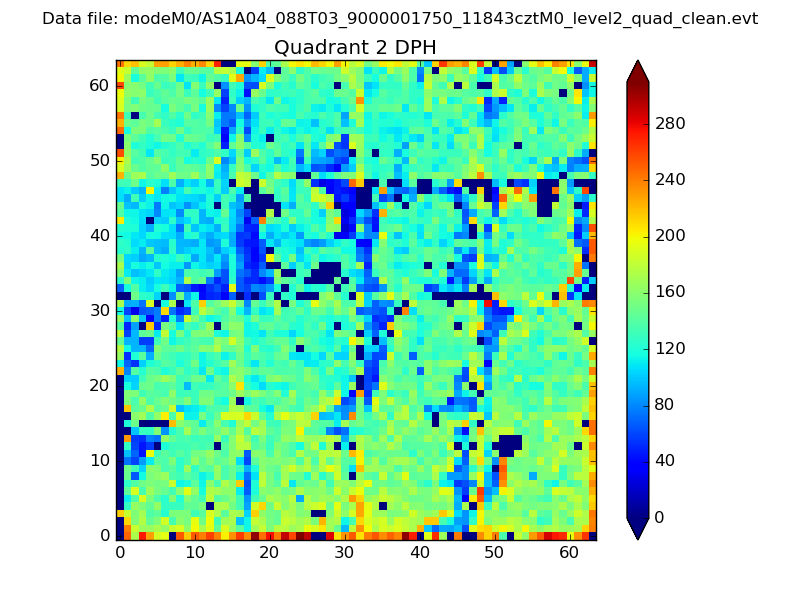
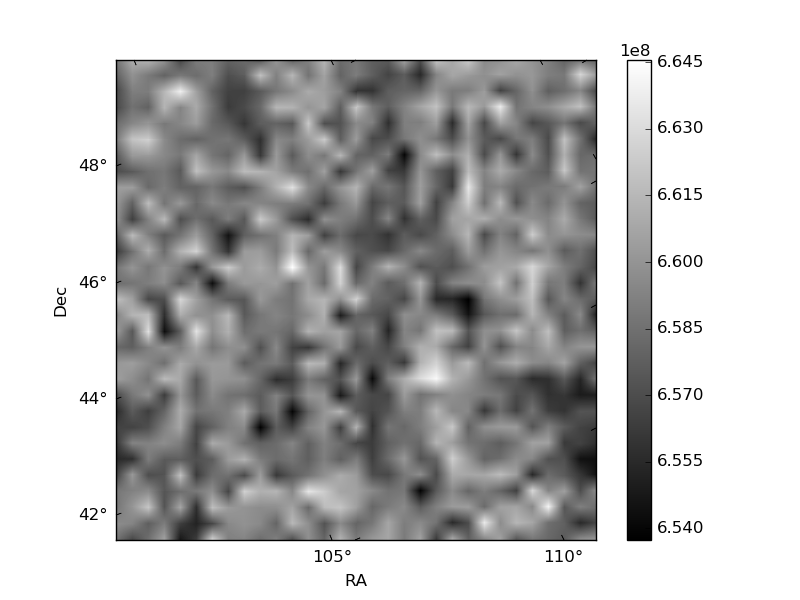
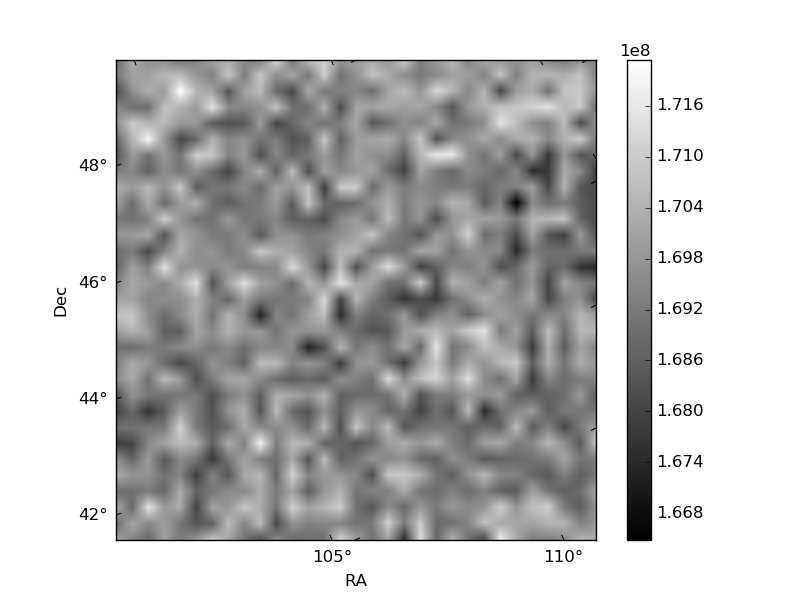
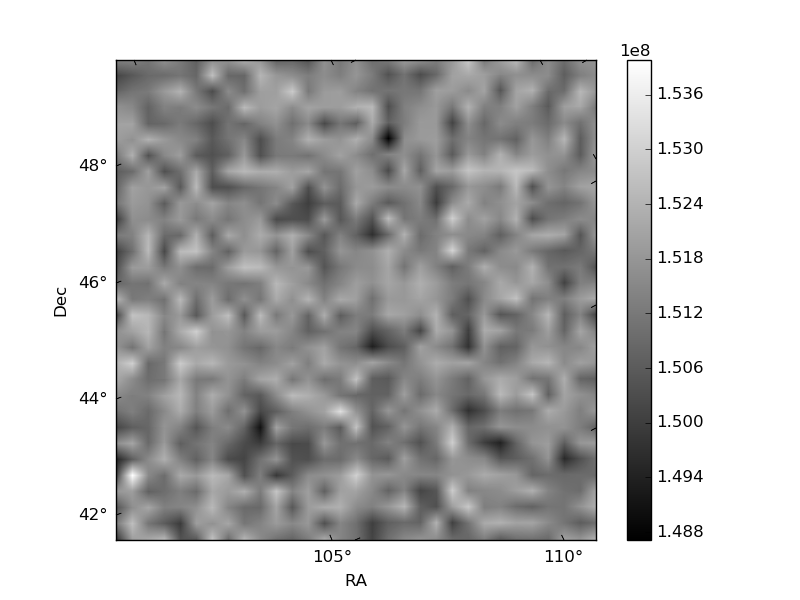
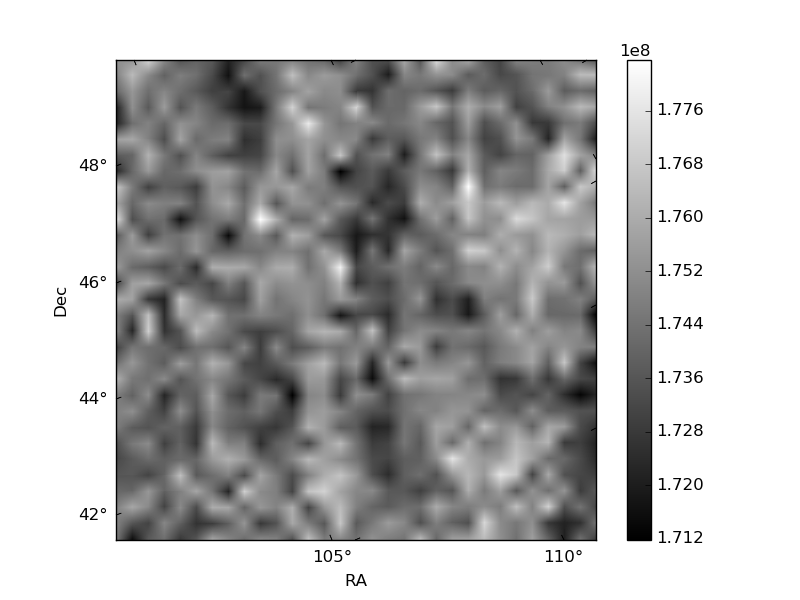
Histogram calculated using DETX and DETY for each event in the final _common_clean file
| Quadrant A | 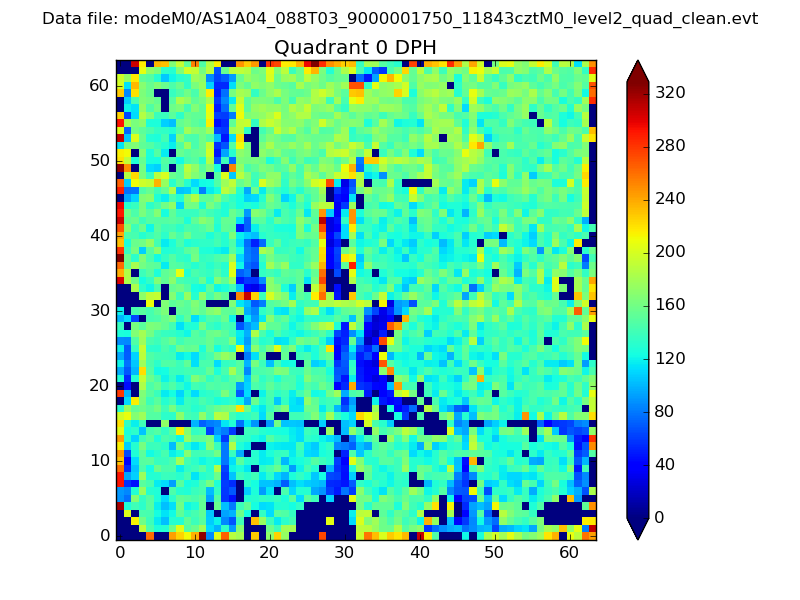 |
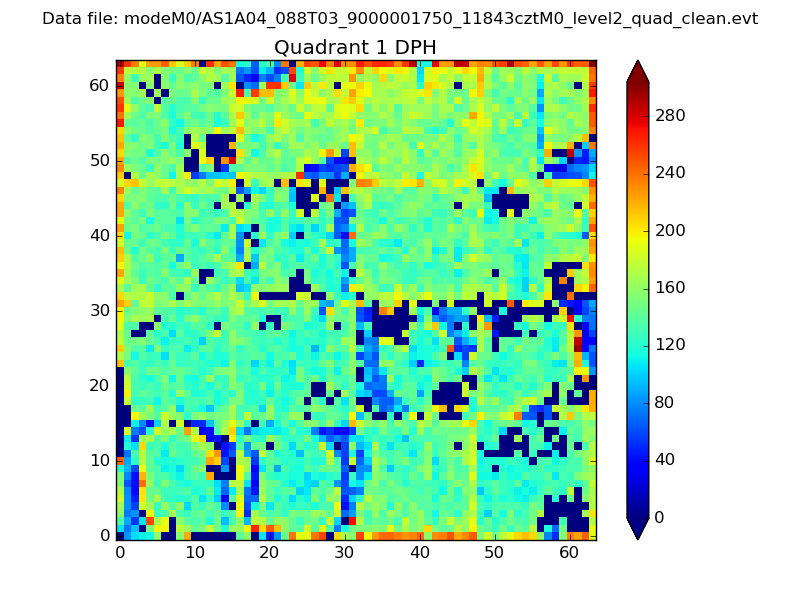 |
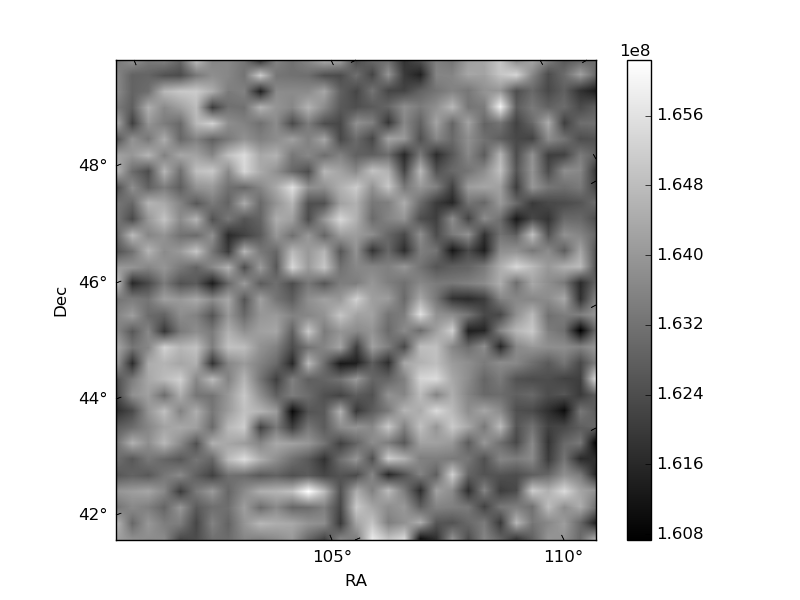
Quadrant B |
|---|---|---|---|
| Quadrant D | 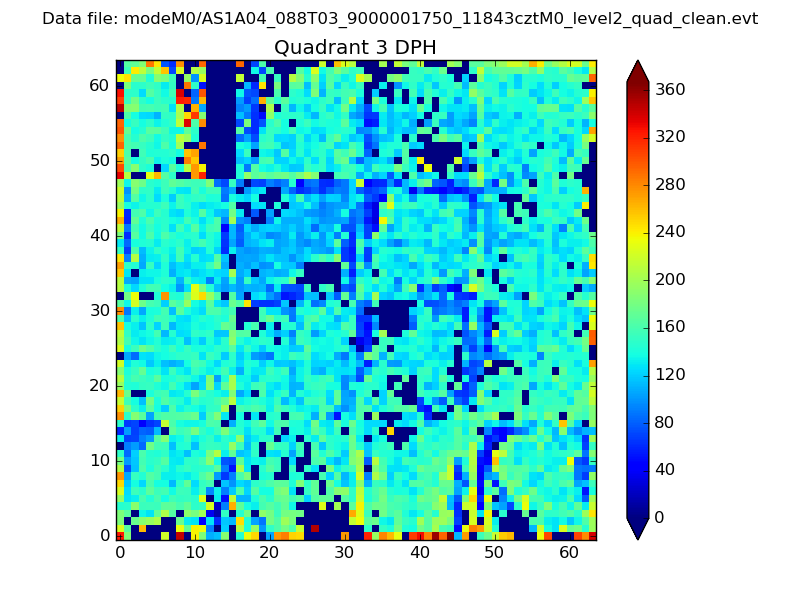 |
 |
Quadrant C |
| Plot type | Count rate plots | Images |
|---|---|---|
| Comparison with Poisson distribution Blue bars denote a histogram of data divided into 1 sec bins. Red curve is a Poisson curve with rate = median count rate of data. |
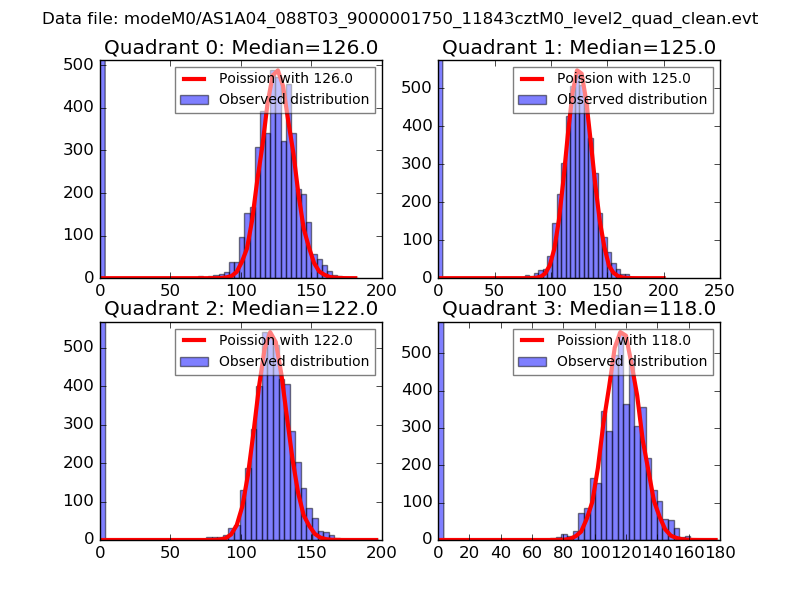 |
 |
| Quadrant-wise count rates Data is divided into 100 sec bins |
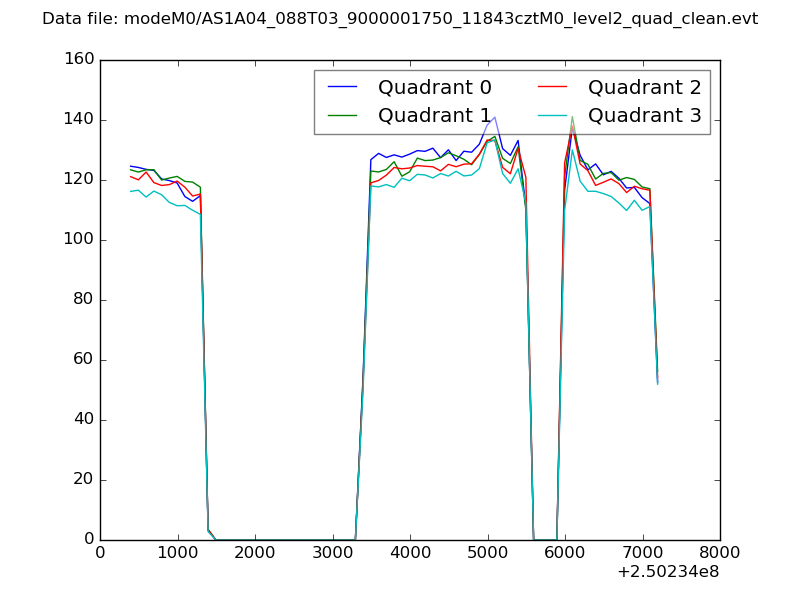 |
|
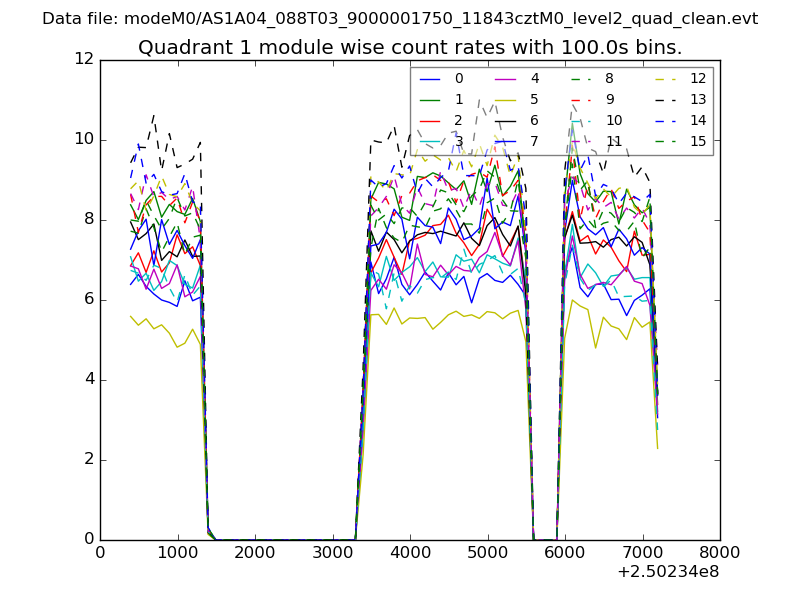
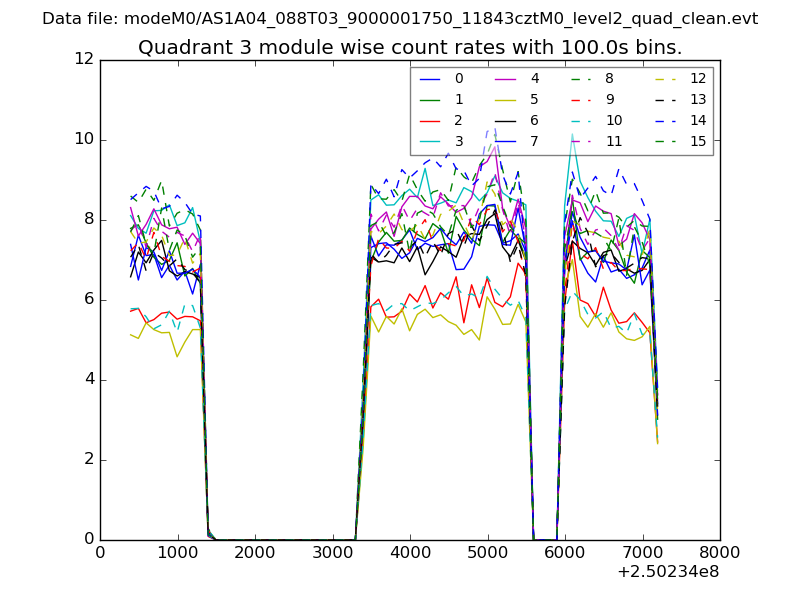
| Module-wise count rates for Quadrant A Data is divided into 100 sec bins |
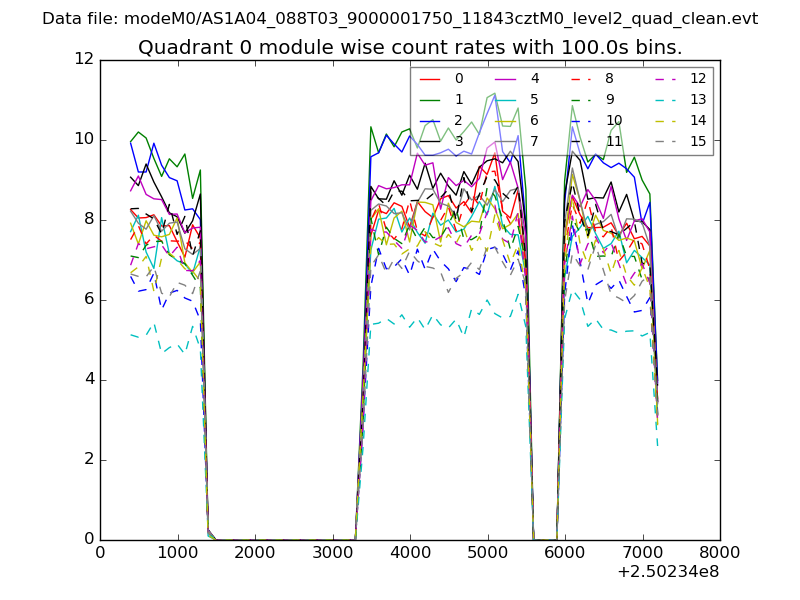 |
 |
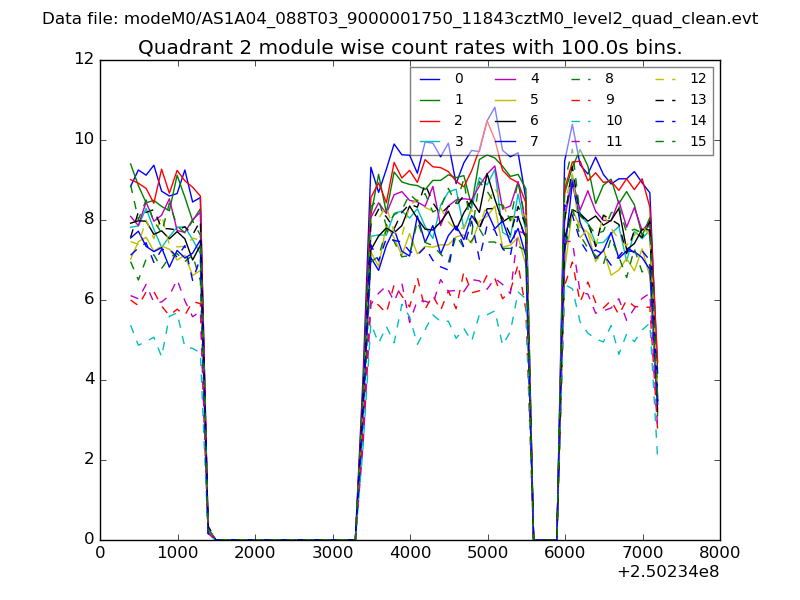
| Module-wise count rates for Quadrant B Data is divided into 100 sec bins |
 |
 |
| Module-wise count rates for Quadrant C Data is divided into 100 sec bins |
 |
 |
| Module-wise count rates for Quadrant D Data is divided into 100 sec bins |
 |
 |
| Parameter | Plot |
|---|---|
| CZT HV Monitor | 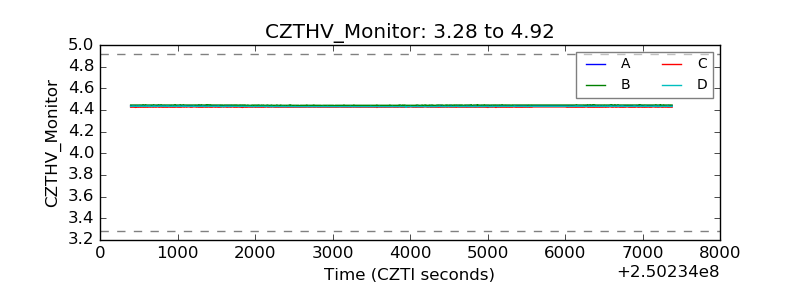 |
| D_VDD | 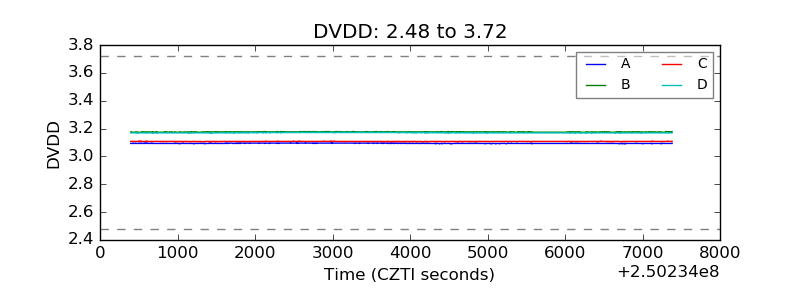 |
| Temperature 1 | 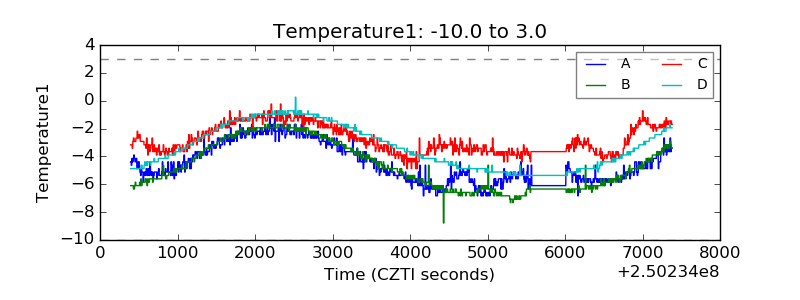 |
| Veto HV Monitor | 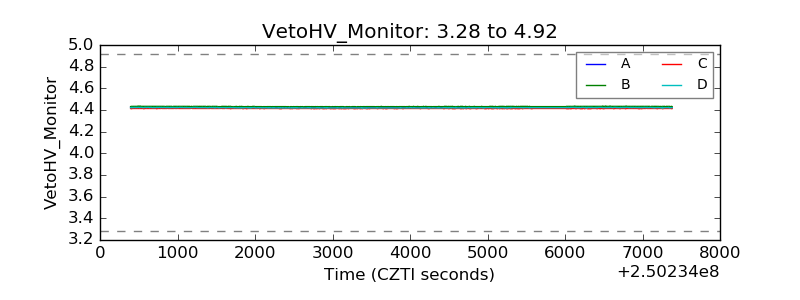 |
| Veto LLD |  |
| Alpha Counter | 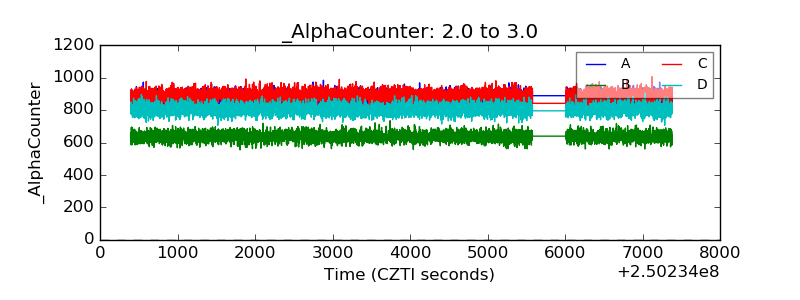 |
| _CPM_Rate | 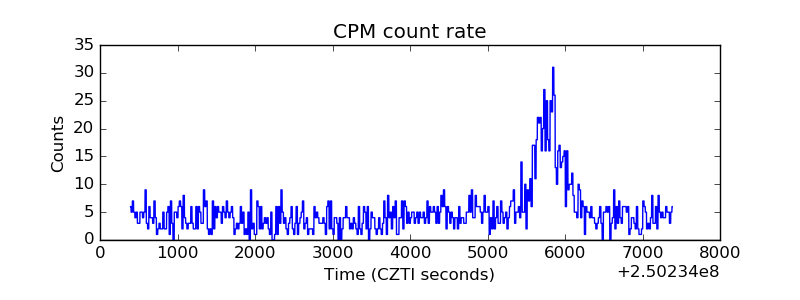 |
| CZT Counter | 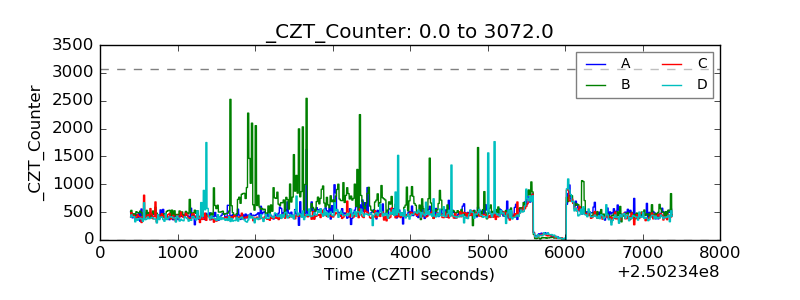 |
| +2.5 Volts monitor |  |
| +5 Volts monitor |  |
| _ROLL_ROT | 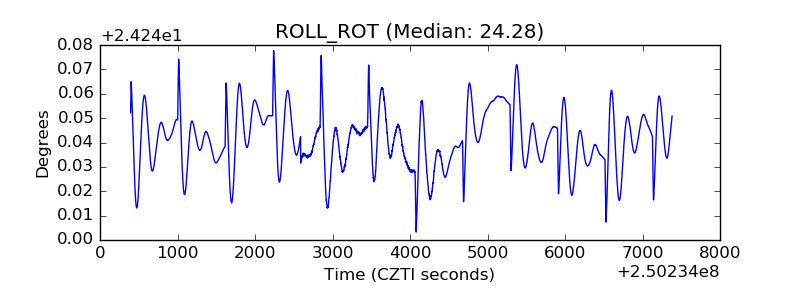 |
| _Roll_DEC | 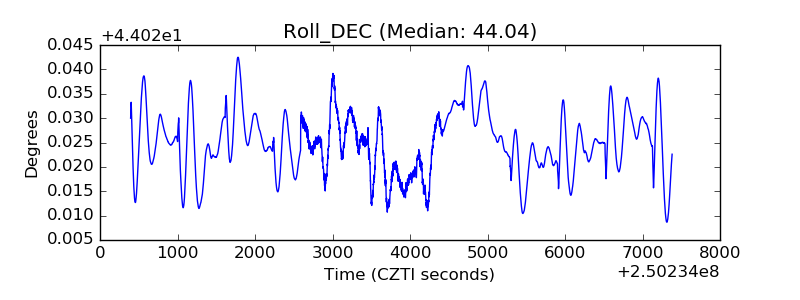 |
| _Roll_RA | 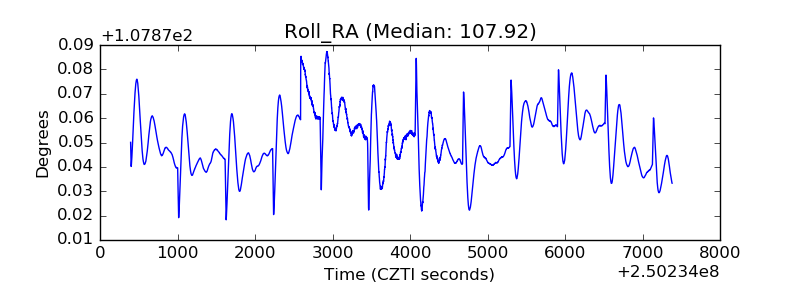 |
| Veto Counter | 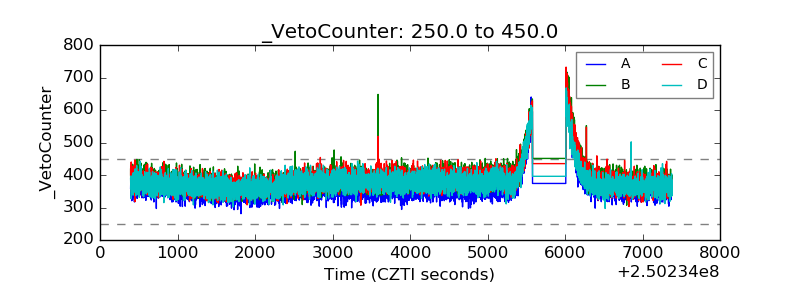 |