| Param | Original file | Final file |
|---|---|---|
| Filename | modeM0/AS1A04_088T03_9000001750_11844cztM0_level2.evt | modeM0/AS1A04_088T03_9000001750_11844cztM0_level2_quad_clean.evt |
| Size (bytes) | 574,300,800 | 101,845,440 |
| Size | 547.7 MB | 97.1 MB |
| Events in quadrant A | 4,069,789 | 643,941 |
| Events in quadrant B | 5,176,336 | 637,074 |
| Events in quadrant C | 3,673,415 | 634,974 |
| Events in quadrant D | 3,928,250 | 610,109 |
| Mode SS | |||
|---|---|---|---|
| Quadrant | BADHDUFLAG | Total packets | Discarded packets |
| A | 0 | 162 | 0 |
| B | 0 | 162 | 0 |
| C | 0 | 162 | 0 |
| D | 0 | 162 | 0 |
| Mode M0 | |||
|---|---|---|---|
| Quadrant | BADHDUFLAG | Total packets | Discarded packets |
| A | 0 | 17273 | 2 |
| B | 0 | 20676 | 1 |
| C | 0 | 16737 | 1 |
| D | 0 | 17400 | 1 |
| Mode M9 | |||
|---|---|---|---|
| Quadrant | BADHDUFLAG | Total packets | Discarded packets |
| A | 0 | 5 | 0 |
| B | 0 | 5 | 0 |
| C | 0 | 5 | 0 |
| D | 0 | 5 | 0 |
| Quadrant | Total seconds | Saturated seconds | Saturation percentage |
|---|---|---|---|
| A | 8027 | 400 | 4.983182% |
| B | 8027 | 568 | 7.076118% |
| C | 8027 | 233 | 2.902703% |
| D | 8027 | 278 | 3.463311% |
Noise dominated data is calculated using 1-second bins in cleaned event files. If a bin has >2000 counts, and if more than 50% of those come from <1% of pixels, then it is considered to be noise-dominated and hence unusable.
| Quadrant | # 1 sec bins | Bins with >0 counts | Bins with >2000 counts | High rate bins dominated by noise | Noise dominated (total time) | Noise dominated (detector-on time) | Marked lightcurve |
|---|---|---|---|---|---|---|---|
| A | 8458 | 8029 | 2 | 2 | 0.02% | 0.02% | 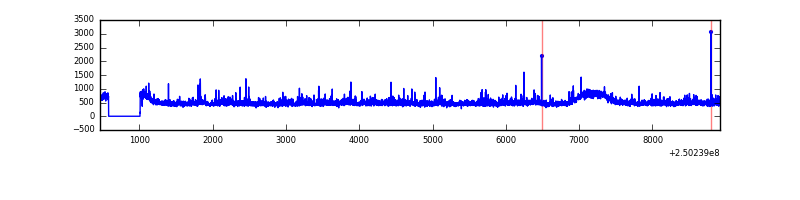 |
| B | 8458 | 8029 | 126 | 126 | 1.49% | 1.57% |  |
| C | 8458 | 8029 | 0 | 0 | 0.00% | 0.00% | 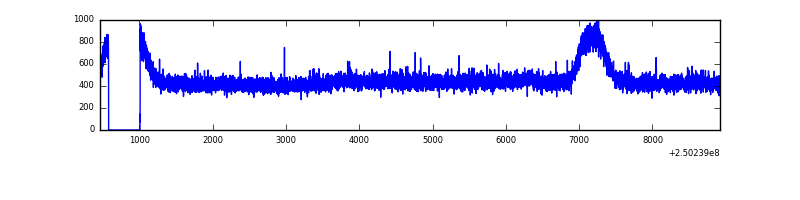 |
| D | 8458 | 8029 | 29 | 29 | 0.34% | 0.36% |  |
Top three noisy pixels from each quadrant. If the there are fewer than three noisy pixels in the level2.evt file, extra rows are filled as -1
| Pixel properties | Quadrant properties | ||||||
|---|---|---|---|---|---|---|---|
| Quadrant | DetID | PixID | Counts | Sigma | Mean | Median | Sigma |
| A | 1 | 162 | 118556 | 585.07 | 975 | 954 | 201.0 |
| A | 1 | 178 | 61614 | 301.78 | 975 | 954 | 201.0 |
| A | 1 | 161 | 53595 | 261.89 | 975 | 954 | 201.0 |
| B | 4 | 239 | 575976 | 3118.5 | 960 | 937 | 184.4 |
| B | 15 | 204 | 347278 | 1878.25 | 960 | 937 | 184.4 |
| B | 3 | 64 | 290373 | 1569.65 | 960 | 937 | 184.4 |
| C | 13 | 61 | 6997 | 27.77 | 941 | 940 | 218.1 |
| C | 12 | 4 | 2437 | 6.86 | 941 | 940 | 218.1 |
| C | 3 | 202 | 2306 | 6.26 | 941 | 940 | 218.1 |
| D | 13 | 104 | 128126 | 564.75 | 938 | 906 | 225.3 |
| D | 1 | 52 | 77344 | 339.32 | 938 | 906 | 225.3 |
| D | 9 | 85 | 57239 | 250.07 | 938 | 906 | 225.3 |
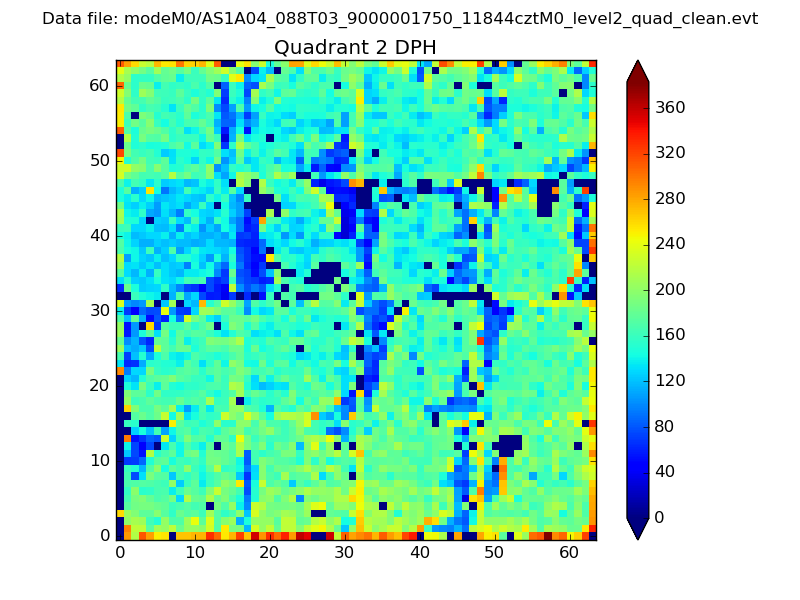
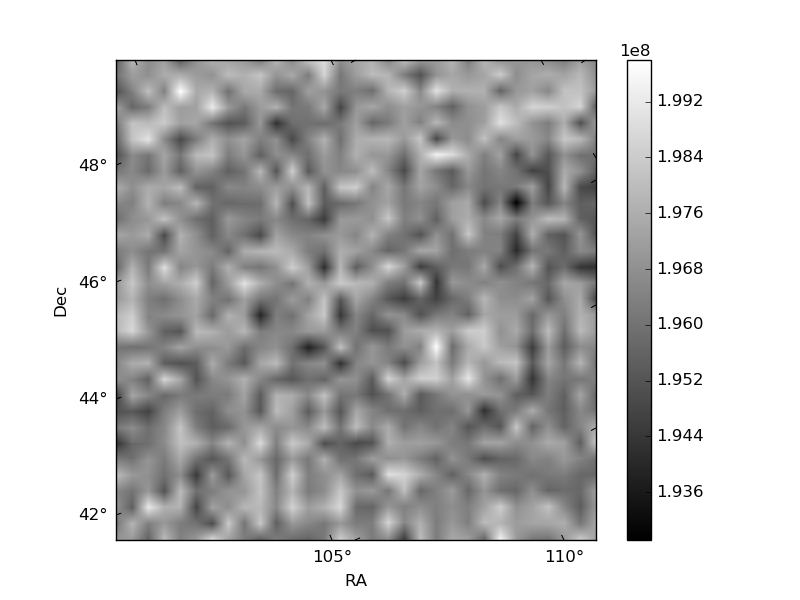
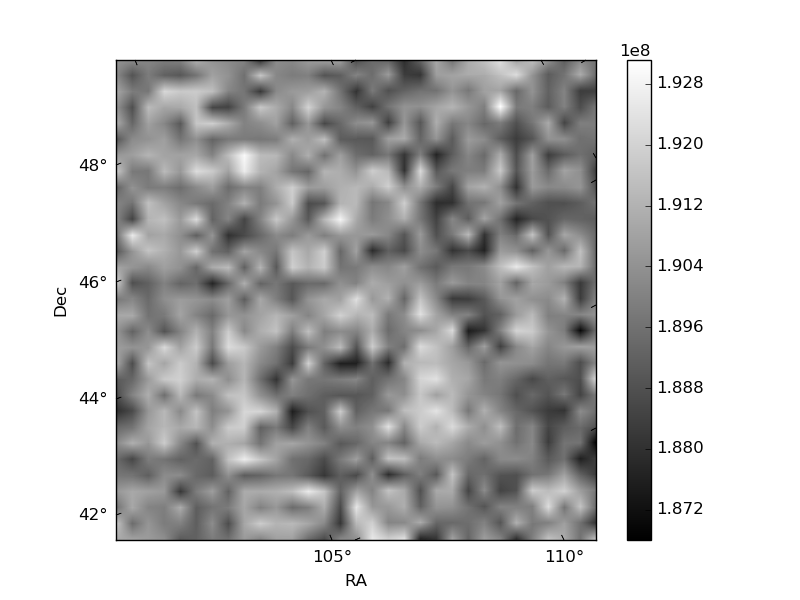
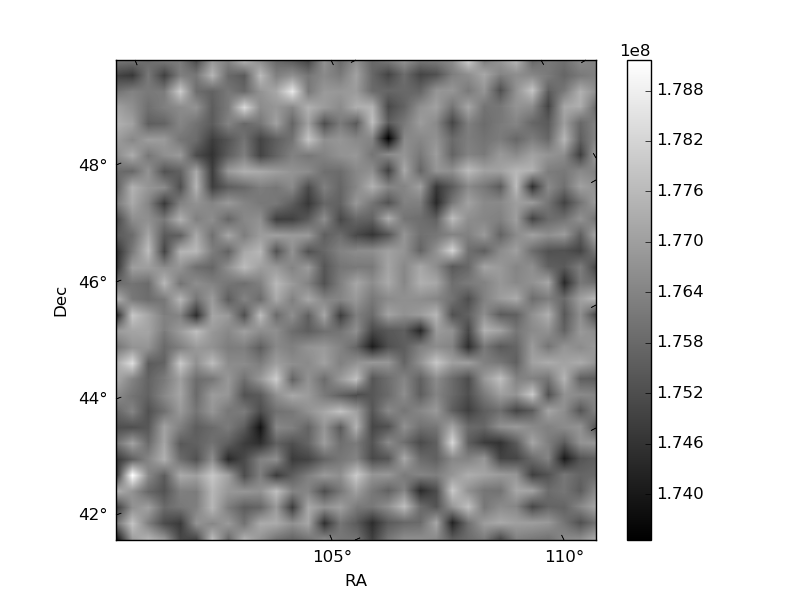
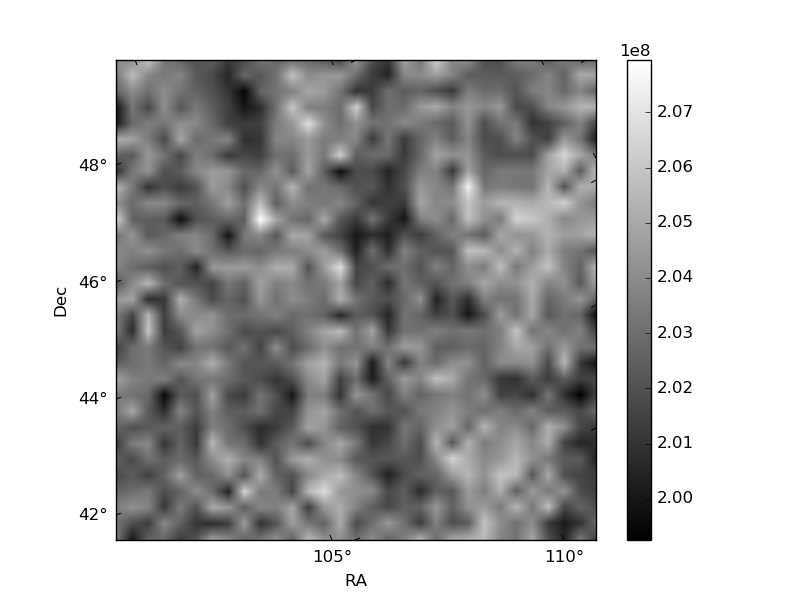
Histogram calculated using DETX and DETY for each event in the final _common_clean file
| Quadrant A | 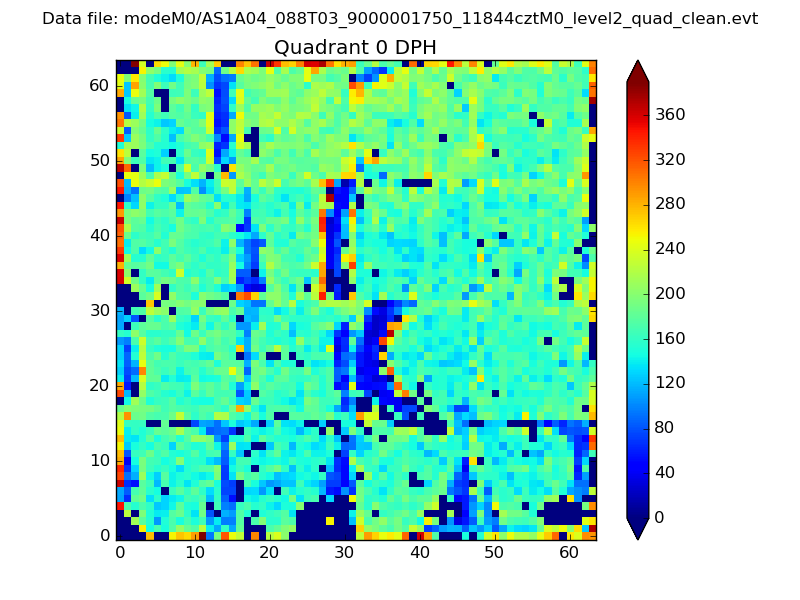 |
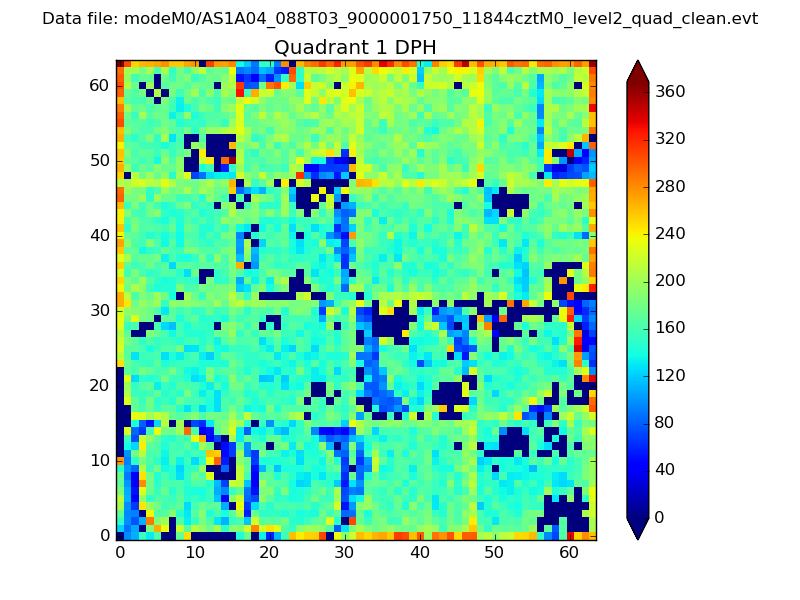 |
Quadrant B |
|---|---|---|---|
| Quadrant D | 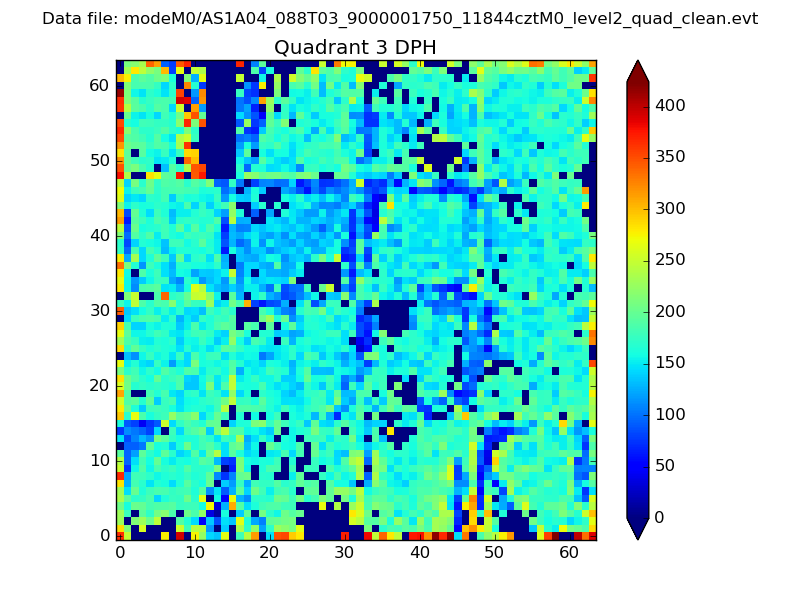 |
 |
Quadrant C |
| Plot type | Count rate plots | Images |
|---|---|---|
| Comparison with Poisson distribution Blue bars denote a histogram of data divided into 1 sec bins. Red curve is a Poisson curve with rate = median count rate of data. |
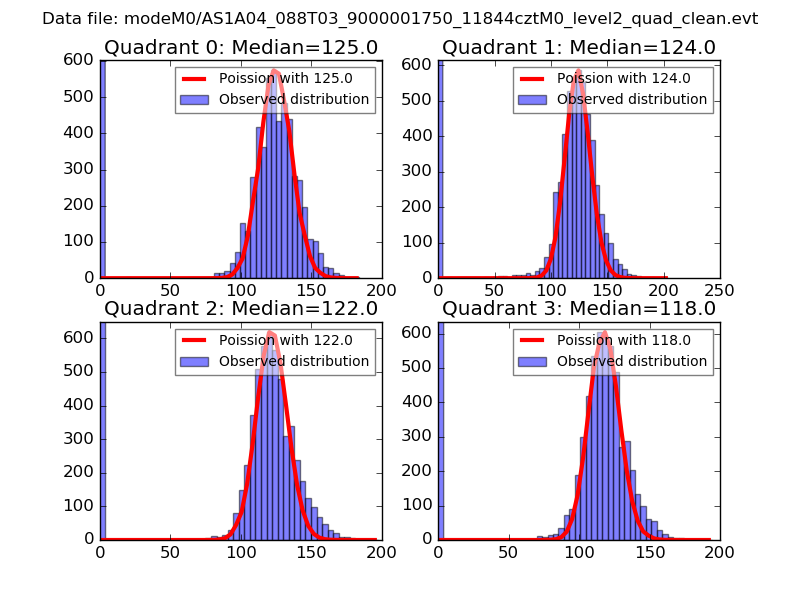 |
 |
| Quadrant-wise count rates Data is divided into 100 sec bins |
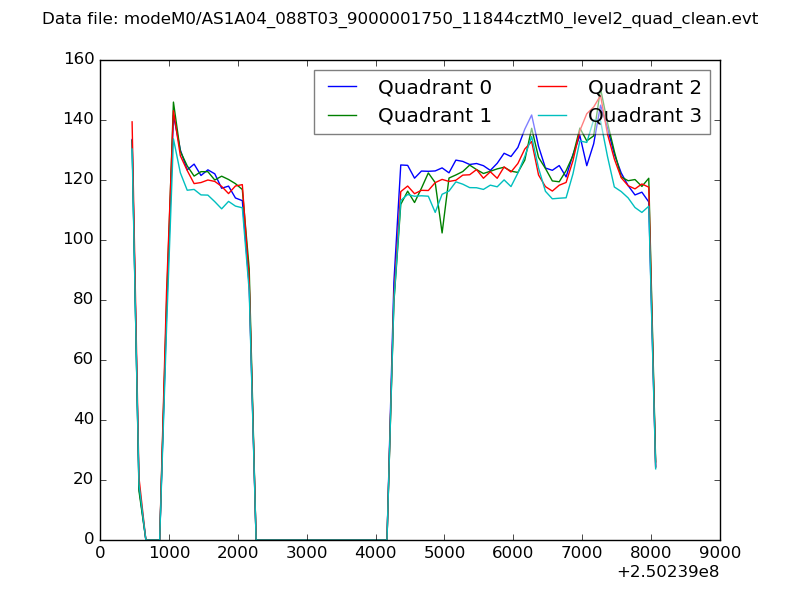 |
|
| Module-wise count rates for Quadrant A Data is divided into 100 sec bins |
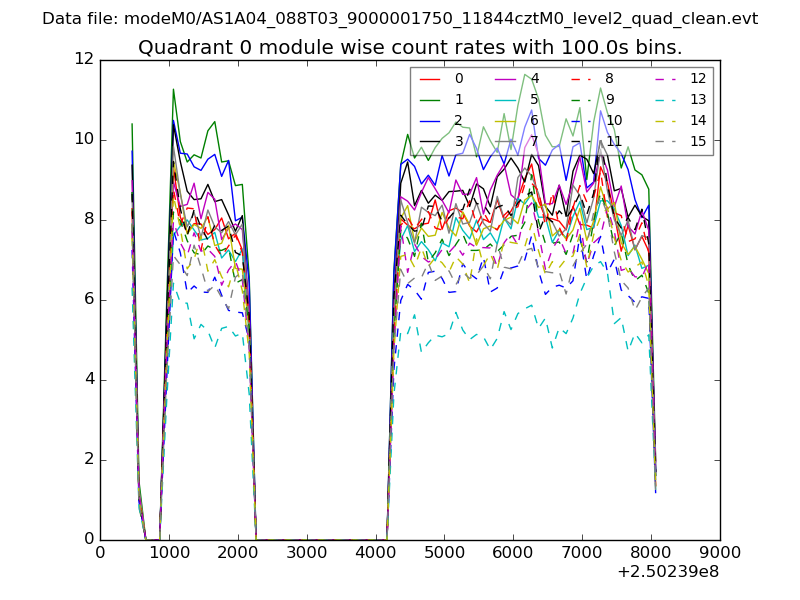 |
 |
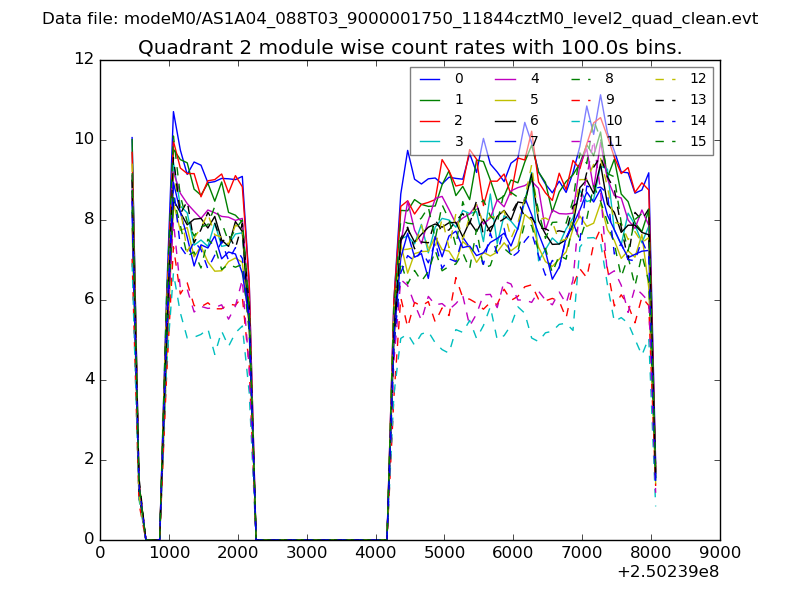
| Module-wise count rates for Quadrant B Data is divided into 100 sec bins |
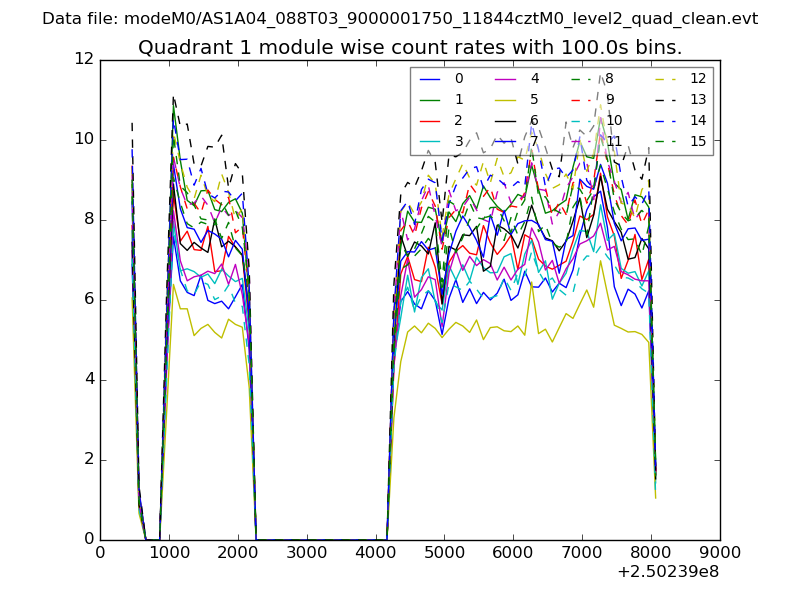 |
 |
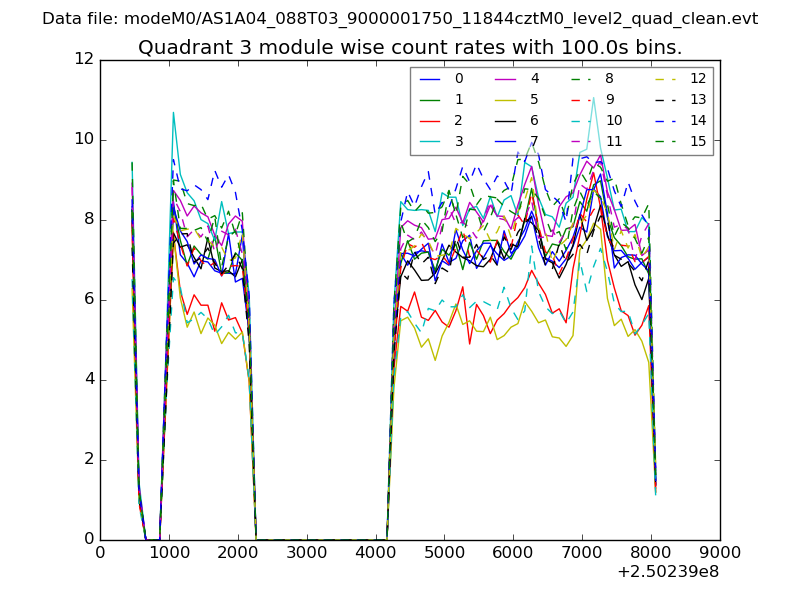
| Module-wise count rates for Quadrant C Data is divided into 100 sec bins |
 |
 |
| Module-wise count rates for Quadrant D Data is divided into 100 sec bins |
 |
 |
| Parameter | Plot |
|---|---|
| CZT HV Monitor | 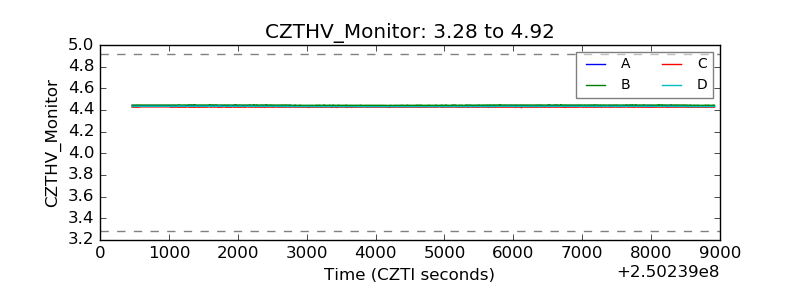 |
| D_VDD | 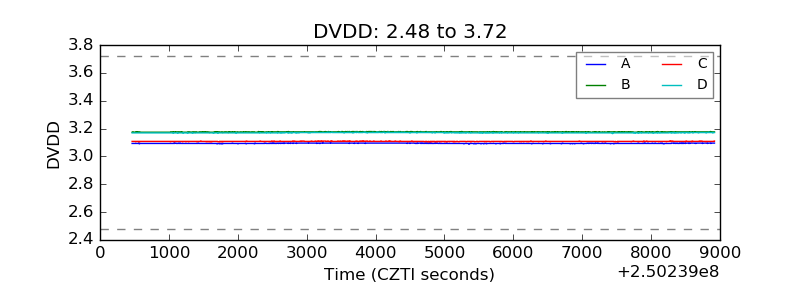 |
| Temperature 1 | 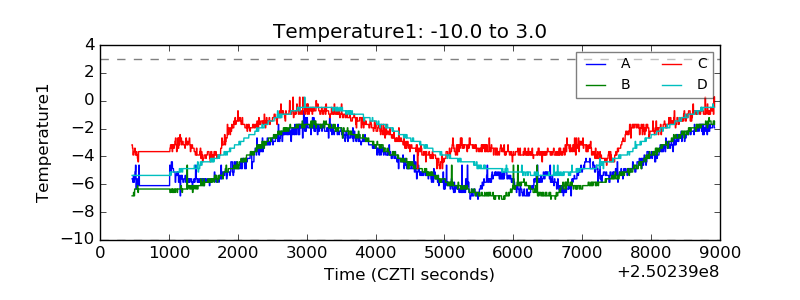 |
| Veto HV Monitor | 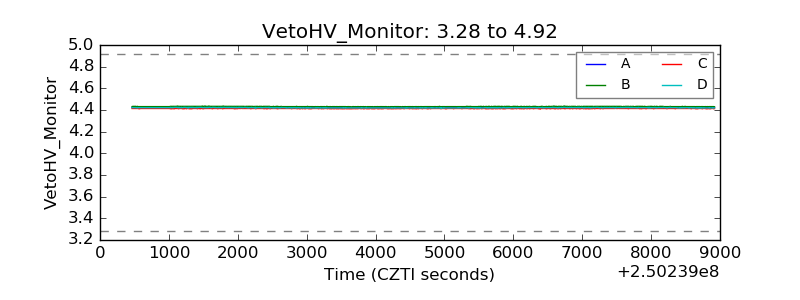 |
| Veto LLD | 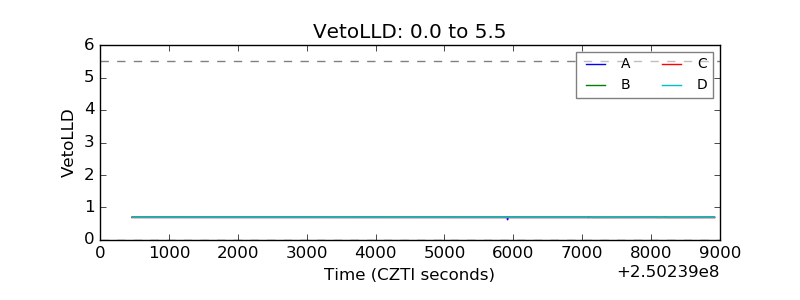 |
| Alpha Counter | 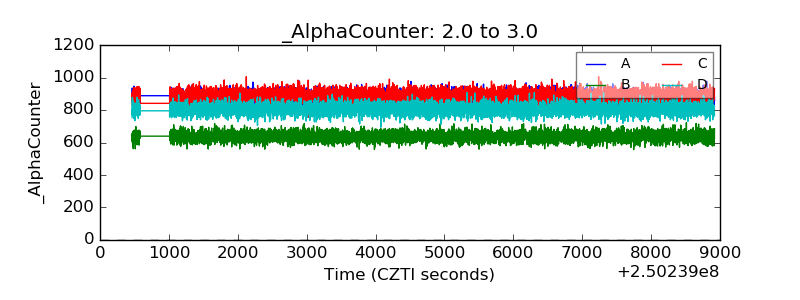 |
| _CPM_Rate | 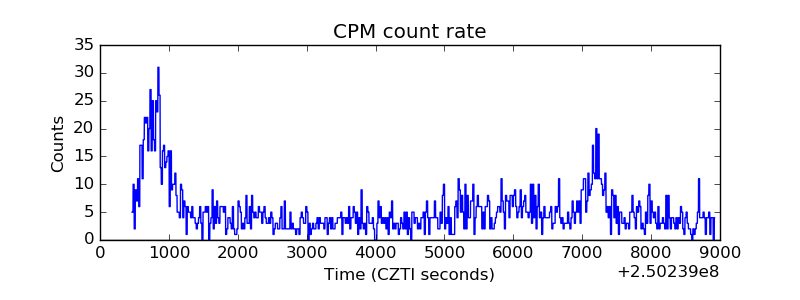 |
| CZT Counter | 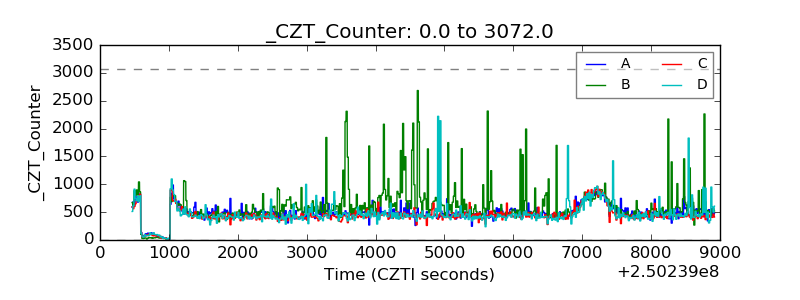 |
| +2.5 Volts monitor |  |
| +5 Volts monitor | 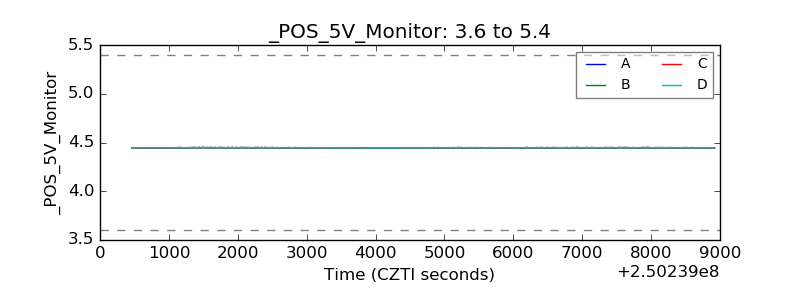 |
| _ROLL_ROT | 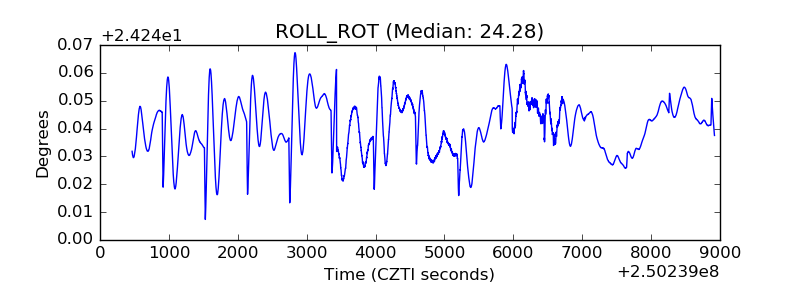 |
| _Roll_DEC | 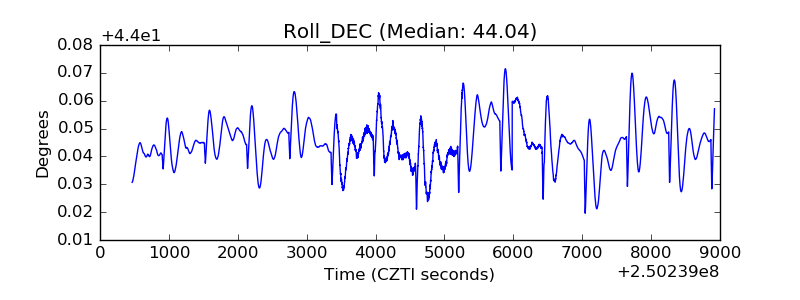 |
| _Roll_RA | 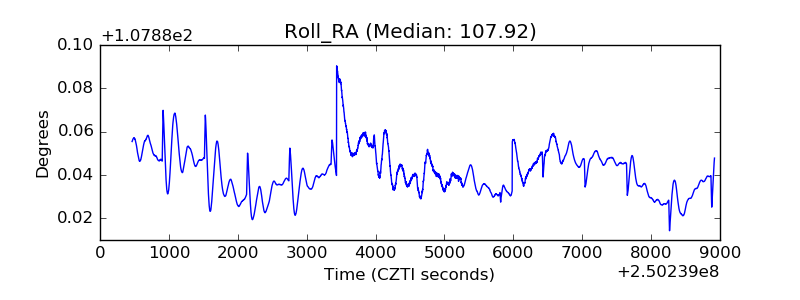 |
| Veto Counter | 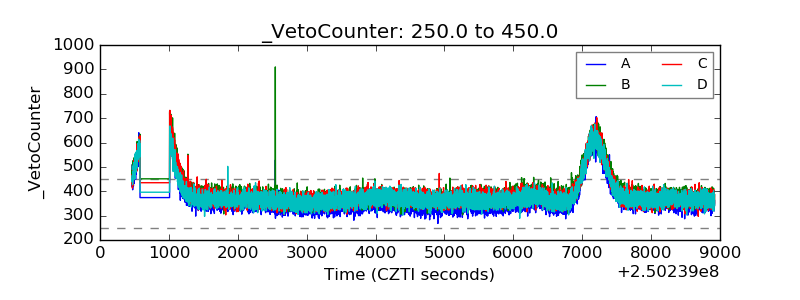 |