| Param | Original file | Final file |
|---|---|---|
| Filename | modeM0/AS1A04_088T03_9000001750_11845cztM0_level2.evt | modeM0/AS1A04_088T03_9000001750_11845cztM0_level2_quad_clean.evt |
| Size (bytes) | 582,641,280 | 90,077,760 |
| Size | 555.7 MB | 85.9 MB |
| Events in quadrant A | 3,943,194 | 560,815 |
| Events in quadrant B | 5,508,815 | 542,854 |
| Events in quadrant C | 3,533,508 | 552,958 |
| Events in quadrant D | 4,130,153 | 527,845 |
| Mode SS | |||
|---|---|---|---|
| Quadrant | BADHDUFLAG | Total packets | Discarded packets |
| A | 0 | 158 | 0 |
| B | 0 | 158 | 0 |
| C | 0 | 158 | 0 |
| D | 0 | 158 | 0 |
| Mode M0 | |||
|---|---|---|---|
| Quadrant | BADHDUFLAG | Total packets | Discarded packets |
| A | 0 | 16697 | 3 |
| B | 0 | 21603 | 2 |
| C | 0 | 16123 | 2 |
| D | 0 | 17734 | 2 |
| Mode M9 | |||
|---|---|---|---|
| Quadrant | BADHDUFLAG | Total packets | Discarded packets |
| A | 0 | 1 | 0 |
| B | 0 | 1 | 0 |
| C | 0 | 1 | 0 |
| D | 0 | 1 | 0 |
| Quadrant | Total seconds | Saturated seconds | Saturation percentage |
|---|---|---|---|
| A | 7805 | 278 | 3.561819% |
| B | 7805 | 619 | 7.930814% |
| C | 7805 | 185 | 2.370275% |
| D | 7805 | 301 | 3.856502% |
Noise dominated data is calculated using 1-second bins in cleaned event files. If a bin has >2000 counts, and if more than 50% of those come from <1% of pixels, then it is considered to be noise-dominated and hence unusable.
| Quadrant | # 1 sec bins | Bins with >0 counts | Bins with >2000 counts | High rate bins dominated by noise | Noise dominated (total time) | Noise dominated (detector-on time) | Marked lightcurve |
|---|---|---|---|---|---|---|---|
| A | 7946 | 7808 | 2 | 2 | 0.03% | 0.03% | 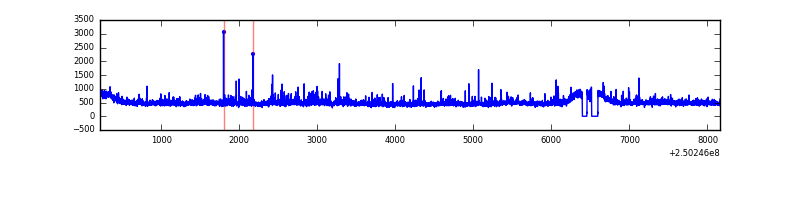 |
| B | 7946 | 7808 | 228 | 228 | 2.87% | 2.92% | 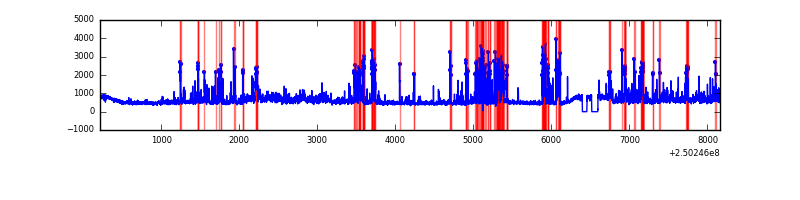 |
| C | 7946 | 7808 | 0 | 0 | 0.00% | 0.00% | 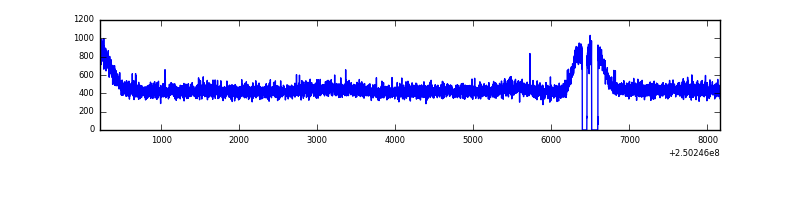 |
| D | 7946 | 7808 | 87 | 87 | 1.09% | 1.11% | 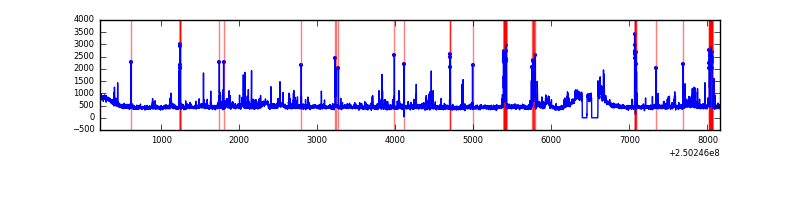 |
Top three noisy pixels from each quadrant. If the there are fewer than three noisy pixels in the level2.evt file, extra rows are filled as -1
| Pixel properties | Quadrant properties | ||||||
|---|---|---|---|---|---|---|---|
| Quadrant | DetID | PixID | Counts | Sigma | Mean | Median | Sigma |
| A | 1 | 162 | 125261 | 641.2 | 942 | 920 | 193.9 |
| A | 1 | 178 | 63738 | 323.94 | 942 | 920 | 193.9 |
| A | 1 | 161 | 55760 | 282.8 | 942 | 920 | 193.9 |
| B | 4 | 239 | 566986 | 3222.09 | 921 | 899 | 175.7 |
| B | 3 | 64 | 556548 | 3162.68 | 921 | 899 | 175.7 |
| B | 15 | 204 | 386469 | 2194.61 | 921 | 899 | 175.7 |
| C | 13 | 61 | 6677 | 27.51 | 905 | 907 | 209.8 |
| C | 3 | 202 | 2323 | 6.75 | 905 | 907 | 209.8 |
| C | 12 | 4 | 2152 | 5.93 | 905 | 907 | 209.8 |
| D | 13 | 122 | 239425 | 1104.6 | 901 | 873 | 216.0 |
| D | 1 | 52 | 166807 | 768.34 | 901 | 873 | 216.0 |
| D | 13 | 104 | 103630 | 475.81 | 901 | 873 | 216.0 |
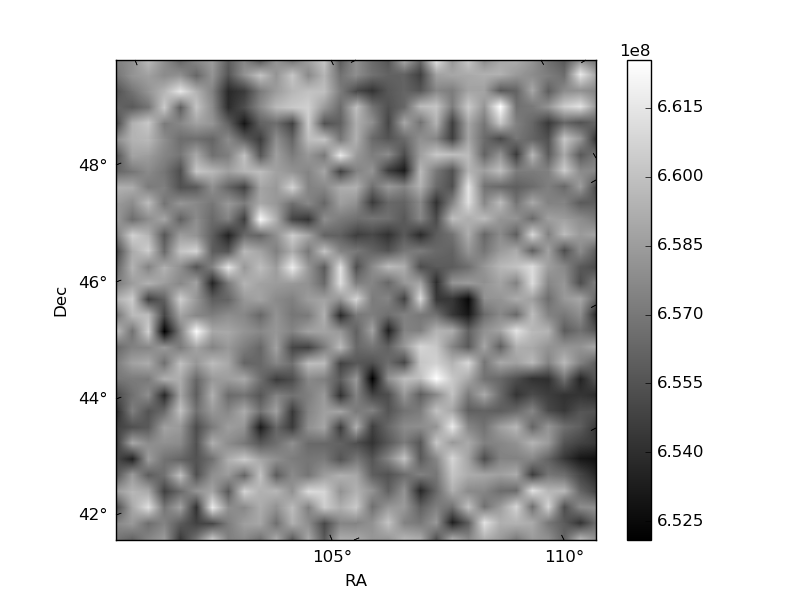
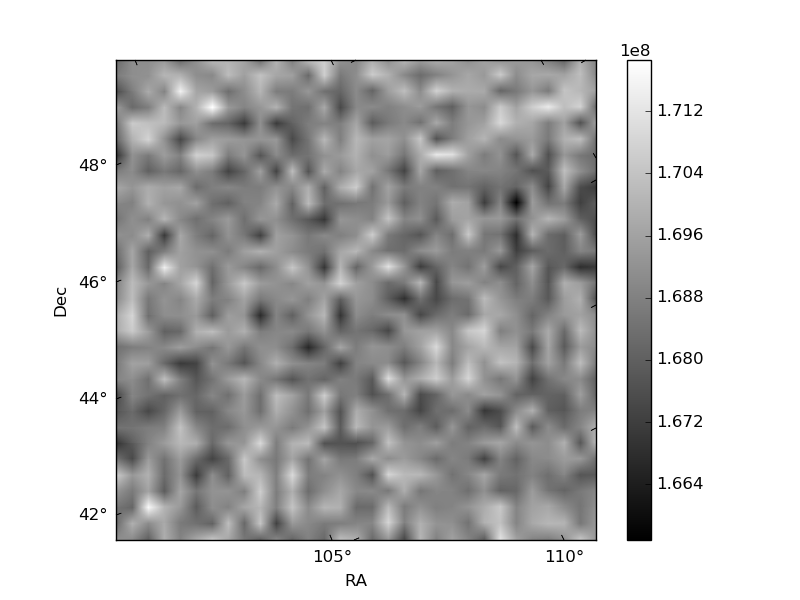
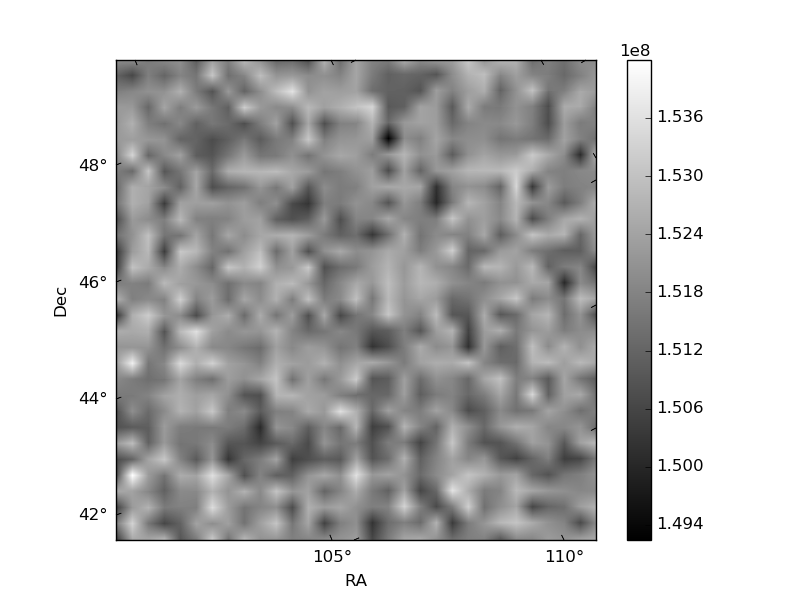
Histogram calculated using DETX and DETY for each event in the final _common_clean file
| Quadrant A | 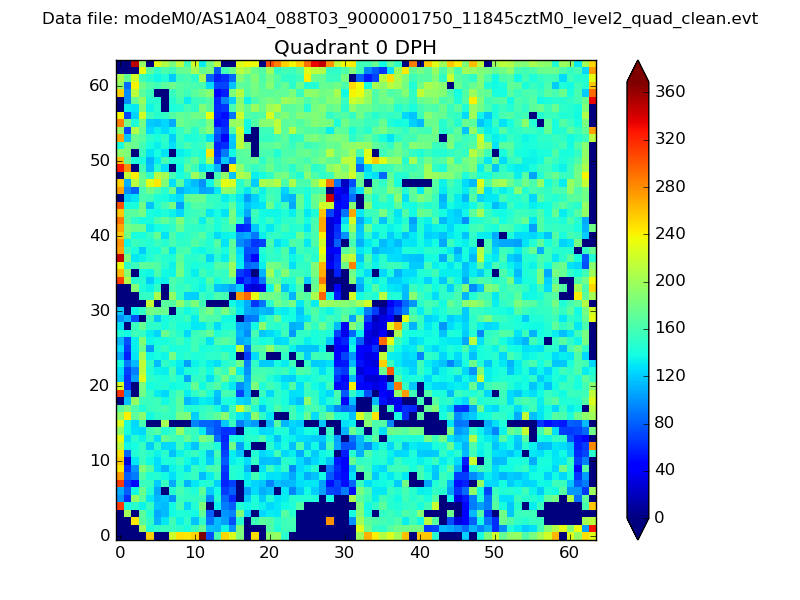 |
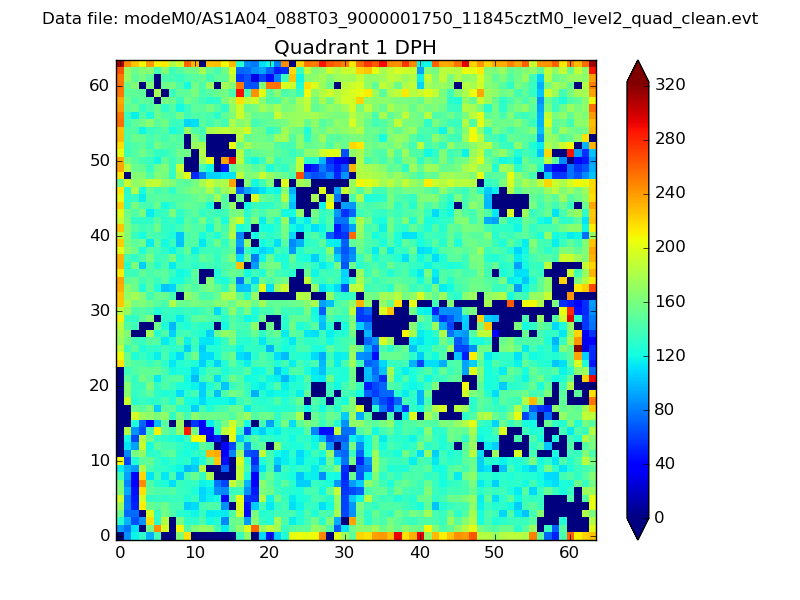 |
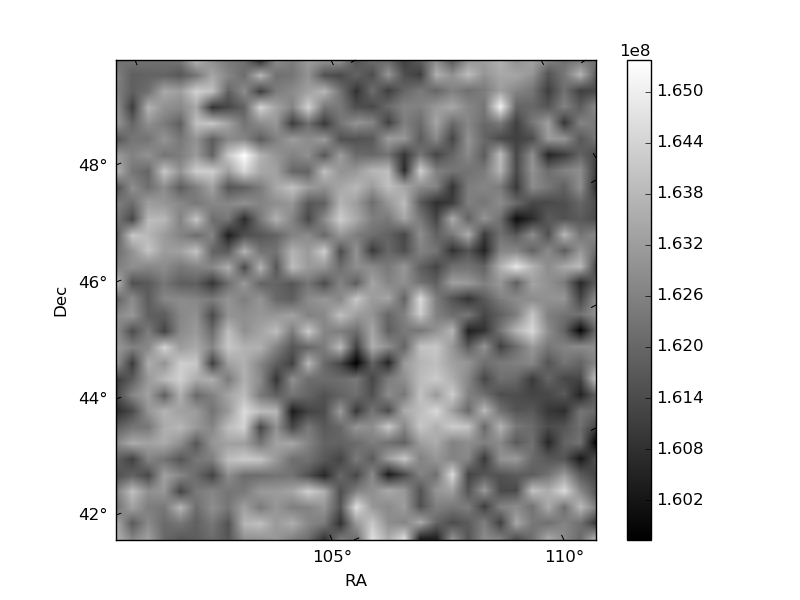
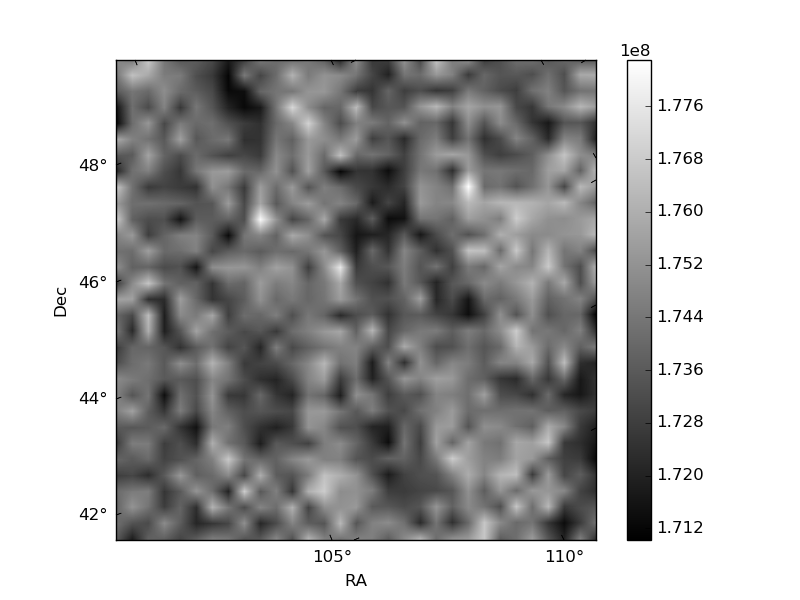
Quadrant B |
|---|---|---|---|
| Quadrant D | 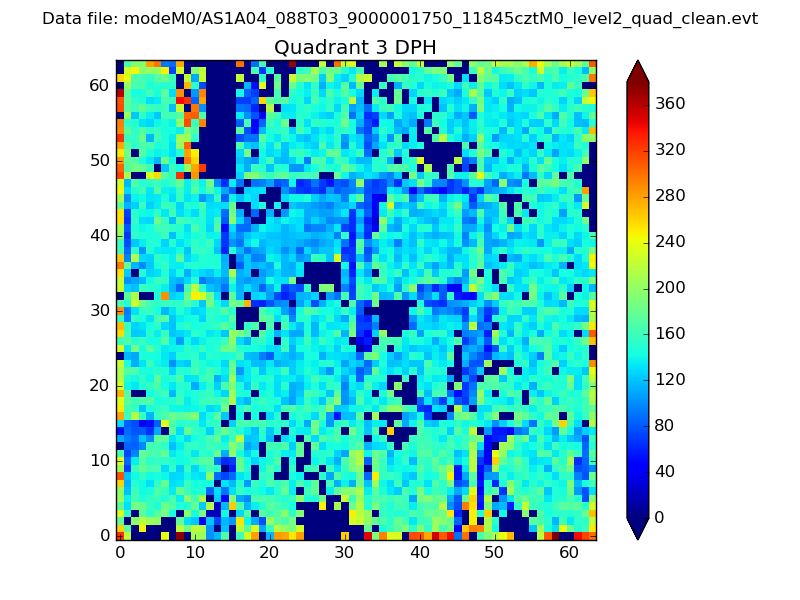 |
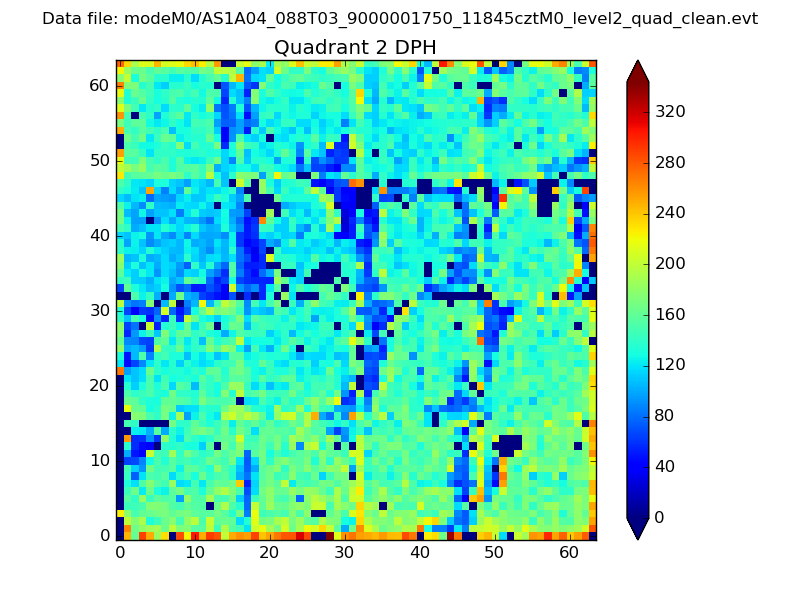 |
Quadrant C |
| Plot type | Count rate plots | Images |
|---|---|---|
| Comparison with Poisson distribution Blue bars denote a histogram of data divided into 1 sec bins. Red curve is a Poisson curve with rate = median count rate of data. |
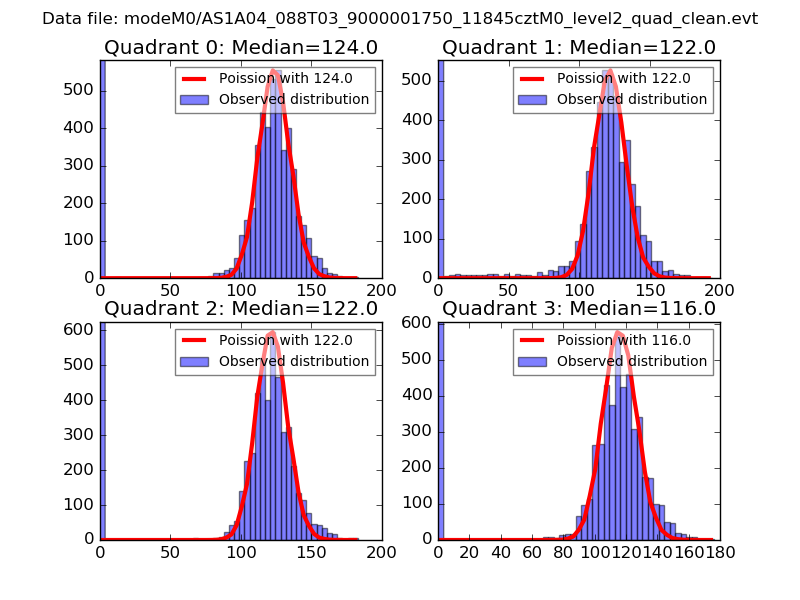 |
 |
| Quadrant-wise count rates Data is divided into 100 sec bins |
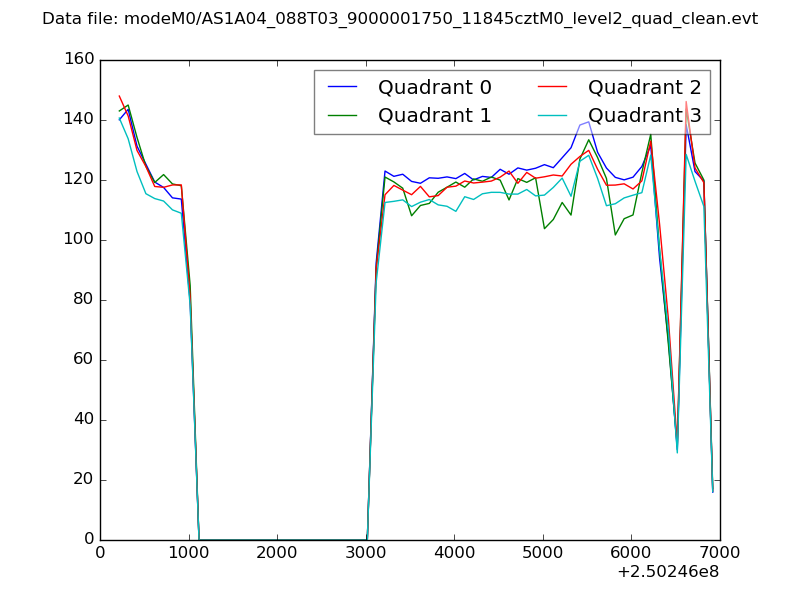 |
|
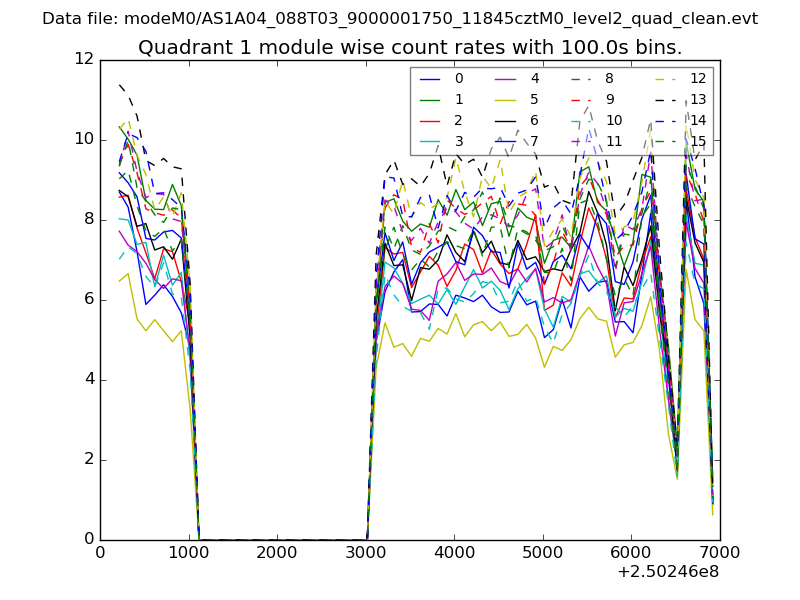
| Module-wise count rates for Quadrant A Data is divided into 100 sec bins |
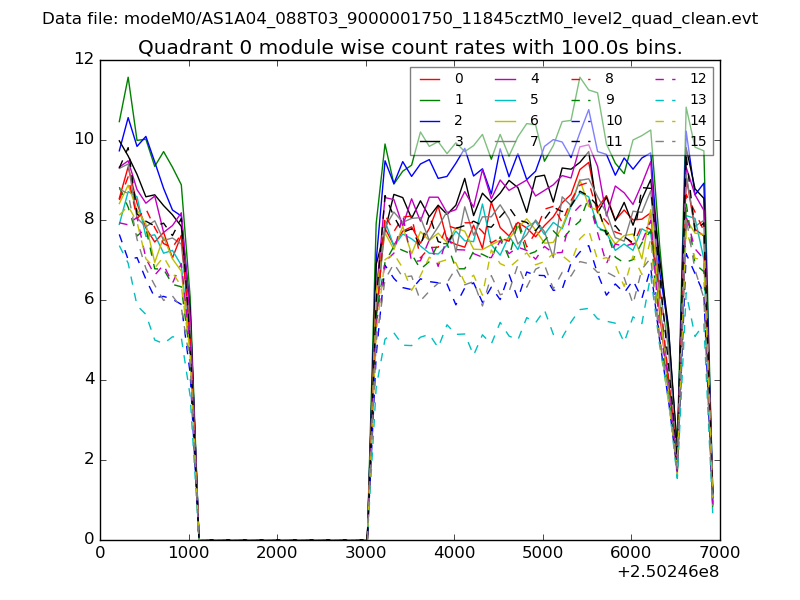 |
 |
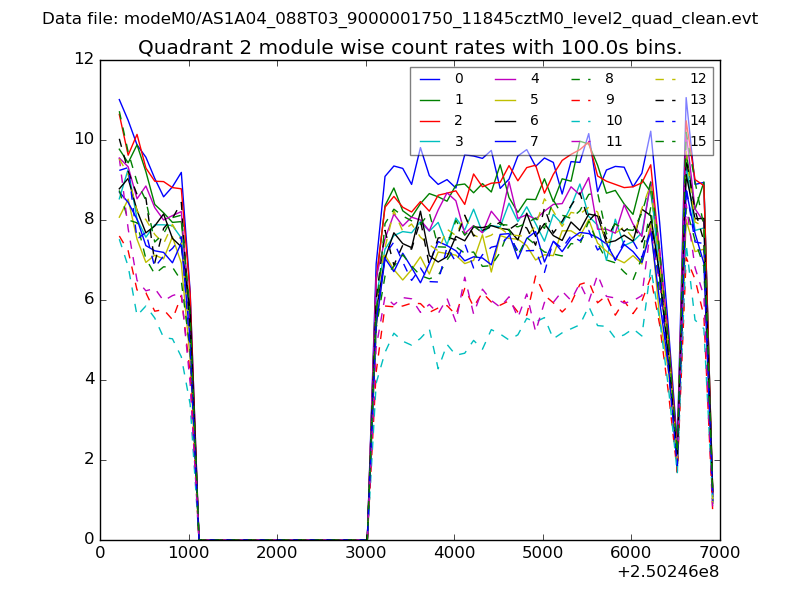
| Module-wise count rates for Quadrant B Data is divided into 100 sec bins |
 |
 |
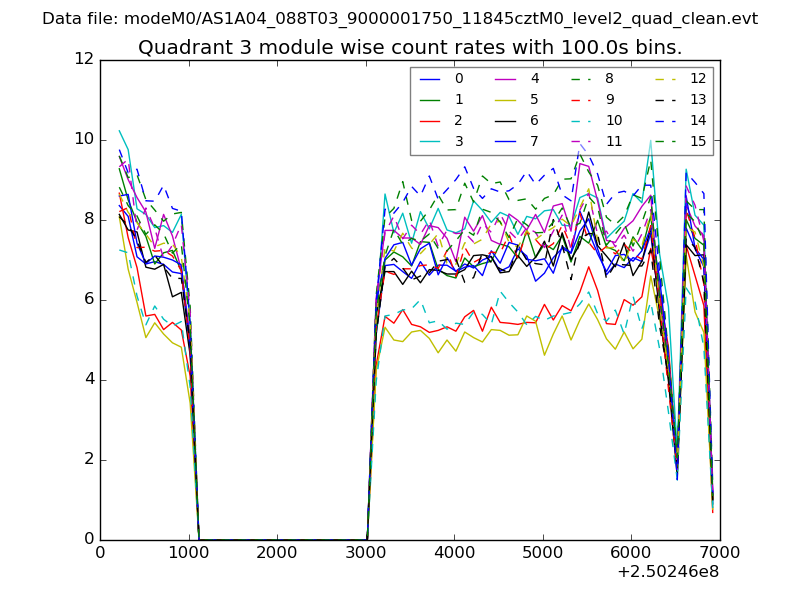
| Module-wise count rates for Quadrant C Data is divided into 100 sec bins |
 |
 |
| Module-wise count rates for Quadrant D Data is divided into 100 sec bins |
 |
 |
| Parameter | Plot |
|---|---|
| CZT HV Monitor | 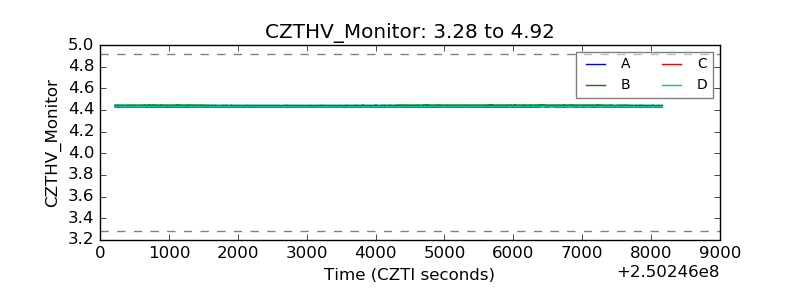 |
| D_VDD | 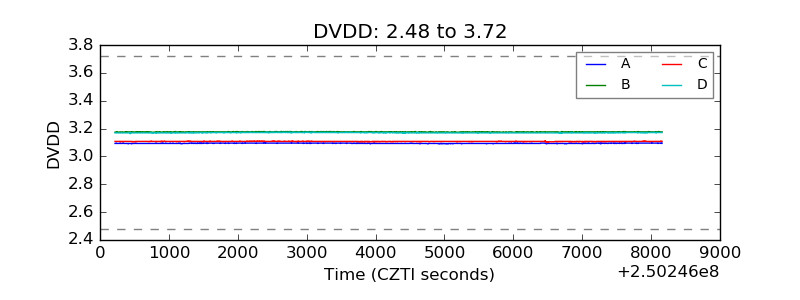 |
| Temperature 1 | 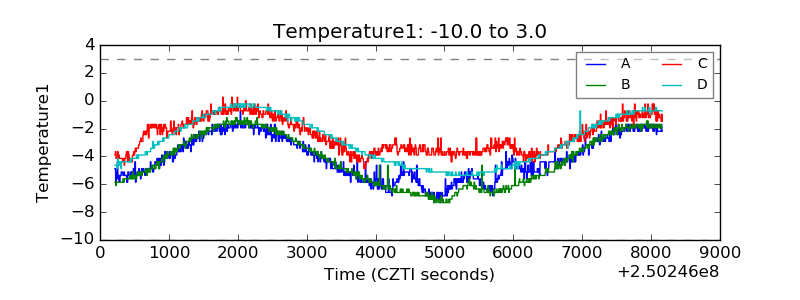 |
| Veto HV Monitor | 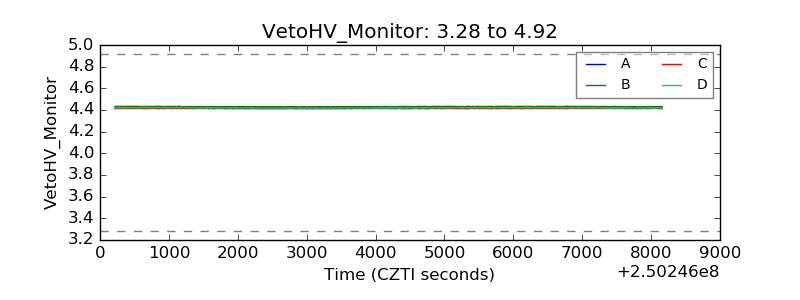 |
| Veto LLD |  |
| Alpha Counter | 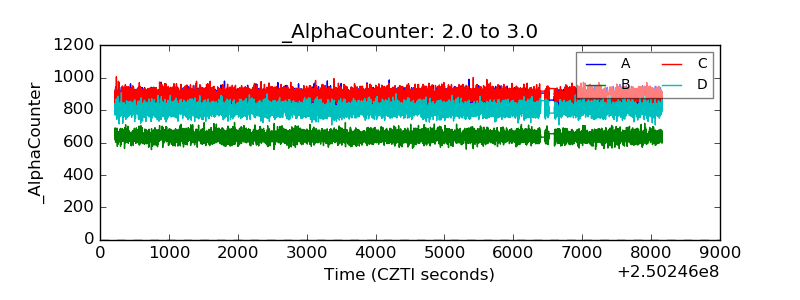 |
| _CPM_Rate | 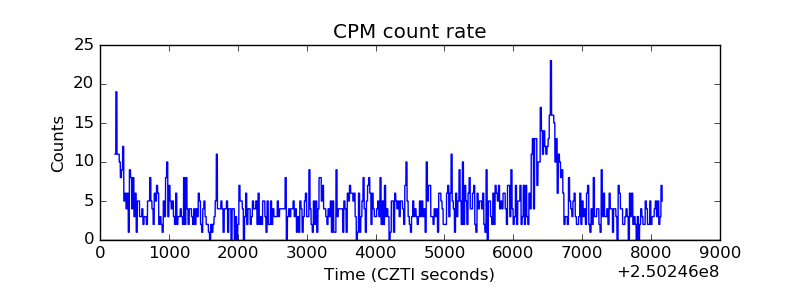 |
| CZT Counter | 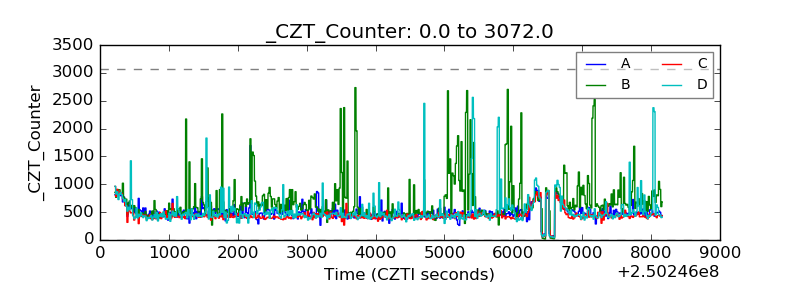 |
| +2.5 Volts monitor |  |
| +5 Volts monitor |  |
| _ROLL_ROT | 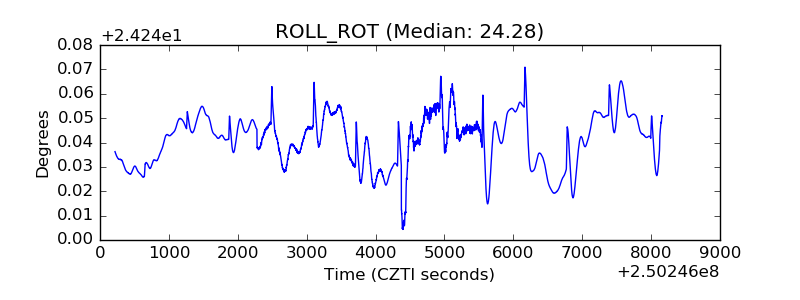 |
| _Roll_DEC | 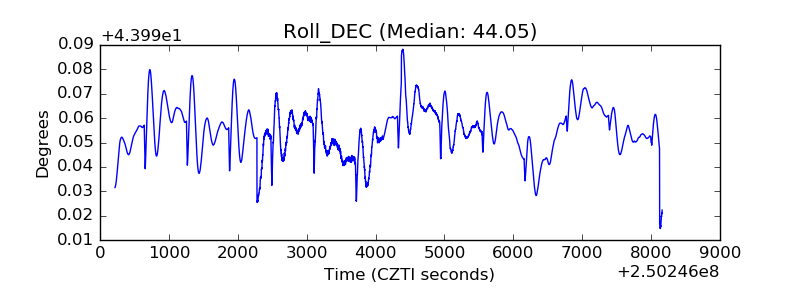 |
| _Roll_RA | 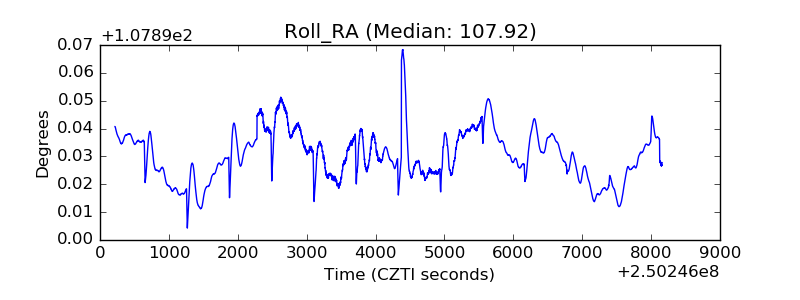 |
| Veto Counter | 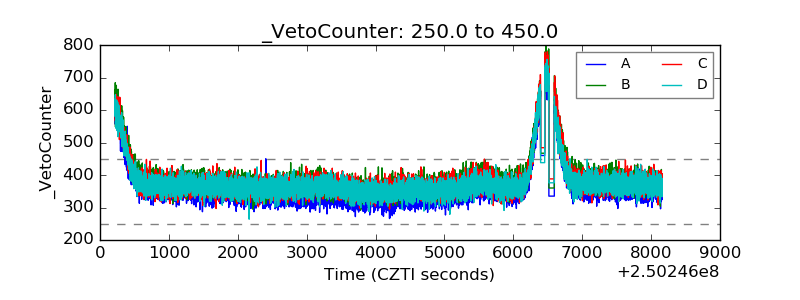 |