| Param | Original file | Final file |
|---|---|---|
| Filename | modeM0/AS1A04_088T03_9000001750_11848cztM0_level2.evt | modeM0/AS1A04_088T03_9000001750_11848cztM0_level2_quad_clean.evt |
| Size (bytes) | 1,314,555,840 | 228,340,800 |
| Size | 1.2 GB | 217.8 MB |
| Events in quadrant A | 9,190,422 | 1,452,557 |
| Events in quadrant B | 11,429,615 | 1,416,514 |
| Events in quadrant C | 8,184,642 | 1,409,504 |
| Events in quadrant D | 9,756,855 | 1,362,970 |
| Mode SS | |||
|---|---|---|---|
| Quadrant | BADHDUFLAG | Total packets | Discarded packets |
| A | 0 | 380 | 0 |
| B | 0 | 380 | 0 |
| C | 0 | 380 | 0 |
| D | 0 | 380 | 0 |
| Mode M0 | |||
|---|---|---|---|
| Quadrant | BADHDUFLAG | Total packets | Discarded packets |
| A | 0 | 39479 | 6 |
| B | 0 | 46250 | 5 |
| C | 0 | 37494 | 5 |
| D | 0 | 42169 | 5 |
| Mode M9 | |||
|---|---|---|---|
| Quadrant | BADHDUFLAG | Total packets | Discarded packets |
| A | 0 | 19 | 0 |
| B | 0 | 19 | 0 |
| C | 0 | 19 | 0 |
| D | 0 | 19 | 0 |
| Quadrant | Total seconds | Saturated seconds | Saturation percentage |
|---|---|---|---|
| A | 18481 | 265 | 1.433905% |
| B | 18481 | 835 | 4.518154% |
| C | 18481 | 163 | 0.881987% |
| D | 18482 | 445 | 2.407748% |
Noise dominated data is calculated using 1-second bins in cleaned event files. If a bin has >2000 counts, and if more than 50% of those come from <1% of pixels, then it is considered to be noise-dominated and hence unusable.
| Quadrant | # 1 sec bins | Bins with >0 counts | Bins with >2000 counts | High rate bins dominated by noise | Noise dominated (total time) | Noise dominated (detector-on time) | Marked lightcurve |
|---|---|---|---|---|---|---|---|
| A | 20477 | 18485 | 6 | 6 | 0.03% | 0.03% | 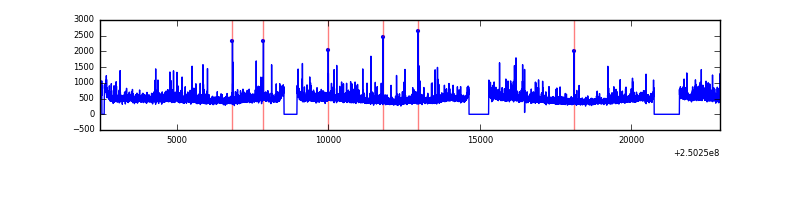 |
| B | 20477 | 18484 | 354 | 354 | 1.73% | 1.92% | 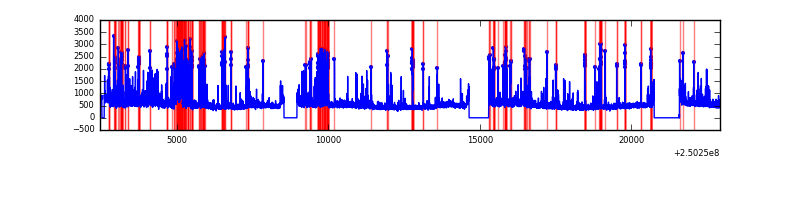 |
| C | 20477 | 18485 | 0 | 0 | 0.00% | 0.00% | 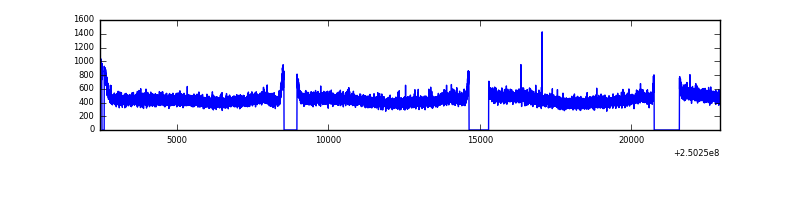 |
| D | 20478 | 18485 | 227 | 227 | 1.11% | 1.23% | 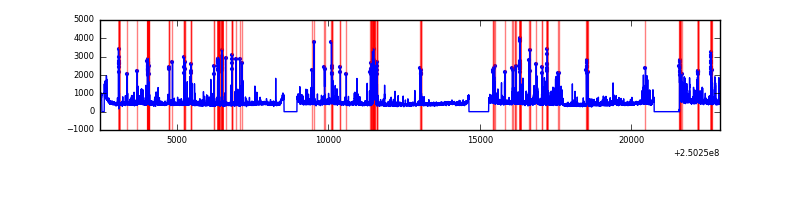 |
Top three noisy pixels from each quadrant. If the there are fewer than three noisy pixels in the level2.evt file, extra rows are filled as -1
| Pixel properties | Quadrant properties | ||||||
|---|---|---|---|---|---|---|---|
| Quadrant | DetID | PixID | Counts | Sigma | Mean | Median | Sigma |
| A | 1 | 162 | 314918 | 712.82 | 2176 | 2130 | 438.8 |
| A | 1 | 178 | 165012 | 371.2 | 2176 | 2130 | 438.8 |
| A | 1 | 161 | 143928 | 323.15 | 2176 | 2130 | 438.8 |
| B | 4 | 239 | 1528286 | 3768.49 | 2143 | 2092 | 405.0 |
| B | 15 | 204 | 439051 | 1078.94 | 2143 | 2092 | 405.0 |
| B | 3 | 64 | 401681 | 986.67 | 2143 | 2092 | 405.0 |
| C | 13 | 61 | 15883 | 28.45 | 2098 | 2106 | 484.2 |
| C | 12 | 4 | 5837 | 7.71 | 2098 | 2106 | 484.2 |
| C | 3 | 202 | 4976 | 5.93 | 2098 | 2106 | 484.2 |
| D | 1 | 52 | 1060667 | 2138.19 | 2078 | 2015 | 495.1 |
| D | 13 | 122 | 200556 | 401.0 | 2078 | 2015 | 495.1 |
| D | 13 | 249 | 162189 | 323.51 | 2078 | 2015 | 495.1 |
Histogram calculated using DETX and DETY for each event in the final _common_clean file
| Quadrant A | 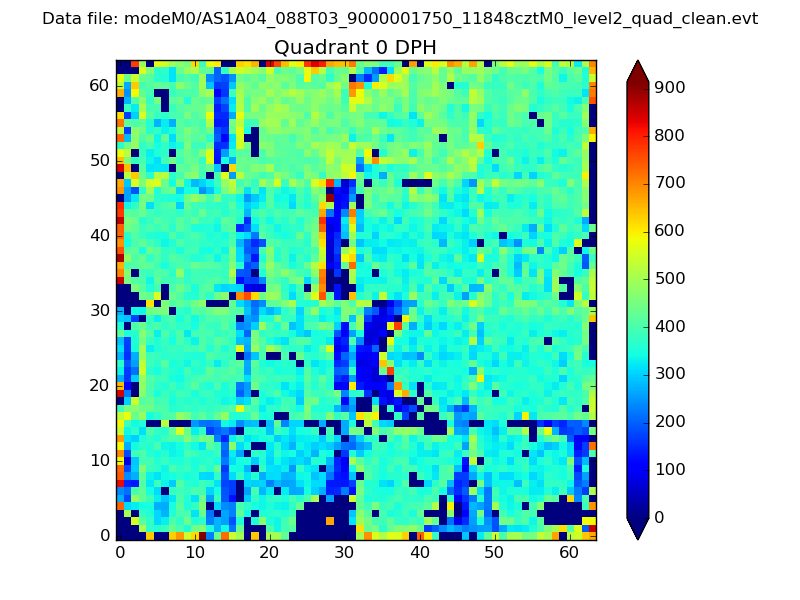 |
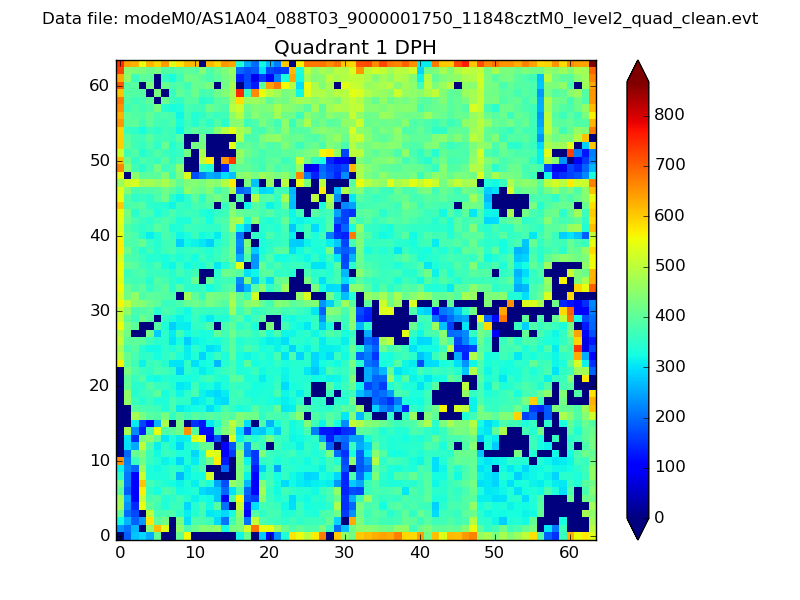 |
Quadrant B |
|---|---|---|---|
| Quadrant D | 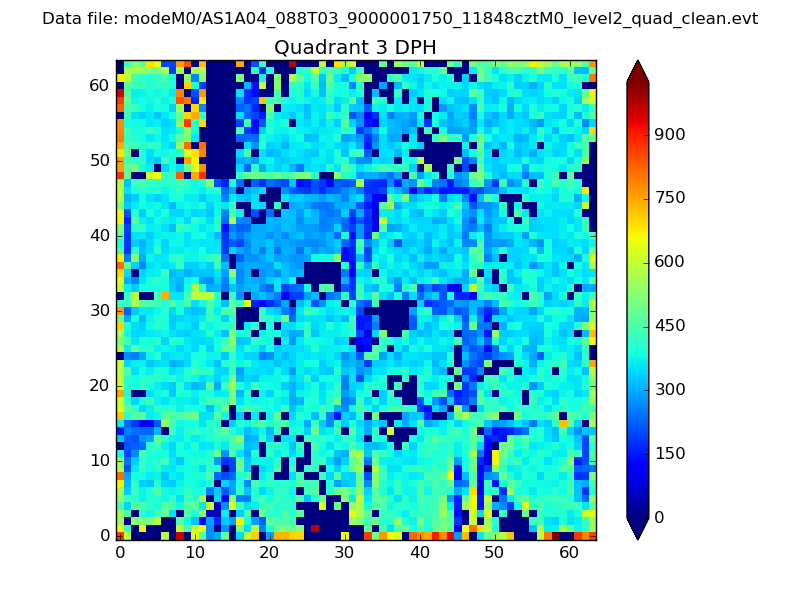 |
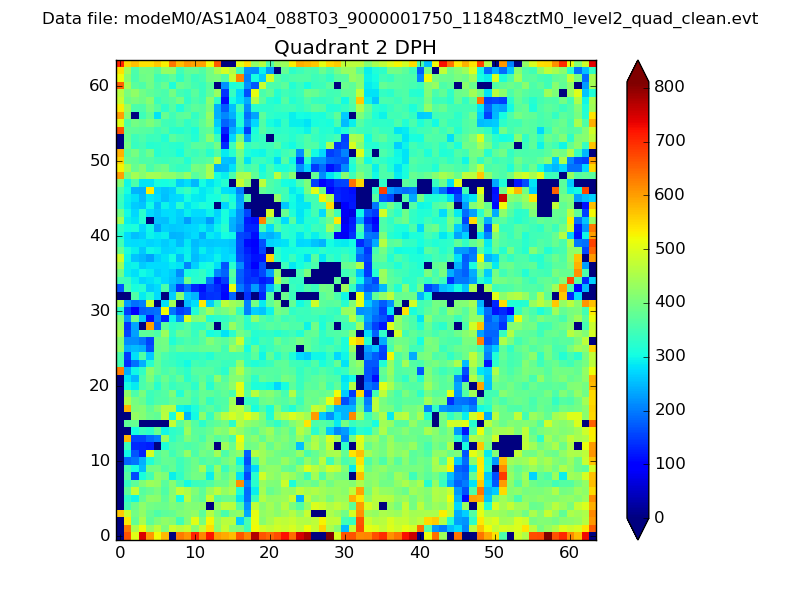 |
Quadrant C |
| Plot type | Count rate plots | Images |
|---|---|---|
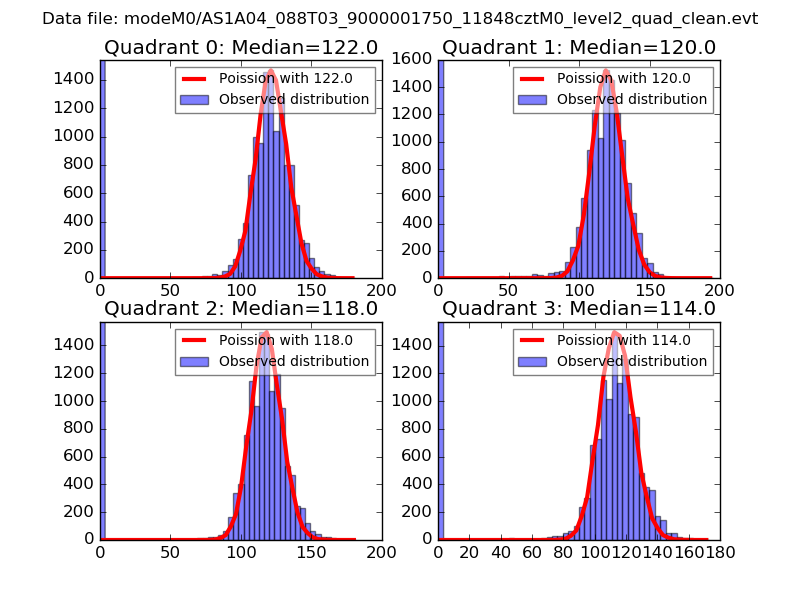
| Comparison with Poisson distribution Blue bars denote a histogram of data divided into 1 sec bins. Red curve is a Poisson curve with rate = median count rate of data. |
 |
 |
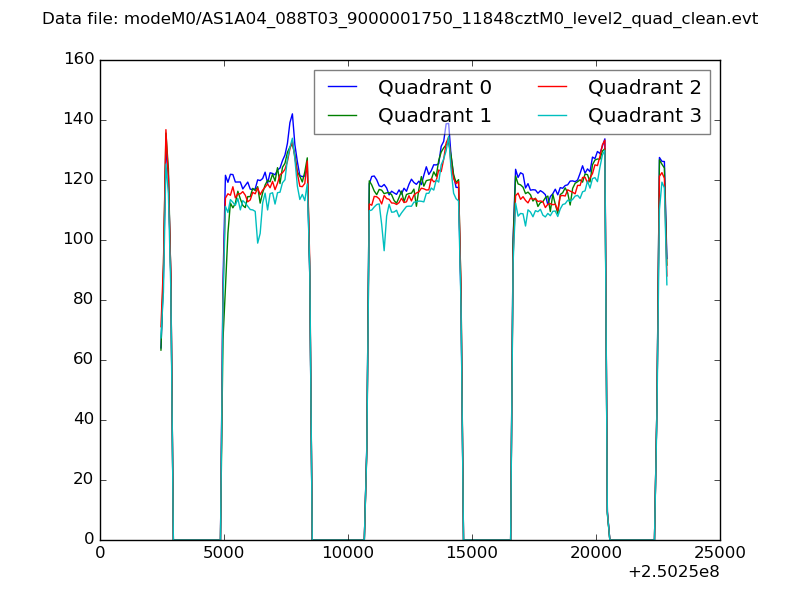
| Quadrant-wise count rates Data is divided into 100 sec bins |
 |
|
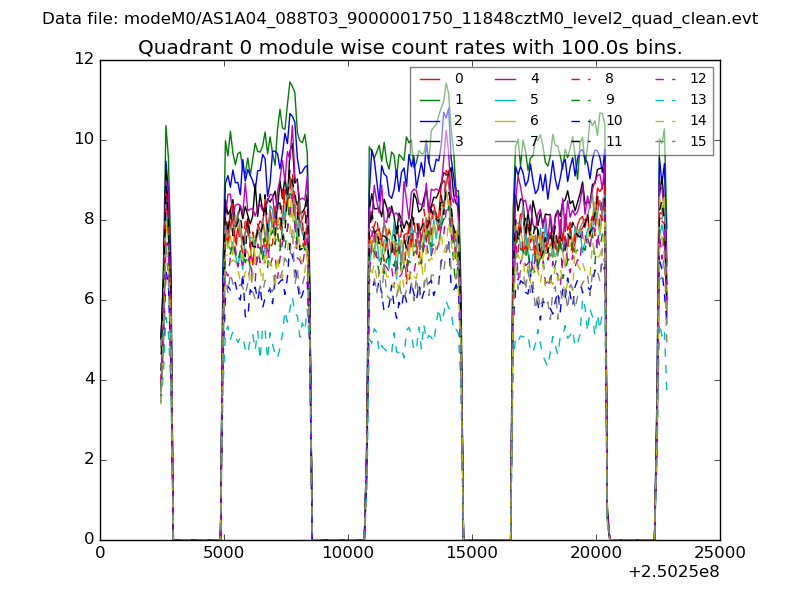
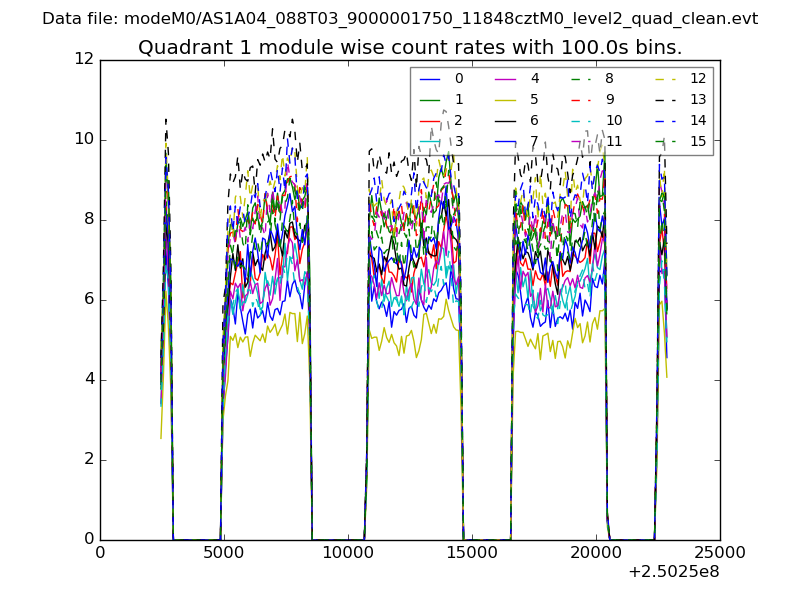
| Module-wise count rates for Quadrant A Data is divided into 100 sec bins |
 |
 |
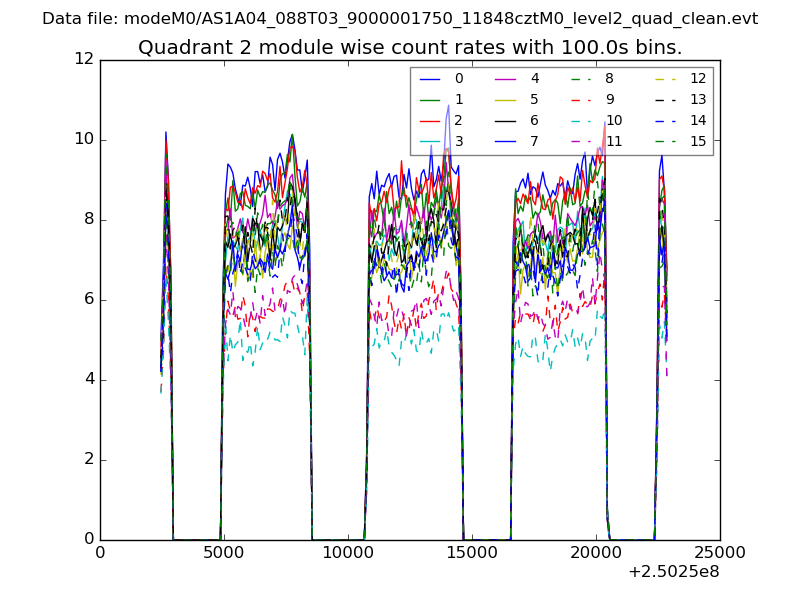
| Module-wise count rates for Quadrant B Data is divided into 100 sec bins |
 |
 |
| Module-wise count rates for Quadrant C Data is divided into 100 sec bins |
 |
 |
| Module-wise count rates for Quadrant D Data is divided into 100 sec bins |
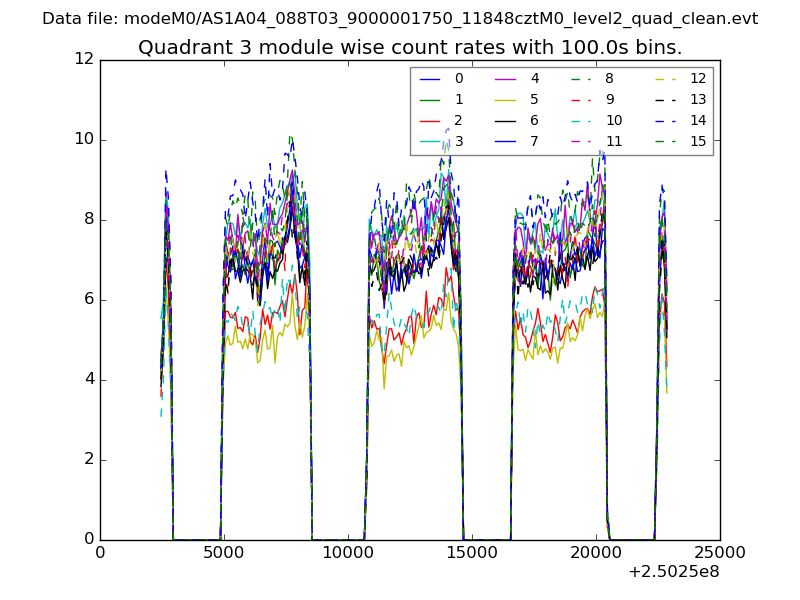 |
 |
| Parameter | Plot |
|---|---|
| CZT HV Monitor | 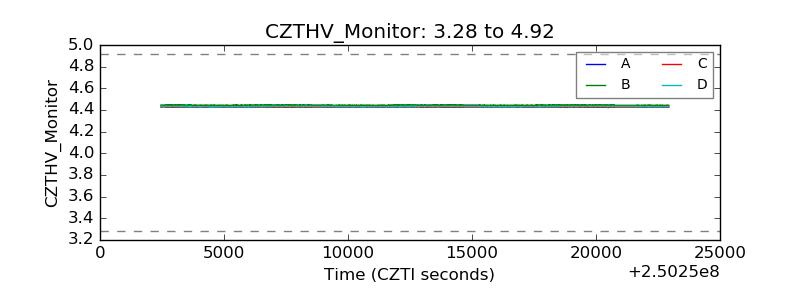 |
| D_VDD | 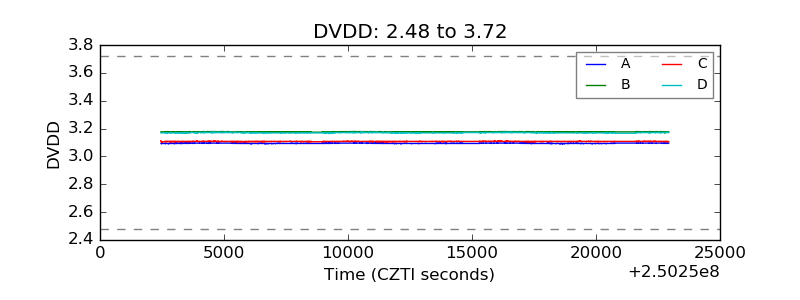 |
| Temperature 1 | 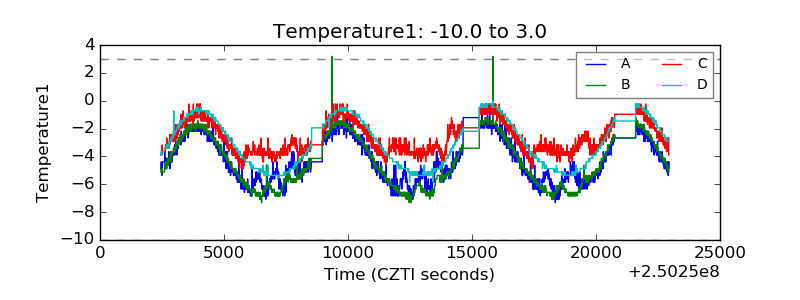 |
| Veto HV Monitor | 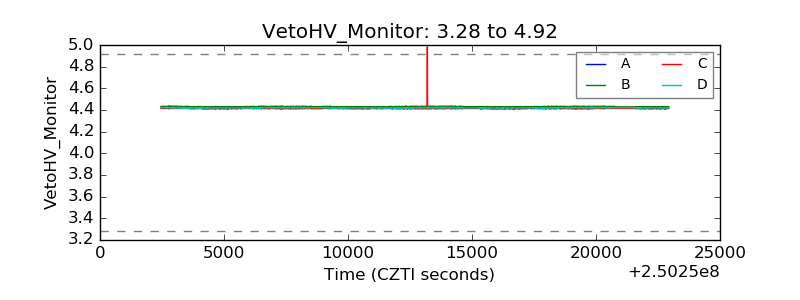 |
| Veto LLD | 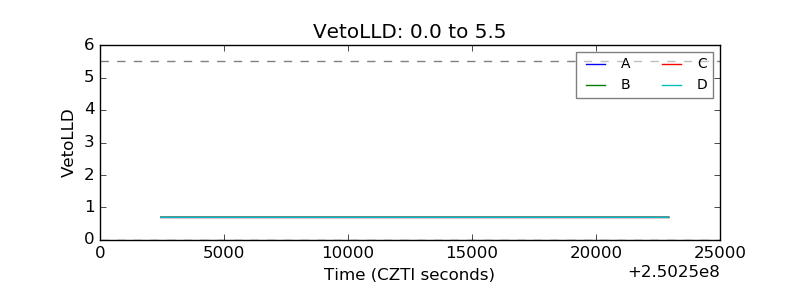 |
| Alpha Counter | 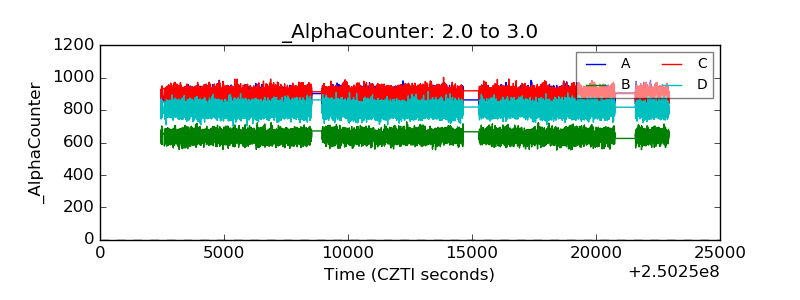 |
| _CPM_Rate | 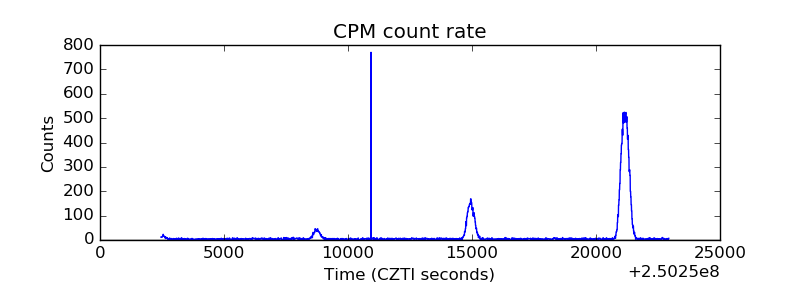 |
| CZT Counter | 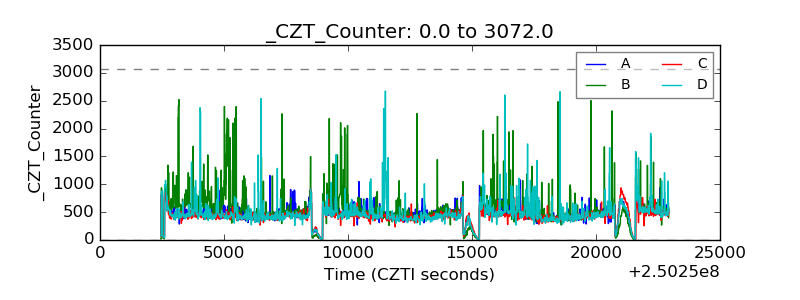 |
| +2.5 Volts monitor |  |
| +5 Volts monitor |  |
| _ROLL_ROT | 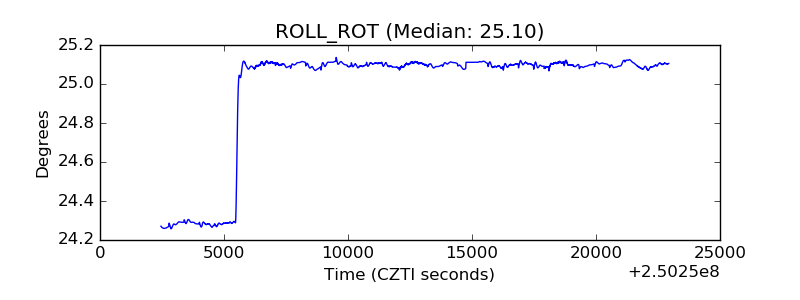 |
| _Roll_DEC | 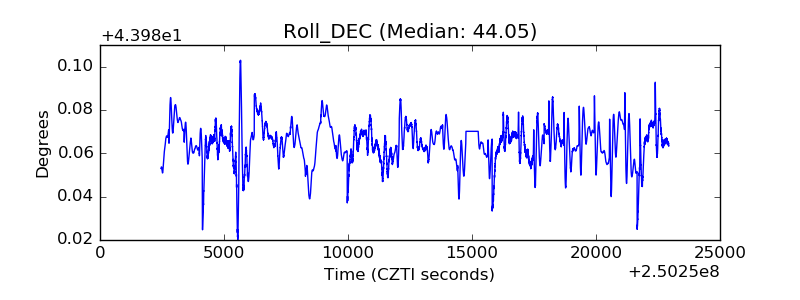 |
| _Roll_RA | 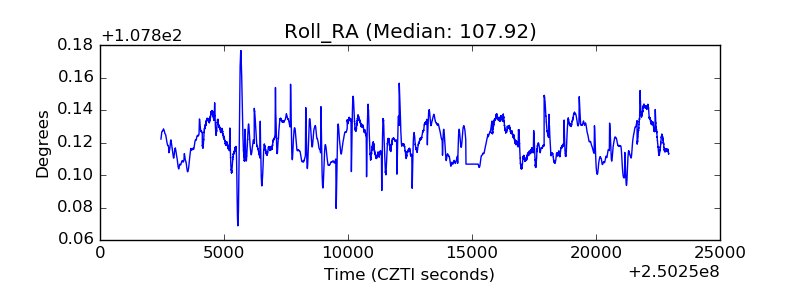 |
| Veto Counter | 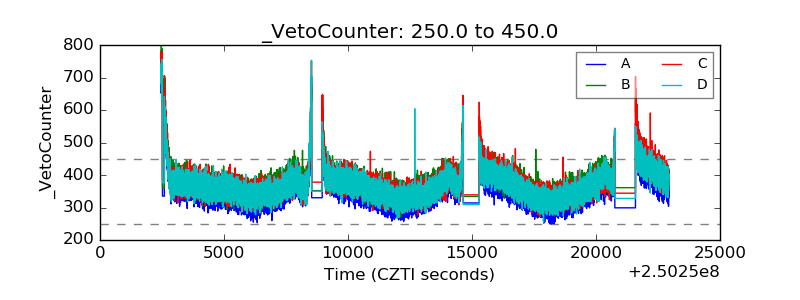 |