| Param | Original file | Final file |
|---|---|---|
| Filename | modeM0/AS1A04_088T03_9000001750_11849cztM0_level2.evt | modeM0/AS1A04_088T03_9000001750_11849cztM0_level2_quad_clean.evt |
| Size (bytes) | 504,118,080 | 87,333,120 |
| Size | 480.8 MB | 83.3 MB |
| Events in quadrant A | 3,370,624 | 560,814 |
| Events in quadrant B | 3,867,321 | 554,636 |
| Events in quadrant C | 3,007,316 | 548,626 |
| Events in quadrant D | 4,570,633 | 517,127 |
| Mode SS | |||
|---|---|---|---|
| Quadrant | BADHDUFLAG | Total packets | Discarded packets |
| A | 0 | 136 | 0 |
| B | 0 | 136 | 0 |
| C | 0 | 136 | 0 |
| D | 0 | 136 | 0 |
| Mode M0 | |||
|---|---|---|---|
| Quadrant | BADHDUFLAG | Total packets | Discarded packets |
| A | 0 | 14574 | 3 |
| B | 0 | 16060 | 2 |
| C | 0 | 13577 | 2 |
| D | 0 | 18458 | 2 |
| Mode M9 | |||
|---|---|---|---|
| Quadrant | BADHDUFLAG | Total packets | Discarded packets |
| A | 0 | 12 | 0 |
| B | 0 | 12 | 0 |
| C | 0 | 12 | 0 |
| D | 0 | 13 | 0 |
| Quadrant | Total seconds | Saturated seconds | Saturation percentage |
|---|---|---|---|
| A | 6643 | 76 | 1.144061% |
| B | 6643 | 154 | 2.318230% |
| C | 6643 | 46 | 0.692458% |
| D | 6643 | 515 | 7.752521% |
Noise dominated data is calculated using 1-second bins in cleaned event files. If a bin has >2000 counts, and if more than 50% of those come from <1% of pixels, then it is considered to be noise-dominated and hence unusable.
| Quadrant | # 1 sec bins | Bins with >0 counts | Bins with >2000 counts | High rate bins dominated by noise | Noise dominated (total time) | Noise dominated (detector-on time) | Marked lightcurve |
|---|---|---|---|---|---|---|---|
| A | 7604 | 6644 | 1 | 1 | 0.01% | 0.02% | 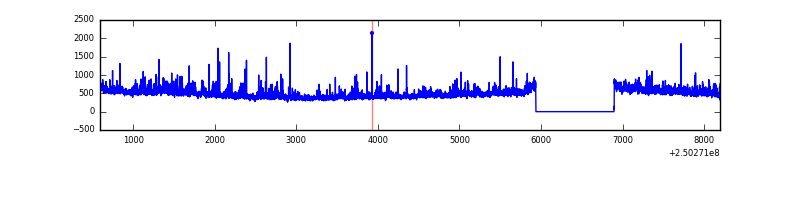 |
| B | 7604 | 6644 | 56 | 56 | 0.74% | 0.84% | 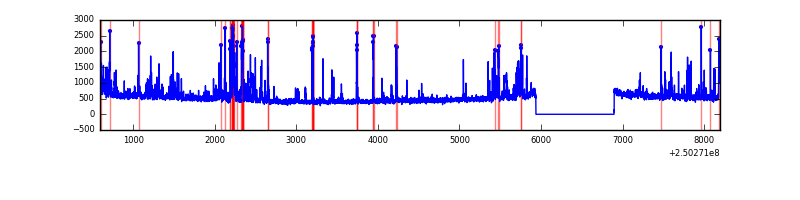 |
| C | 7604 | 6645 | 0 | 0 | 0.00% | 0.00% | 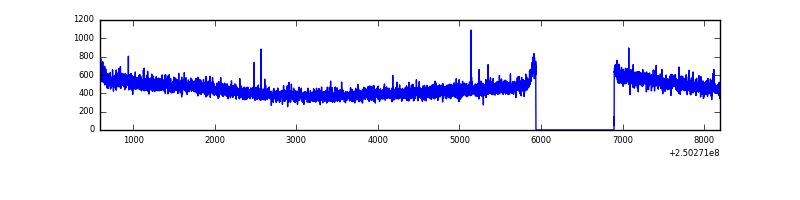 |
| D | 7604 | 6644 | 397 | 397 | 5.22% | 5.98% | 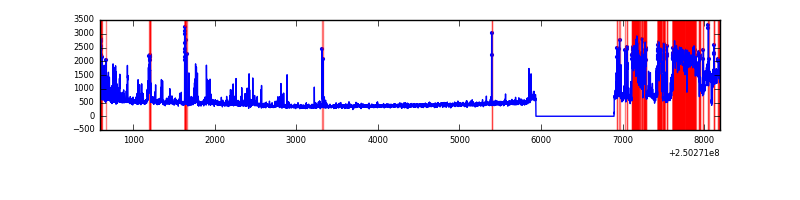 |
Top three noisy pixels from each quadrant. If the there are fewer than three noisy pixels in the level2.evt file, extra rows are filled as -1
| Pixel properties | Quadrant properties | ||||||
|---|---|---|---|---|---|---|---|
| Quadrant | DetID | PixID | Counts | Sigma | Mean | Median | Sigma |
| A | 1 | 162 | 128412 | 793.51 | 791 | 773 | 160.9 |
| A | 1 | 178 | 67903 | 417.33 | 791 | 773 | 160.9 |
| A | 1 | 161 | 58851 | 361.06 | 791 | 773 | 160.9 |
| B | 4 | 239 | 550612 | 3634.62 | 790 | 769 | 151.3 |
| B | 15 | 204 | 84917 | 556.24 | 790 | 769 | 151.3 |
| B | 10 | 252 | 44679 | 290.26 | 790 | 769 | 151.3 |
| C | 13 | 61 | 5598 | 27.04 | 770 | 774 | 178.4 |
| C | 12 | 4 | 3488 | 15.21 | 770 | 774 | 178.4 |
| C | 3 | 202 | 1859 | 6.08 | 770 | 774 | 178.4 |
| D | 13 | 122 | 988423 | 5495.46 | 750 | 728 | 179.7 |
| D | 9 | 85 | 284905 | 1581.14 | 750 | 728 | 179.7 |
| D | 1 | 52 | 197396 | 1094.25 | 750 | 728 | 179.7 |
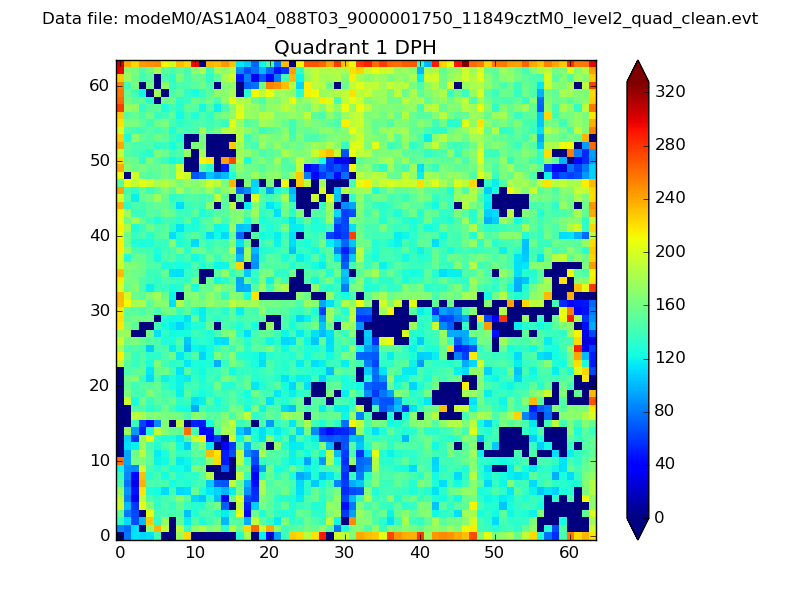
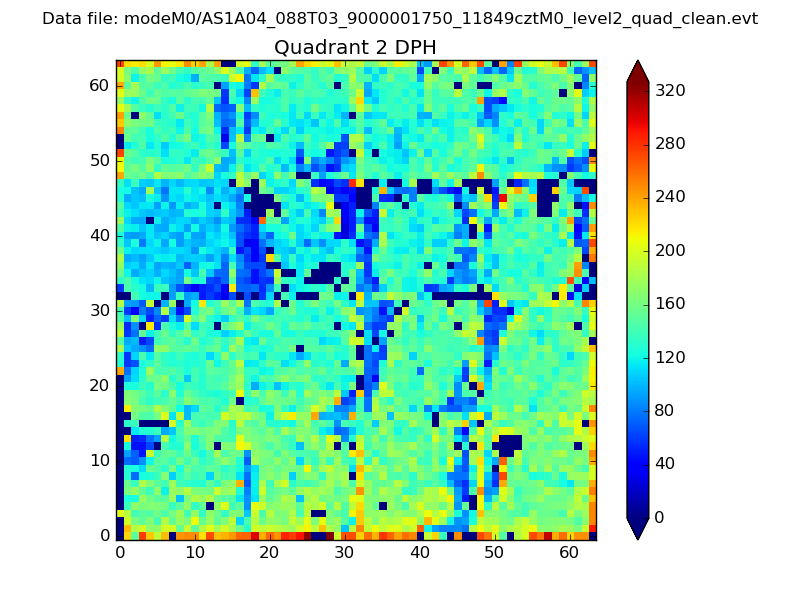
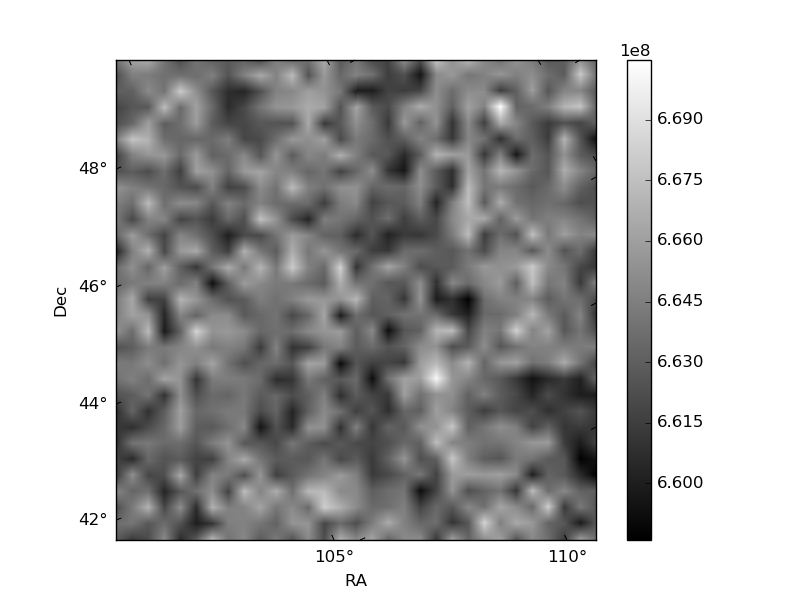
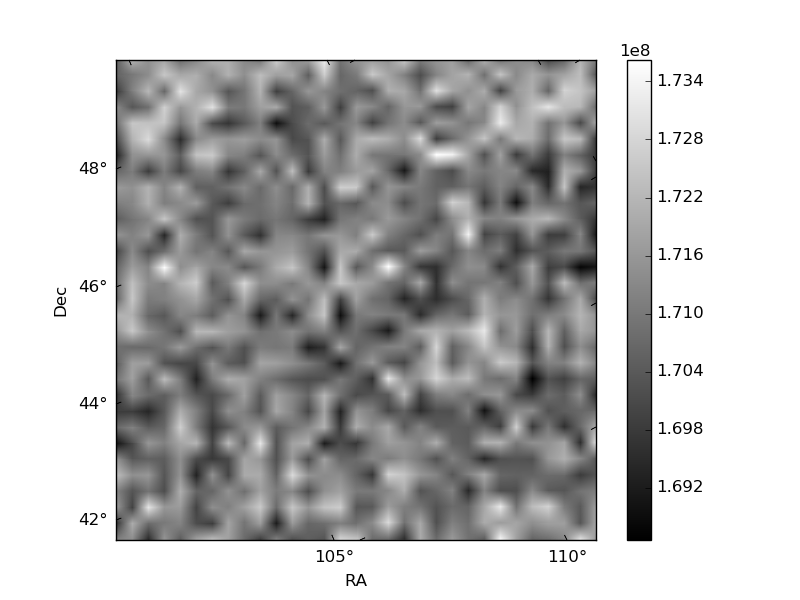
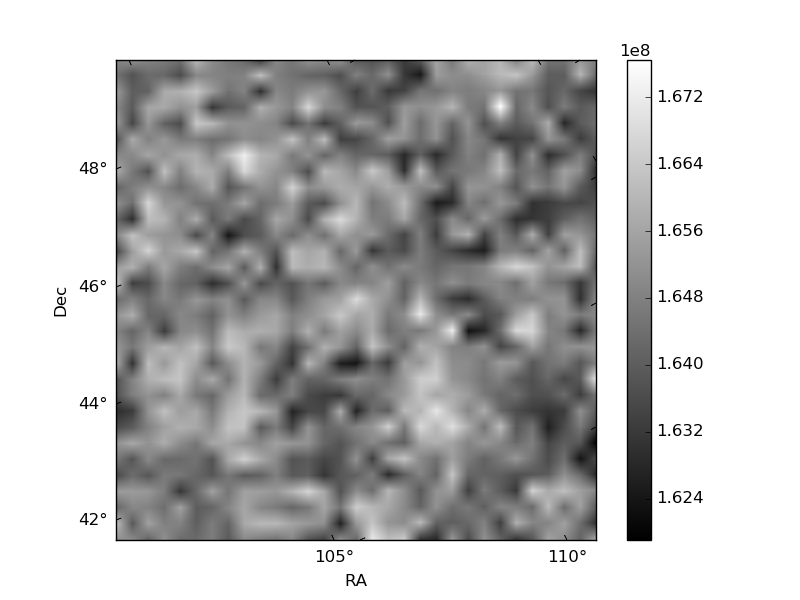
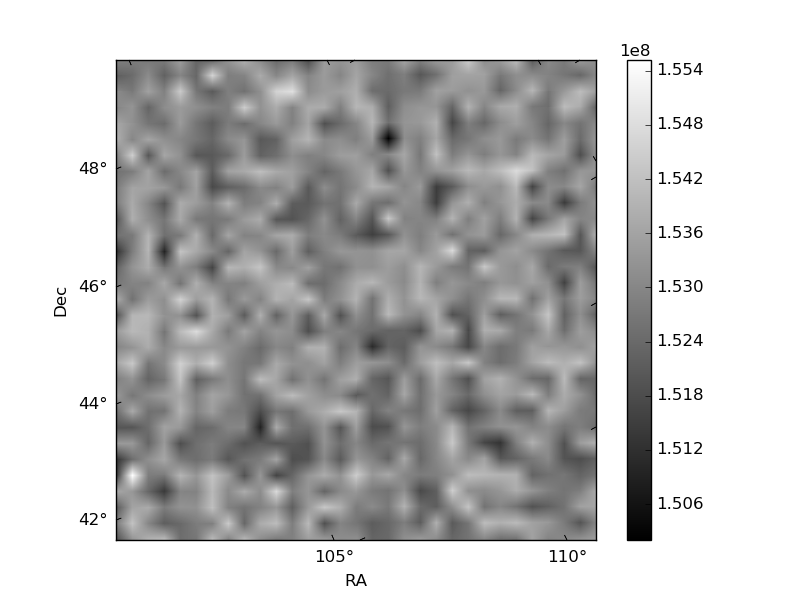
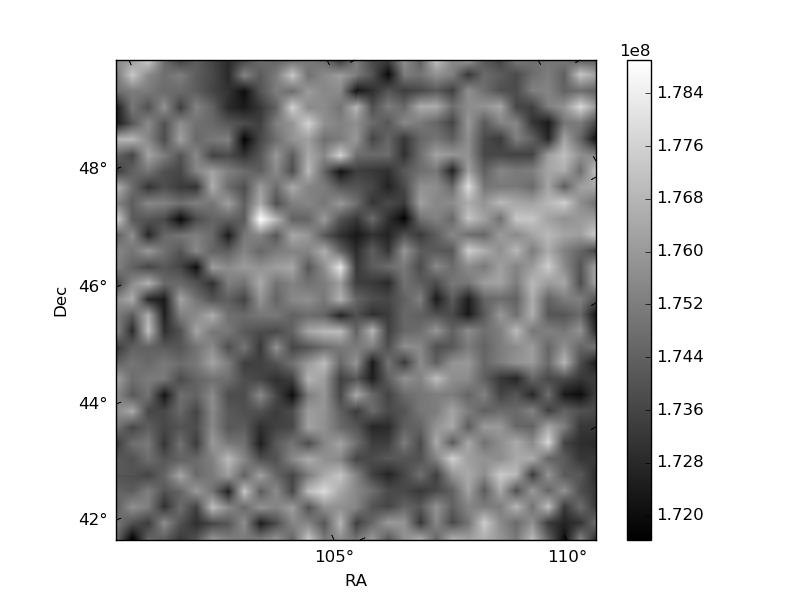
Histogram calculated using DETX and DETY for each event in the final _common_clean file
| Quadrant A |  |
 |
Quadrant B |
|---|---|---|---|
| Quadrant D | 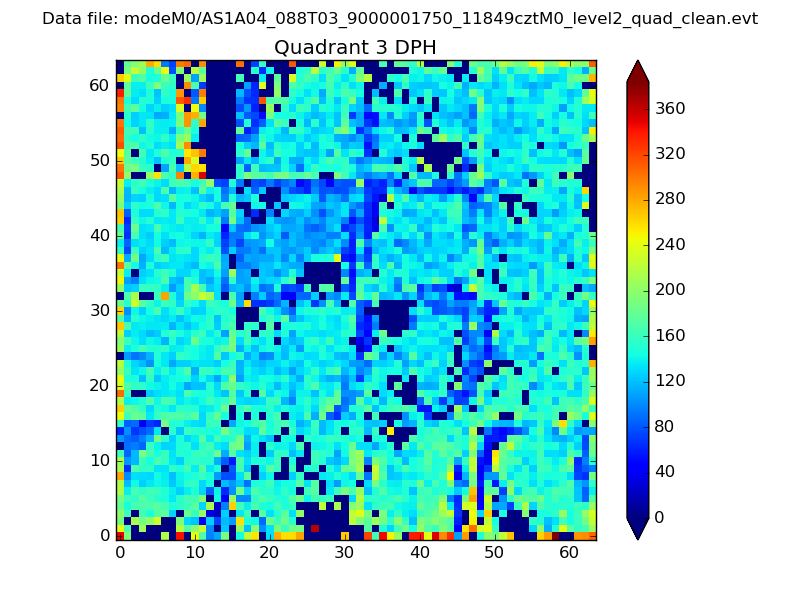 |
 |
Quadrant C |
| Plot type | Count rate plots | Images |
|---|---|---|
| Comparison with Poisson distribution Blue bars denote a histogram of data divided into 1 sec bins. Red curve is a Poisson curve with rate = median count rate of data. |
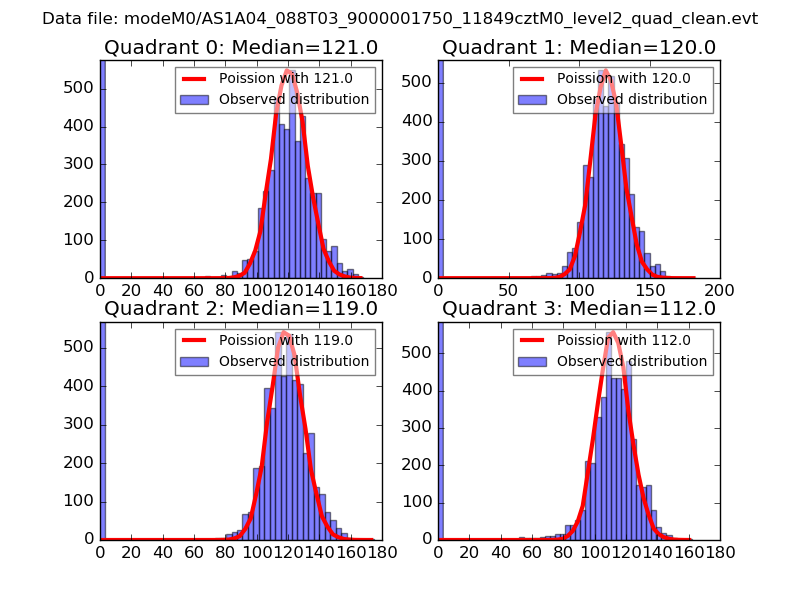 |
 |
| Quadrant-wise count rates Data is divided into 100 sec bins |
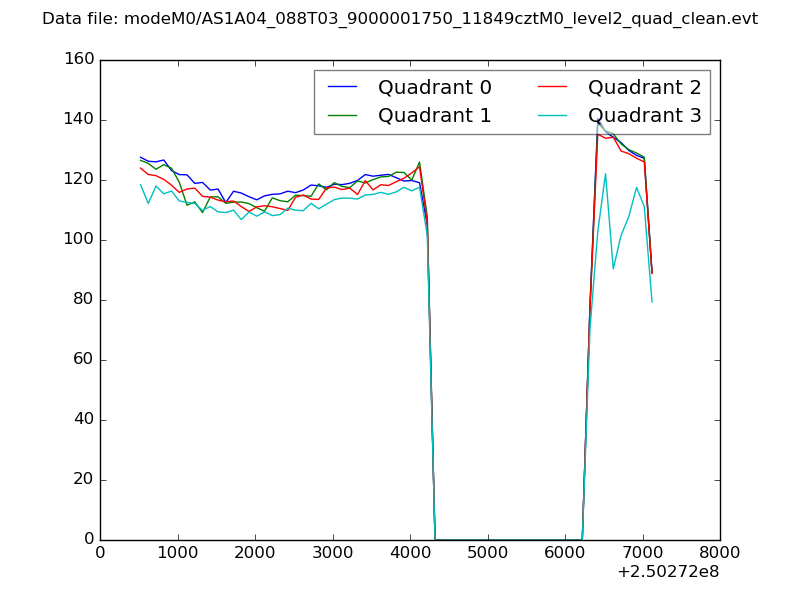 |
|
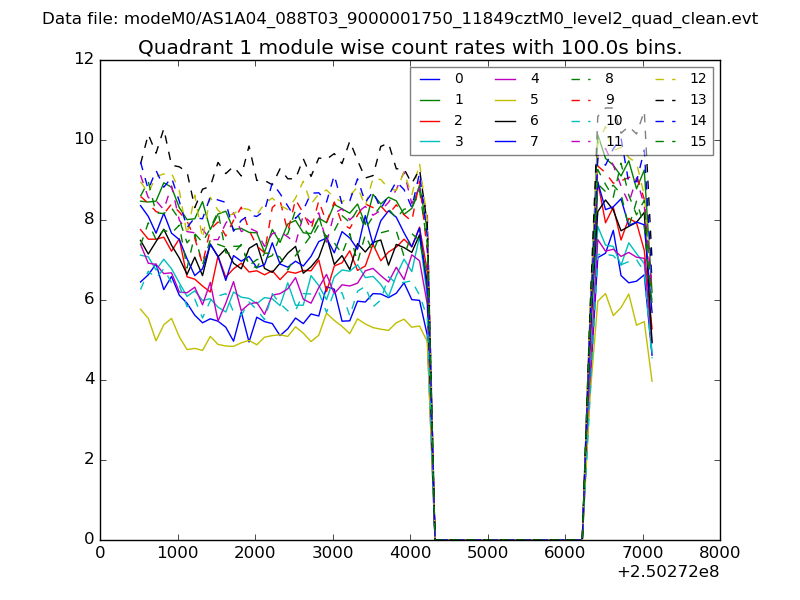
| Module-wise count rates for Quadrant A Data is divided into 100 sec bins |
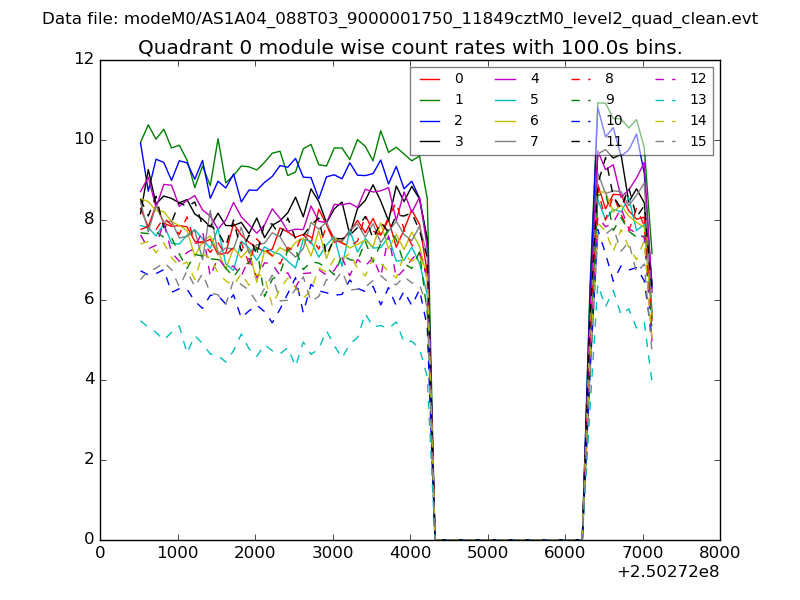 |
 |
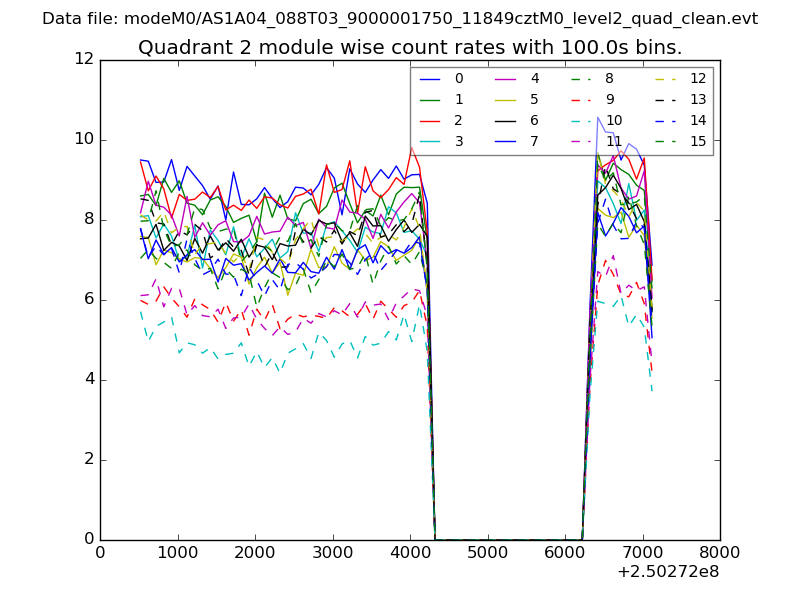
| Module-wise count rates for Quadrant B Data is divided into 100 sec bins |
 |
 |
| Module-wise count rates for Quadrant C Data is divided into 100 sec bins |
 |
 |
| Module-wise count rates for Quadrant D Data is divided into 100 sec bins |
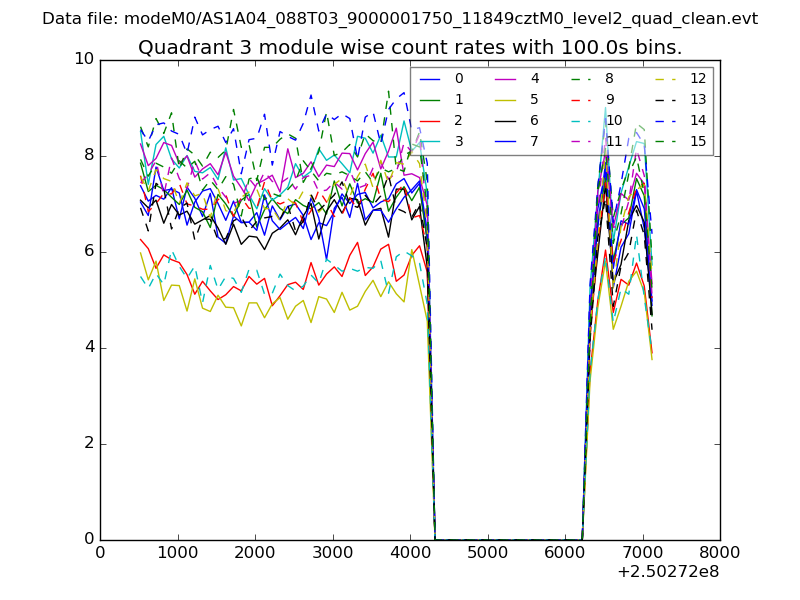 |
 |
| Parameter | Plot |
|---|---|
| CZT HV Monitor | 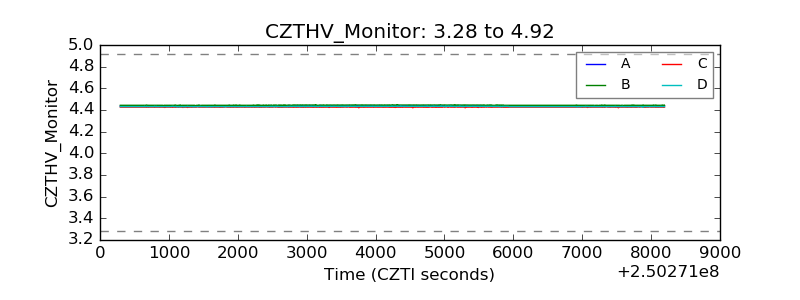 |
| D_VDD | 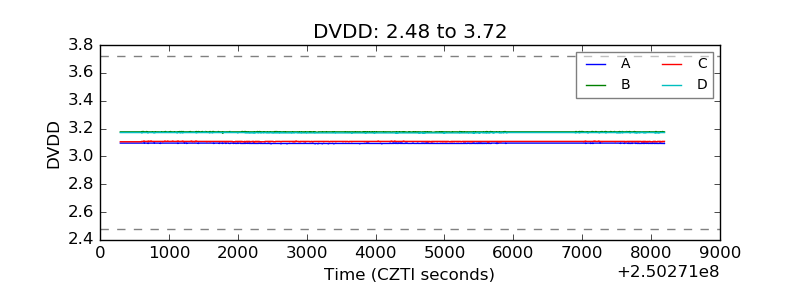 |
| Temperature 1 | 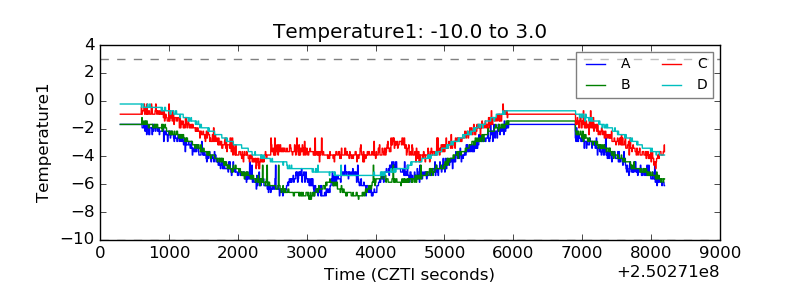 |
| Veto HV Monitor | 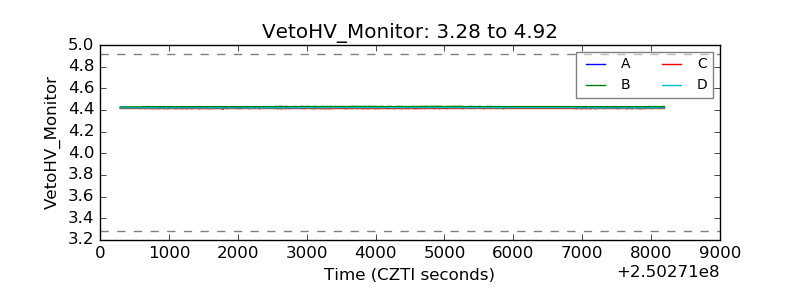 |
| Veto LLD | 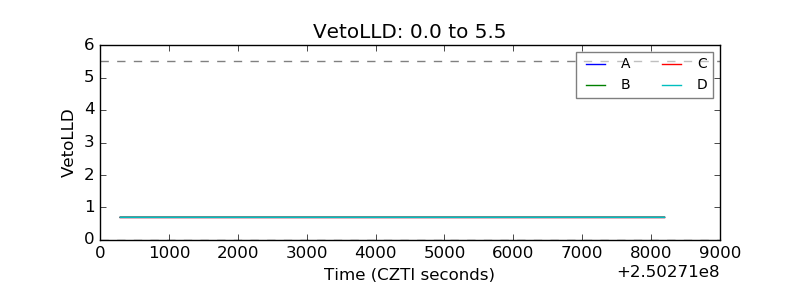 |
| Alpha Counter | 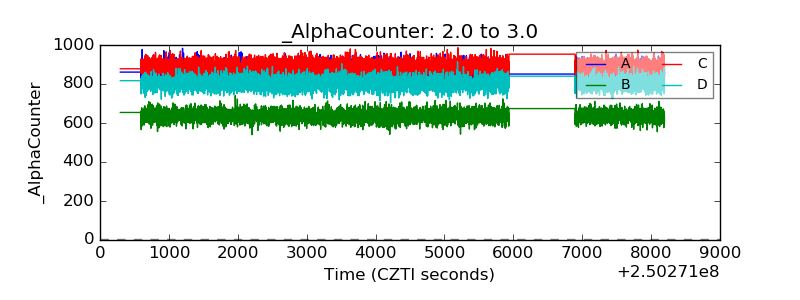 |
| _CPM_Rate | 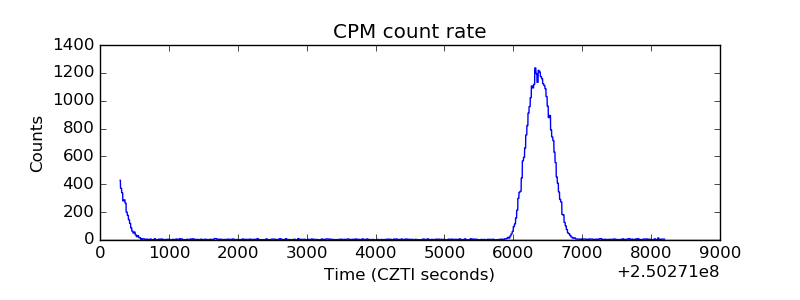 |
| CZT Counter | 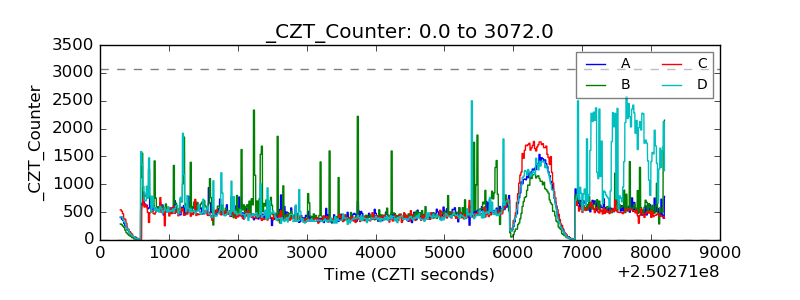 |
| +2.5 Volts monitor |  |
| +5 Volts monitor |  |
| _ROLL_ROT | 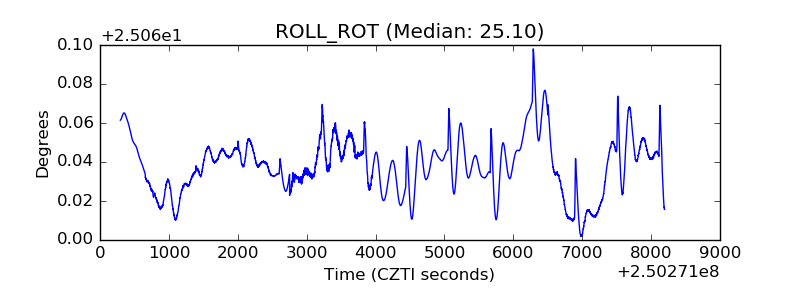 |
| _Roll_DEC | 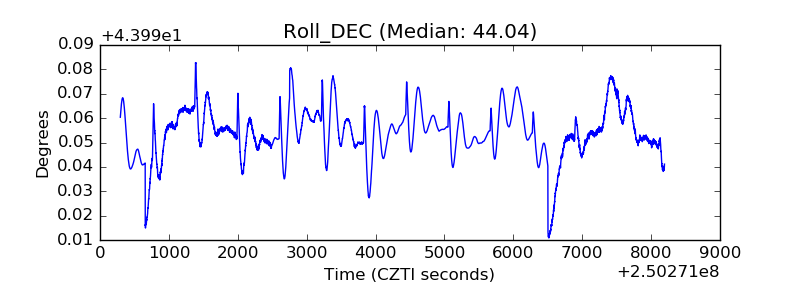 |
| _Roll_RA | 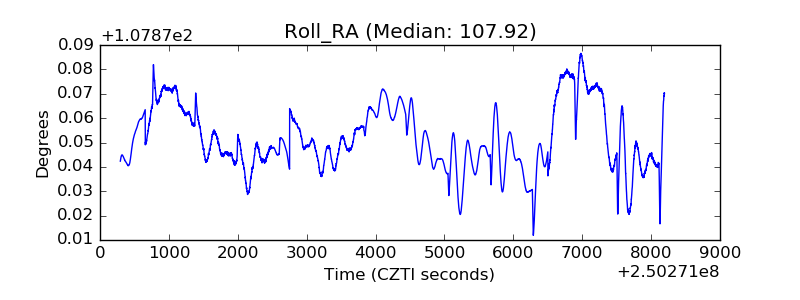 |
| Veto Counter | 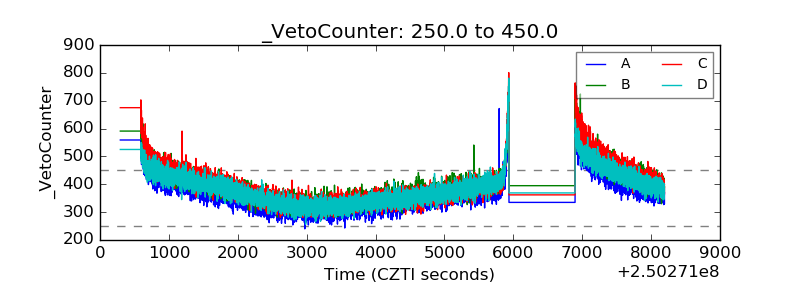 |