| Param | Original file | Final file |
|---|---|---|
| Filename | modeM0/AS1A04_088T03_9000001750_11851cztM0_level2.evt | modeM0/AS1A04_088T03_9000001750_11851cztM0_level2_quad_clean.evt |
| Size (bytes) | 524,963,520 | 99,288,000 |
| Size | 500.6 MB | 94.7 MB |
| Events in quadrant A | 3,571,029 | 646,226 |
| Events in quadrant B | 3,875,812 | 645,953 |
| Events in quadrant C | 3,154,290 | 637,681 |
| Events in quadrant D | 4,831,516 | 598,610 |
| Mode SS | |||
|---|---|---|---|
| Quadrant | BADHDUFLAG | Total packets | Discarded packets |
| A | 0 | 140 | 0 |
| B | 0 | 140 | 0 |
| C | 0 | 140 | 0 |
| D | 0 | 140 | 0 |
| Mode M0 | |||
|---|---|---|---|
| Quadrant | BADHDUFLAG | Total packets | Discarded packets |
| A | 0 | 15233 | 3 |
| B | 0 | 16297 | 2 |
| C | 0 | 14203 | 2 |
| D | 0 | 19439 | 2 |
| Mode M9 | |||
|---|---|---|---|
| Quadrant | BADHDUFLAG | Total packets | Discarded packets |
| A | 0 | 21 | 0 |
| B | 0 | 21 | 0 |
| C | 0 | 21 | 0 |
| D | 0 | 21 | 0 |
| Quadrant | Total seconds | Saturated seconds | Saturation percentage |
|---|---|---|---|
| A | 6868 | 75 | 1.092021% |
| B | 6868 | 139 | 2.023879% |
| C | 6868 | 53 | 0.771695% |
| D | 6868 | 515 | 7.498544% |
Noise dominated data is calculated using 1-second bins in cleaned event files. If a bin has >2000 counts, and if more than 50% of those come from <1% of pixels, then it is considered to be noise-dominated and hence unusable.
| Quadrant | # 1 sec bins | Bins with >0 counts | Bins with >2000 counts | High rate bins dominated by noise | Noise dominated (total time) | Noise dominated (detector-on time) | Marked lightcurve |
|---|---|---|---|---|---|---|---|
| A | 8949 | 6871 | 1 | 1 | 0.01% | 0.01% |  |
| B | 8949 | 6871 | 30 | 30 | 0.34% | 0.44% |  |
| C | 8949 | 6871 | 0 | 0 | 0.00% | 0.00% |  |
| D | 8949 | 6871 | 397 | 397 | 4.44% | 5.78% | 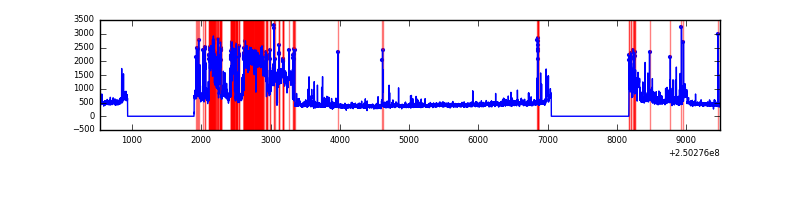 |
Top three noisy pixels from each quadrant. If the there are fewer than three noisy pixels in the level2.evt file, extra rows are filled as -1
| Pixel properties | Quadrant properties | ||||||
|---|---|---|---|---|---|---|---|
| Quadrant | DetID | PixID | Counts | Sigma | Mean | Median | Sigma |
| A | 1 | 162 | 147372 | 868.43 | 829 | 811 | 168.8 |
| A | 1 | 178 | 77253 | 452.95 | 829 | 811 | 168.8 |
| A | 1 | 161 | 66957 | 391.94 | 829 | 811 | 168.8 |
| B | 4 | 239 | 407591 | 2584.64 | 829 | 807 | 157.4 |
| B | 15 | 204 | 67373 | 422.95 | 829 | 807 | 157.4 |
| B | 10 | 252 | 59267 | 371.45 | 829 | 807 | 157.4 |
| C | 13 | 61 | 5770 | 26.34 | 808 | 812 | 188.2 |
| C | 12 | 4 | 2664 | 9.84 | 808 | 812 | 188.2 |
| C | 3 | 202 | 2036 | 6.5 | 808 | 812 | 188.2 |
| D | 13 | 122 | 1216183 | 6530.43 | 785 | 763 | 186.1 |
| D | 9 | 85 | 238437 | 1277.02 | 785 | 763 | 186.1 |
| D | 1 | 52 | 135399 | 723.4 | 785 | 763 | 186.1 |
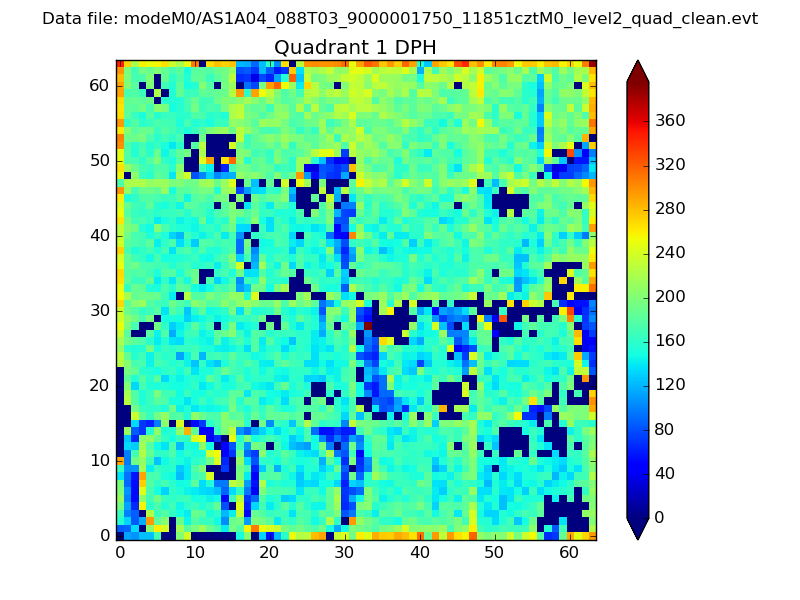
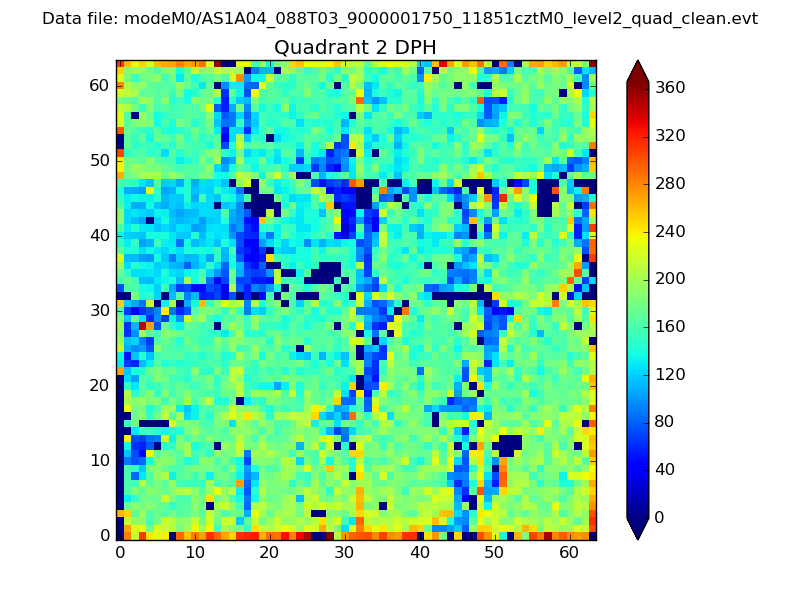
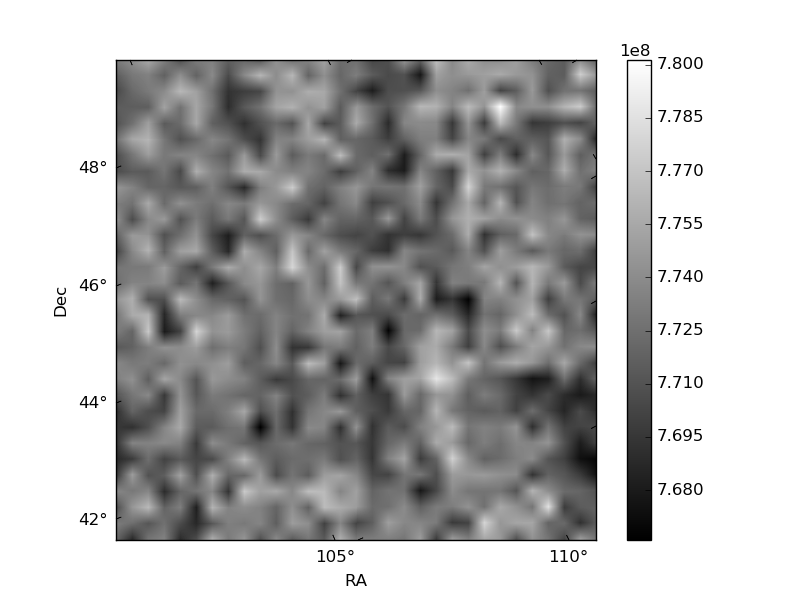
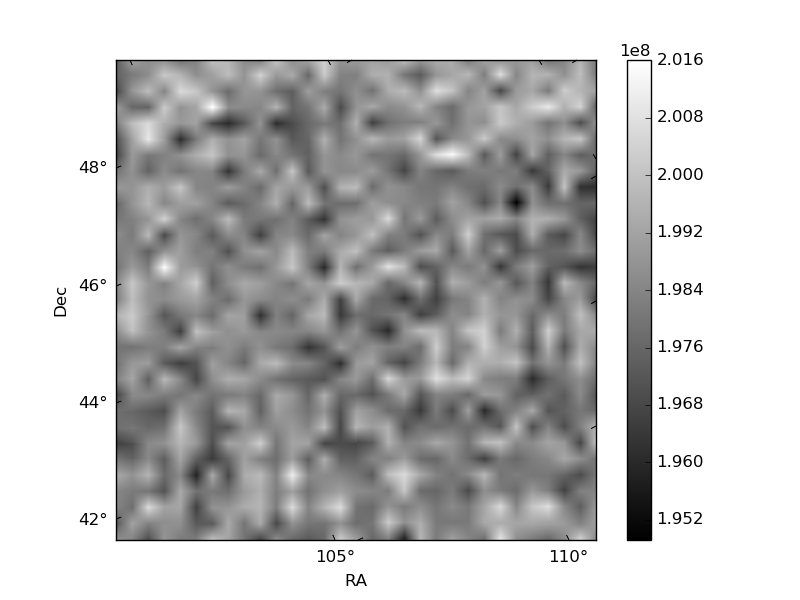
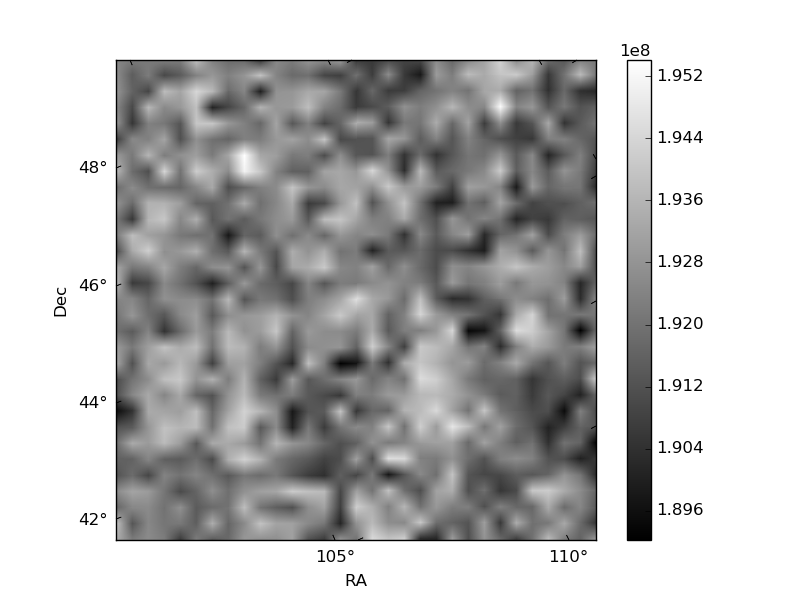
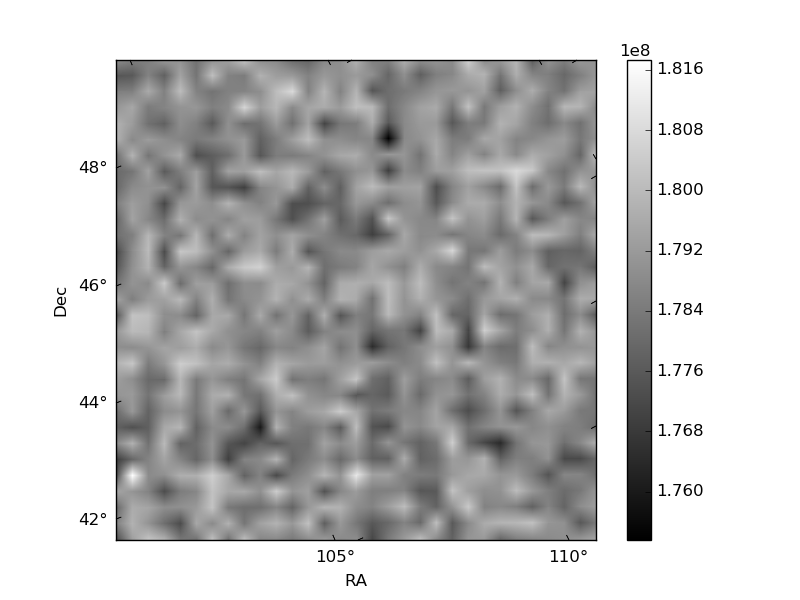
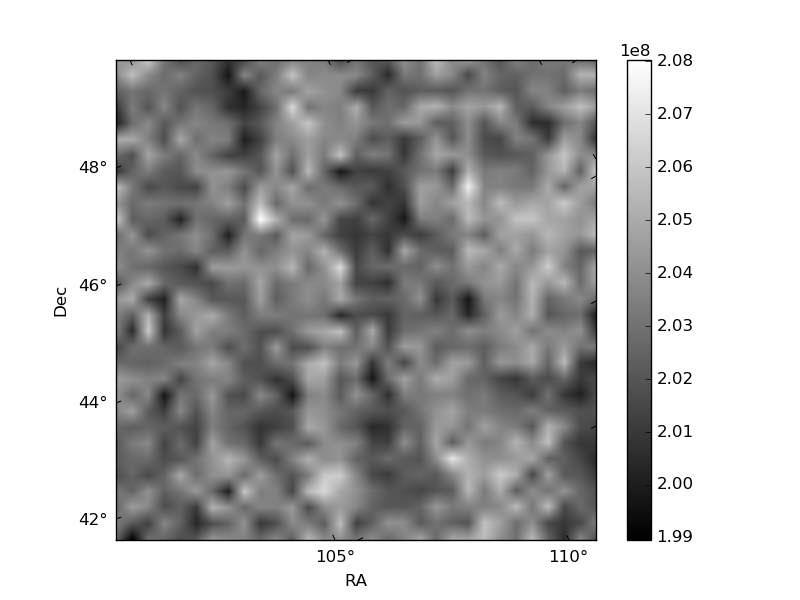
Histogram calculated using DETX and DETY for each event in the final _common_clean file
| Quadrant A |  |
 |
Quadrant B |
|---|---|---|---|
| Quadrant D |  |
 |
Quadrant C |
| Plot type | Count rate plots | Images |
|---|---|---|
| Comparison with Poisson distribution Blue bars denote a histogram of data divided into 1 sec bins. Red curve is a Poisson curve with rate = median count rate of data. |
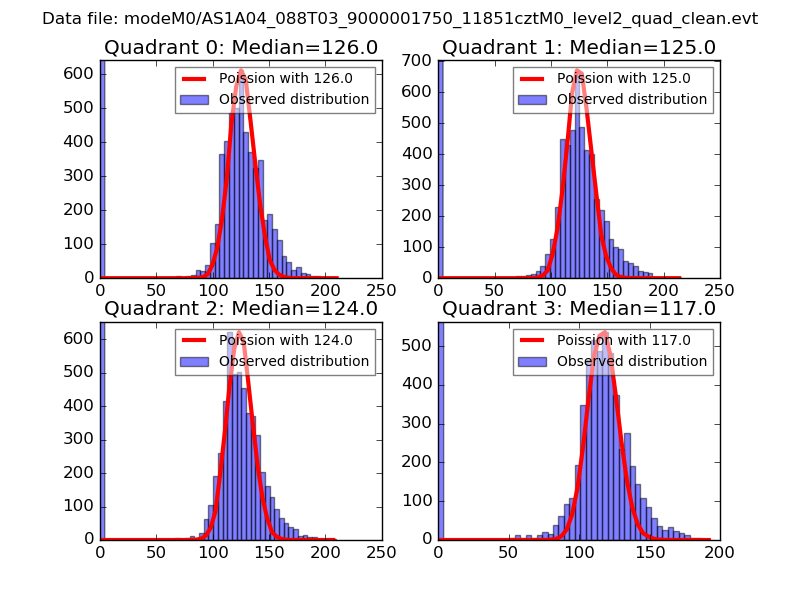 |
 |
| Quadrant-wise count rates Data is divided into 100 sec bins |
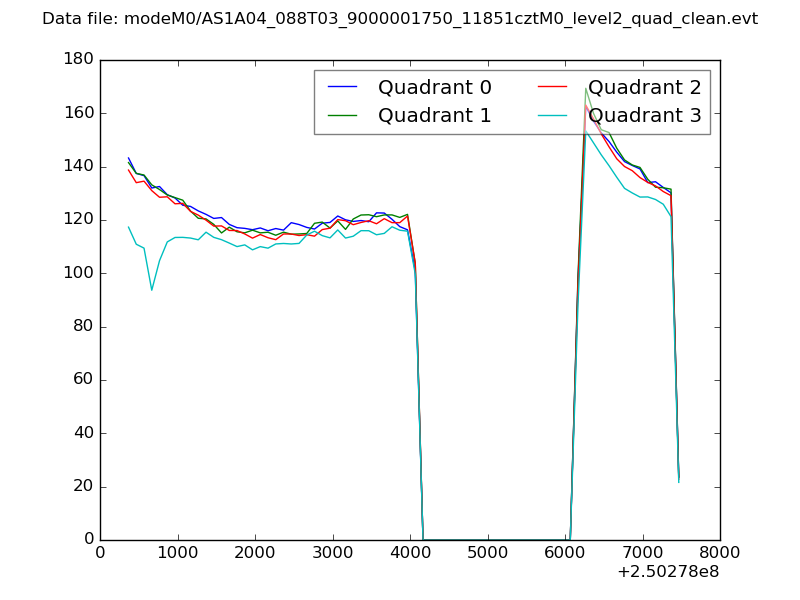 |
|
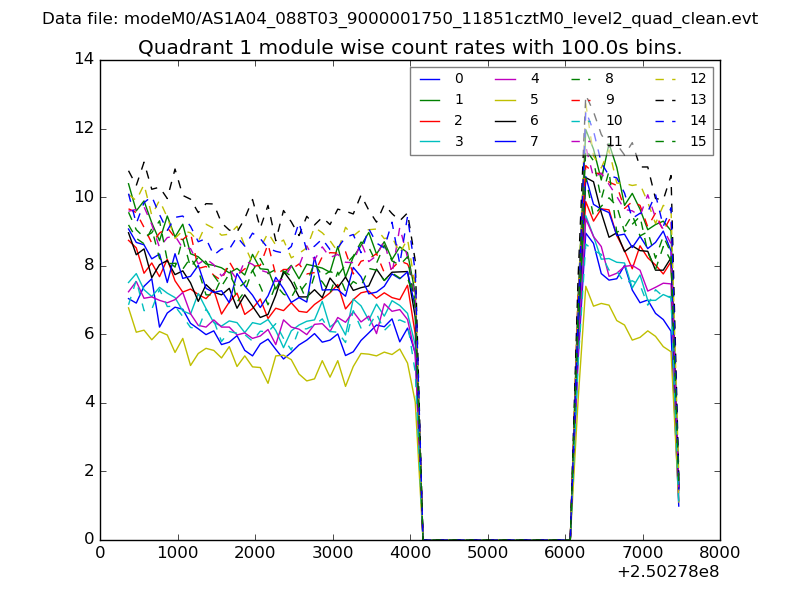
| Module-wise count rates for Quadrant A Data is divided into 100 sec bins |
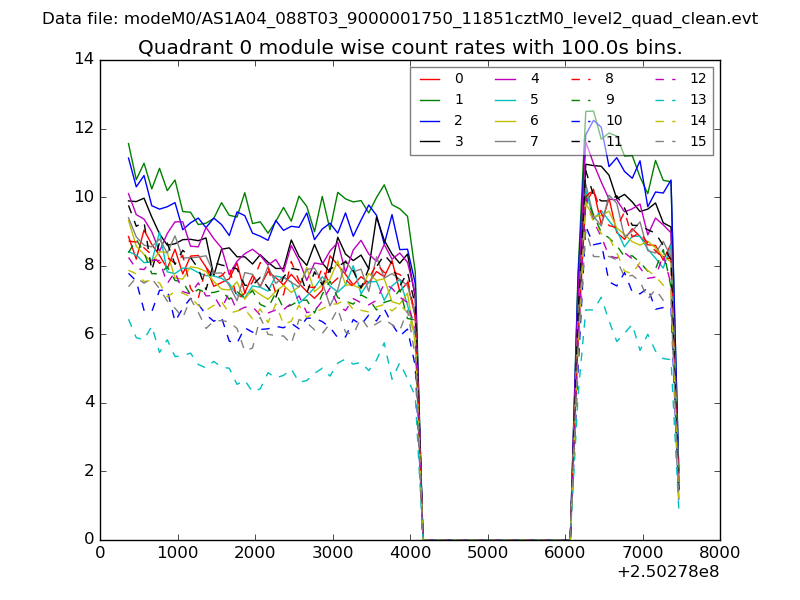 |
 |
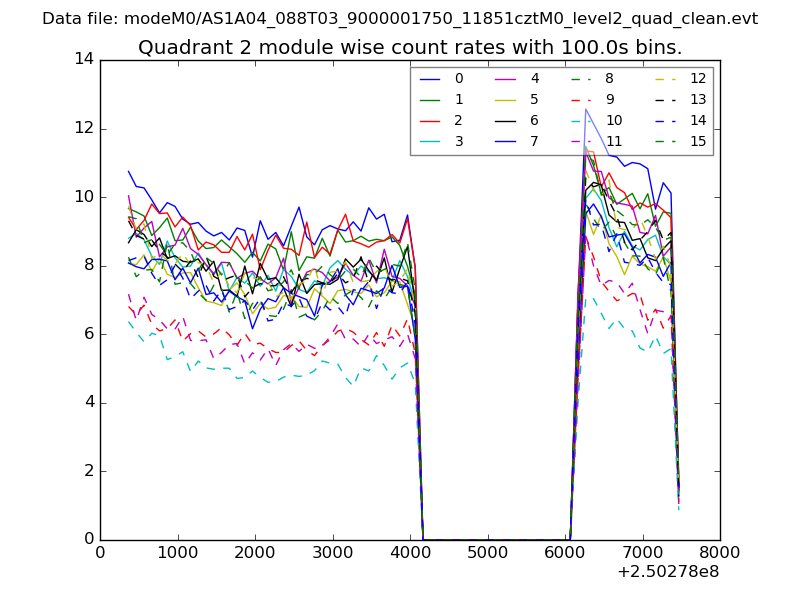
| Module-wise count rates for Quadrant B Data is divided into 100 sec bins |
 |
 |
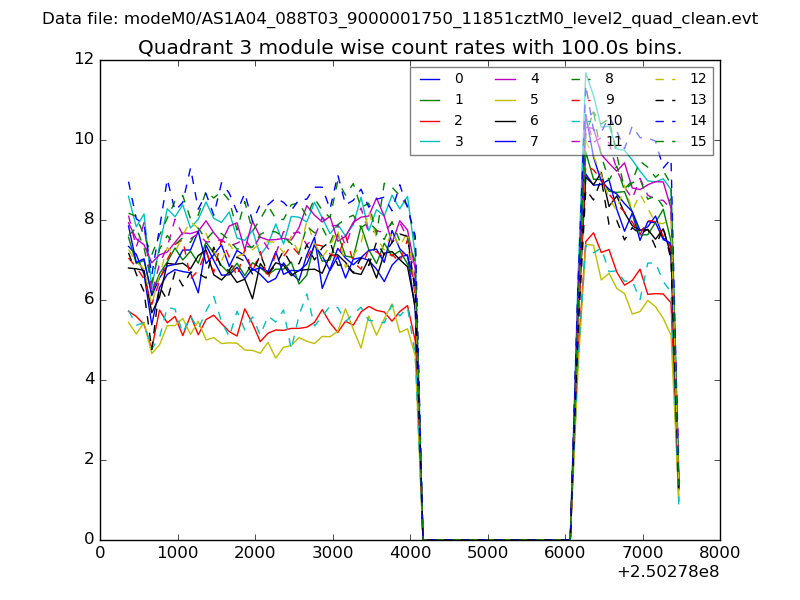
| Module-wise count rates for Quadrant C Data is divided into 100 sec bins |
 |
 |
| Module-wise count rates for Quadrant D Data is divided into 100 sec bins |
 |
 |
| Parameter | Plot |
|---|---|
| CZT HV Monitor | 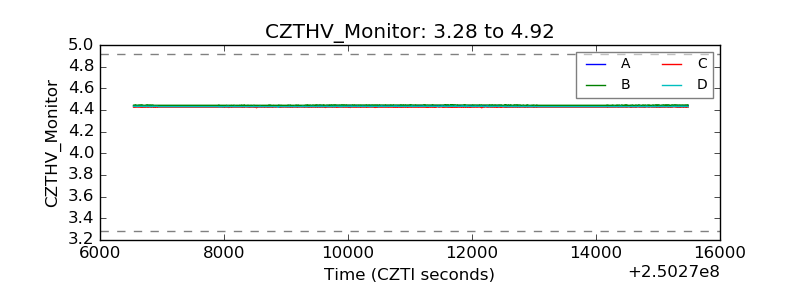 |
| D_VDD | 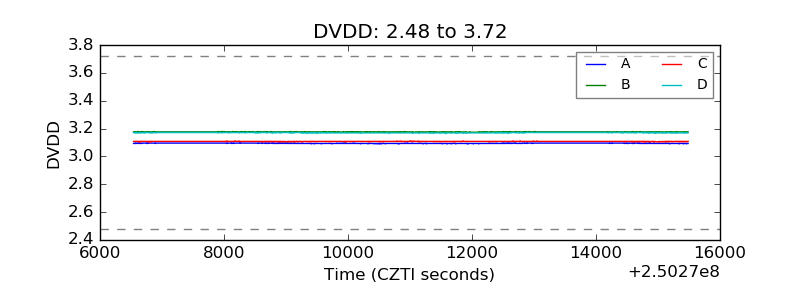 |
| Temperature 1 |  |
| Veto HV Monitor | 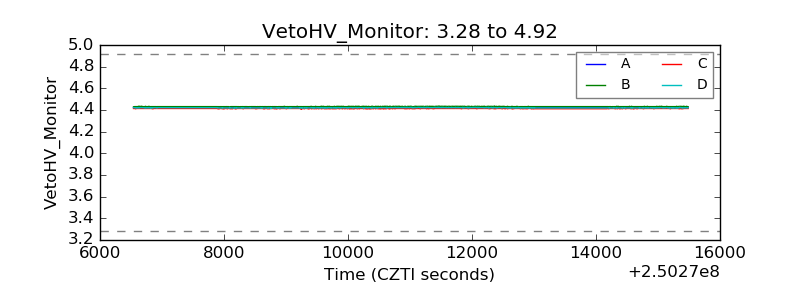 |
| Veto LLD |  |
| Alpha Counter | 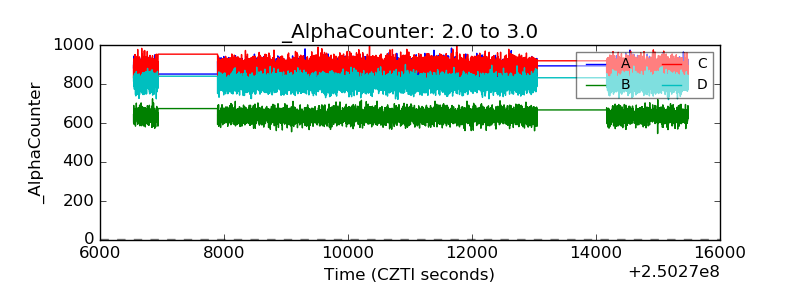 |
| _CPM_Rate | 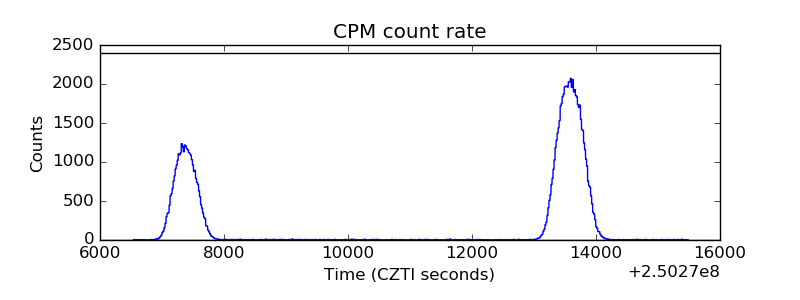 |
| CZT Counter | 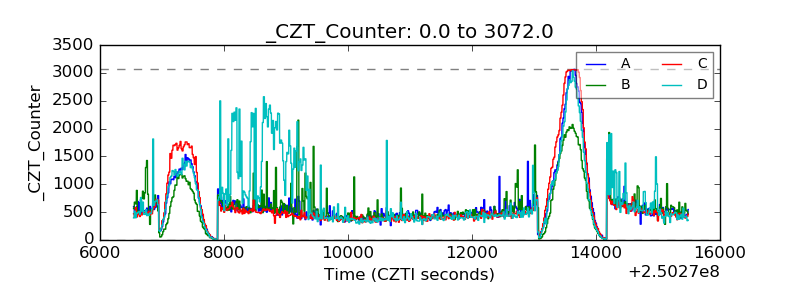 |
| +2.5 Volts monitor |  |
| +5 Volts monitor |  |
| _ROLL_ROT | 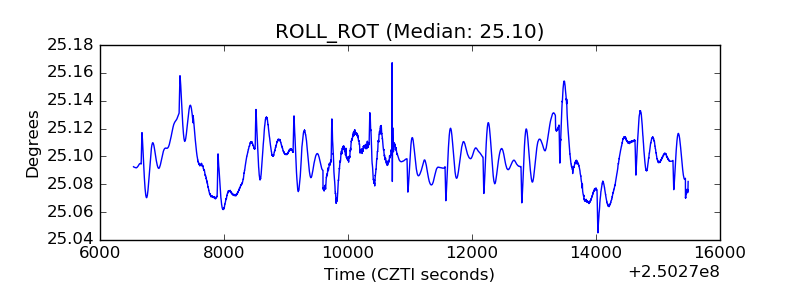 |
| _Roll_DEC | 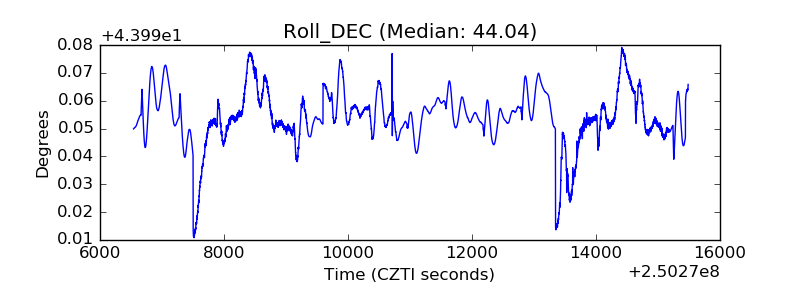 |
| _Roll_RA | 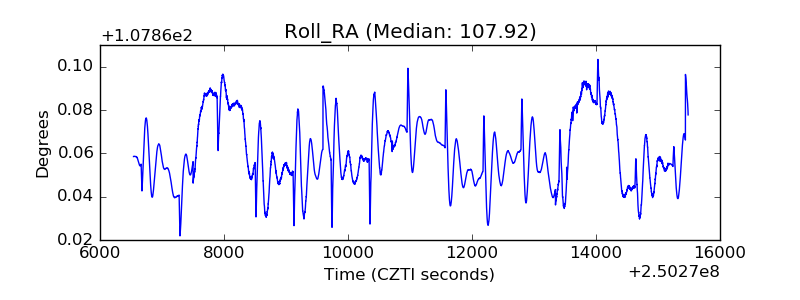 |
| Veto Counter | 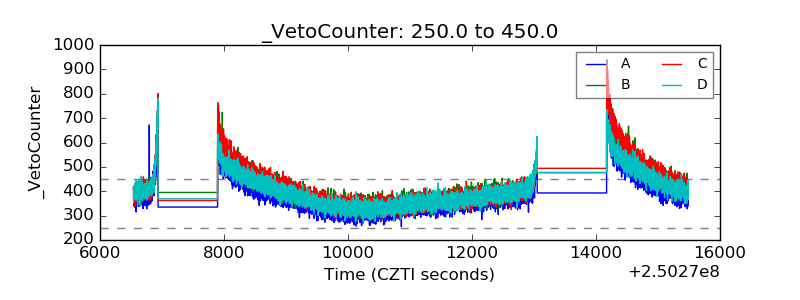 |