| Param | Original file | Final file |
|---|---|---|
| Filename | modeM0/AS1A04_088T03_9000001750_11852cztM0_level2.evt | modeM0/AS1A04_088T03_9000001750_11852cztM0_level2_quad_clean.evt |
| Size (bytes) | 442,768,320 | 102,582,720 |
| Size | 422.3 MB | 97.8 MB |
| Events in quadrant A | 3,236,706 | 676,670 |
| Events in quadrant B | 3,610,472 | 681,867 |
| Events in quadrant C | 2,904,291 | 673,402 |
| Events in quadrant D | 3,231,059 | 636,607 |
| Mode SS | |||
|---|---|---|---|
| Quadrant | BADHDUFLAG | Total packets | Discarded packets |
| A | 0 | 128 | 0 |
| B | 0 | 128 | 0 |
| C | 0 | 128 | 0 |
| D | 0 | 128 | 0 |
| Mode M0 | |||
|---|---|---|---|
| Quadrant | BADHDUFLAG | Total packets | Discarded packets |
| A | 0 | 13899 | 3 |
| B | 0 | 15124 | 2 |
| C | 0 | 13042 | 2 |
| D | 0 | 14208 | 2 |
| Mode M9 | |||
|---|---|---|---|
| Quadrant | BADHDUFLAG | Total packets | Discarded packets |
| A | 0 | 12 | 0 |
| B | 0 | 12 | 0 |
| C | 0 | 12 | 0 |
| D | 0 | 13 | 0 |
| Quadrant | Total seconds | Saturated seconds | Saturation percentage |
|---|---|---|---|
| A | 6277 | 48 | 0.764697% |
| B | 6277 | 168 | 2.676438% |
| C | 6277 | 24 | 0.382348% |
| D | 6277 | 81 | 1.290425% |
Noise dominated data is calculated using 1-second bins in cleaned event files. If a bin has >2000 counts, and if more than 50% of those come from <1% of pixels, then it is considered to be noise-dominated and hence unusable.
| Quadrant | # 1 sec bins | Bins with >0 counts | Bins with >2000 counts | High rate bins dominated by noise | Noise dominated (total time) | Noise dominated (detector-on time) | Marked lightcurve |
|---|---|---|---|---|---|---|---|
| A | 7488 | 6279 | 1 | 1 | 0.01% | 0.02% | 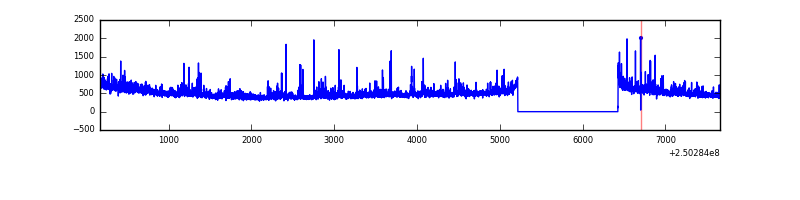 |
| B | 7488 | 6279 | 69 | 69 | 0.92% | 1.10% | 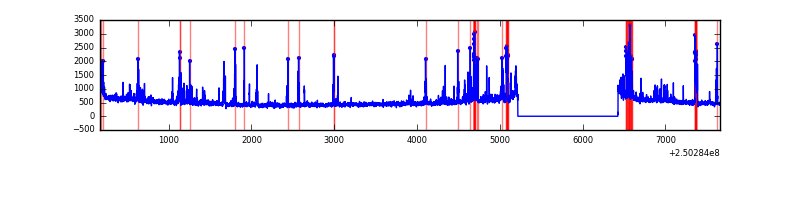 |
| C | 7488 | 6279 | 0 | 0 | 0.00% | 0.00% | 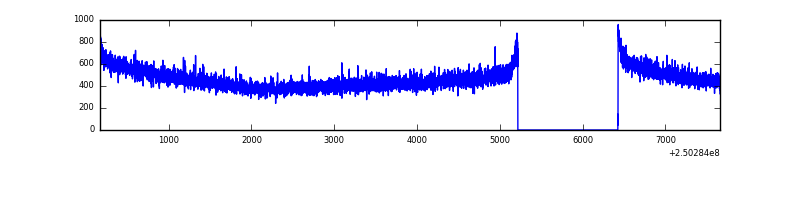 |
| D | 7488 | 6279 | 38 | 38 | 0.51% | 0.61% | 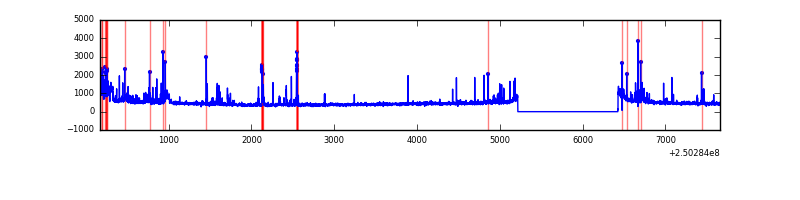 |
Top three noisy pixels from each quadrant. If the there are fewer than three noisy pixels in the level2.evt file, extra rows are filled as -1
| Pixel properties | Quadrant properties | ||||||
|---|---|---|---|---|---|---|---|
| Quadrant | DetID | PixID | Counts | Sigma | Mean | Median | Sigma |
| A | 1 | 162 | 125574 | 817.74 | 759 | 746 | 152.6 |
| A | 1 | 178 | 64134 | 415.25 | 759 | 746 | 152.6 |
| A | 1 | 161 | 56853 | 367.55 | 759 | 746 | 152.6 |
| B | 4 | 239 | 459299 | 3214.02 | 758 | 740 | 142.7 |
| B | 15 | 204 | 45434 | 313.25 | 758 | 740 | 142.7 |
| B | 10 | 245 | 39147 | 269.19 | 758 | 740 | 142.7 |
| C | 13 | 61 | 5480 | 27.53 | 745 | 751 | 171.8 |
| C | 3 | 202 | 1864 | 6.48 | 745 | 751 | 171.8 |
| C | -1 | -1 | -1 | -1.0 | 745 | 751 | 171.8 |
| D | 1 | 52 | 105851 | 604.82 | 729 | 707 | 173.8 |
| D | 13 | 104 | 86075 | 491.06 | 729 | 707 | 173.8 |
| D | 13 | 122 | 83960 | 478.89 | 729 | 707 | 173.8 |
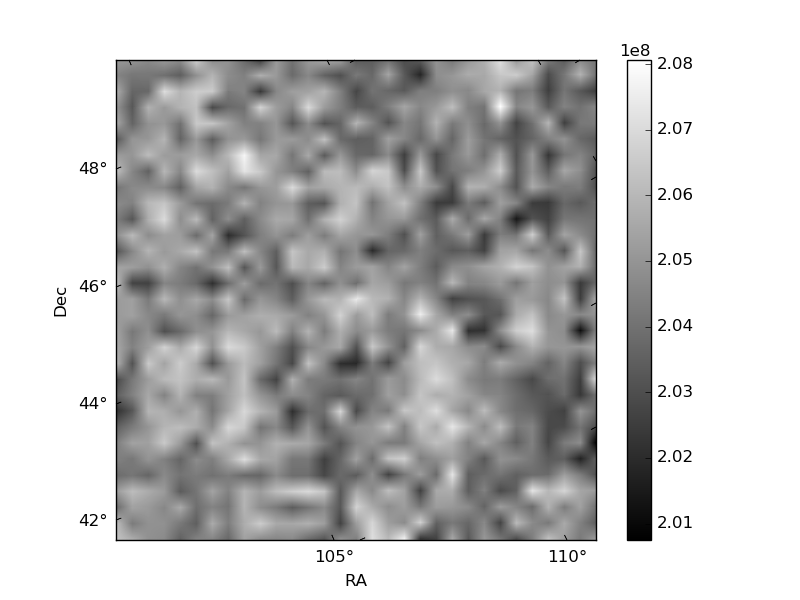
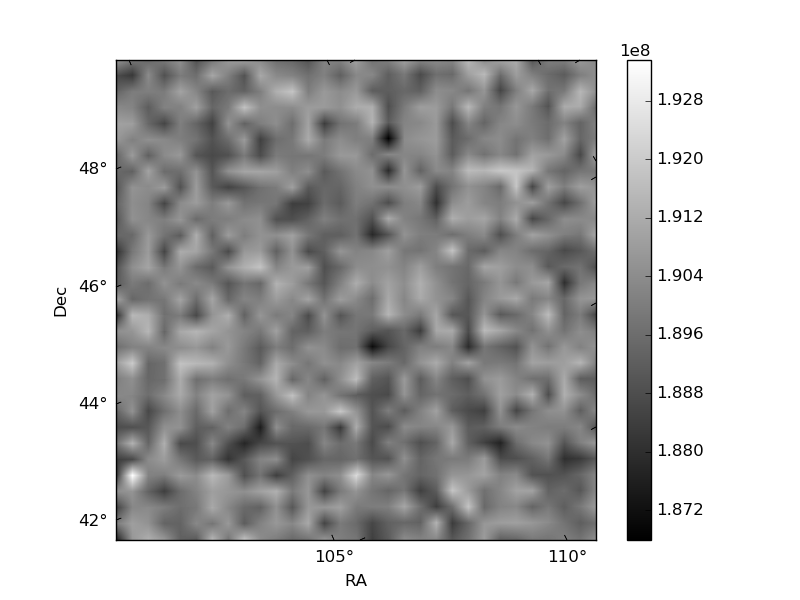
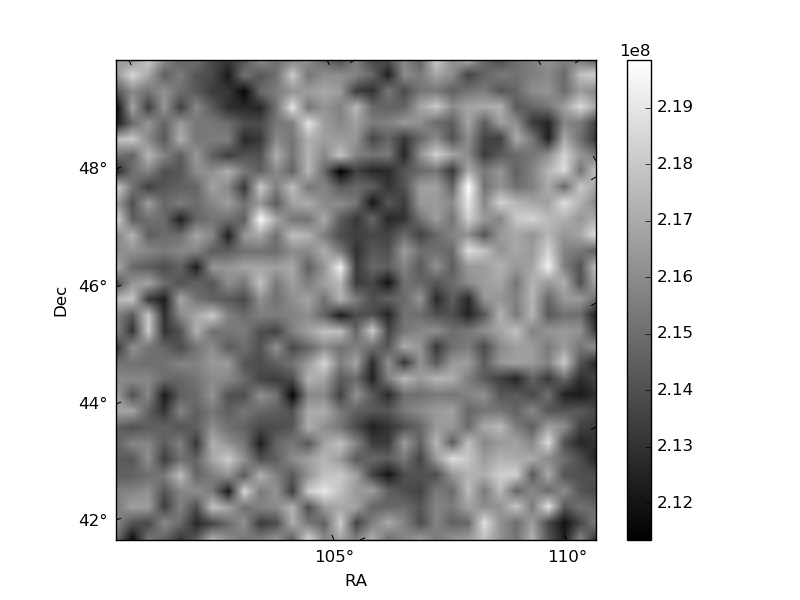
Histogram calculated using DETX and DETY for each event in the final _common_clean file
| Quadrant A | 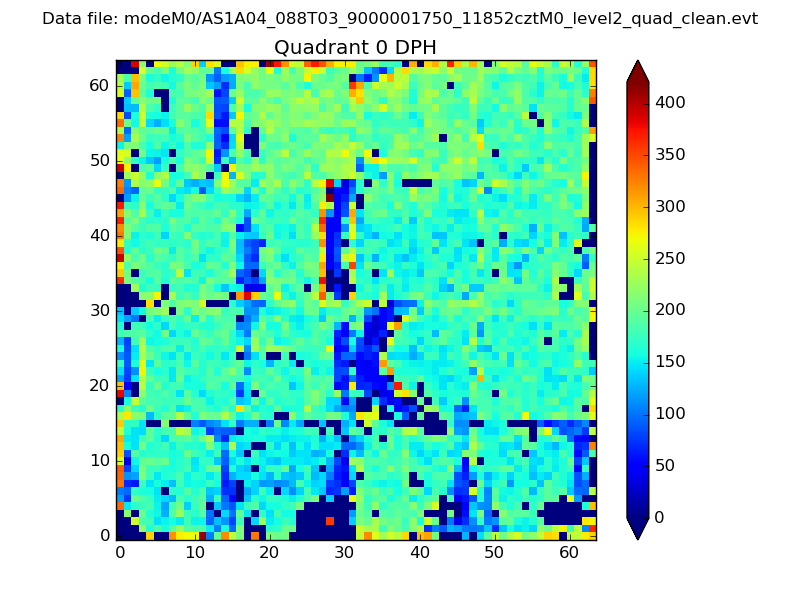 |
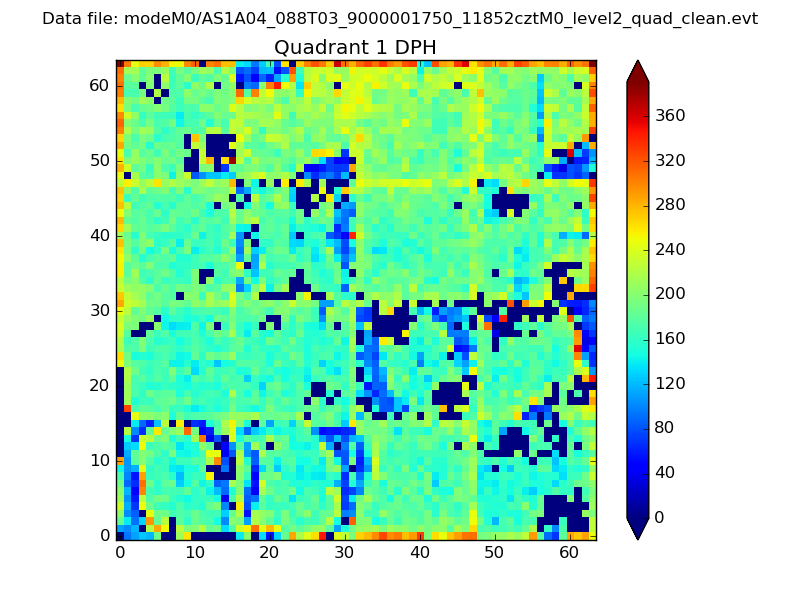 |
Quadrant B |
|---|---|---|---|
| Quadrant D | 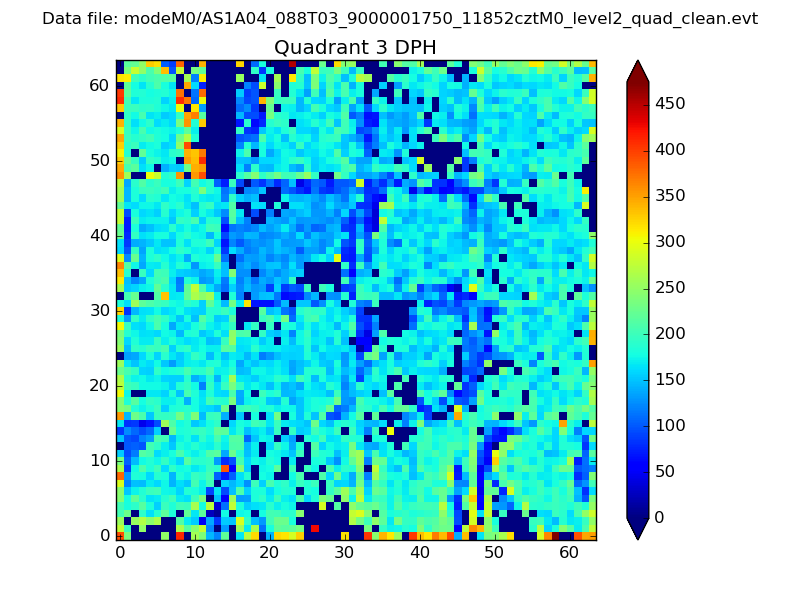 |
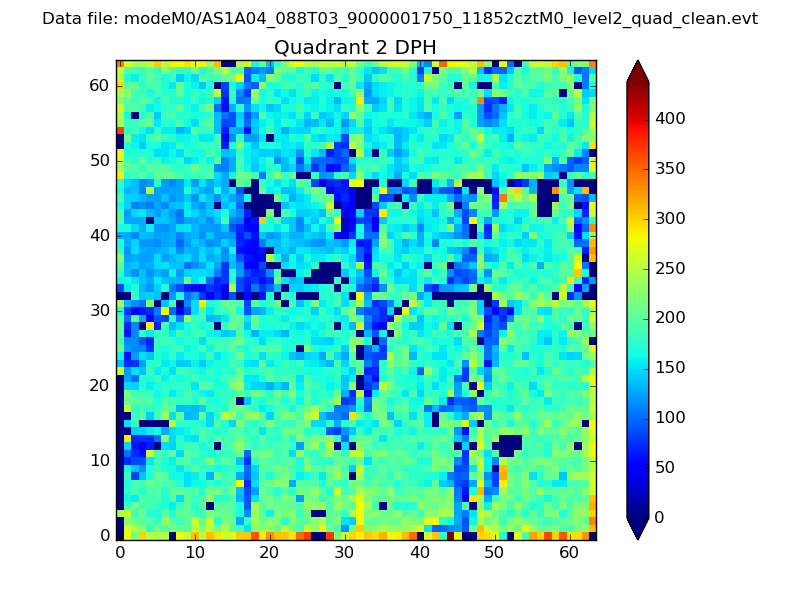 |
Quadrant C |
| Plot type | Count rate plots | Images |
|---|---|---|
| Comparison with Poisson distribution Blue bars denote a histogram of data divided into 1 sec bins. Red curve is a Poisson curve with rate = median count rate of data. |
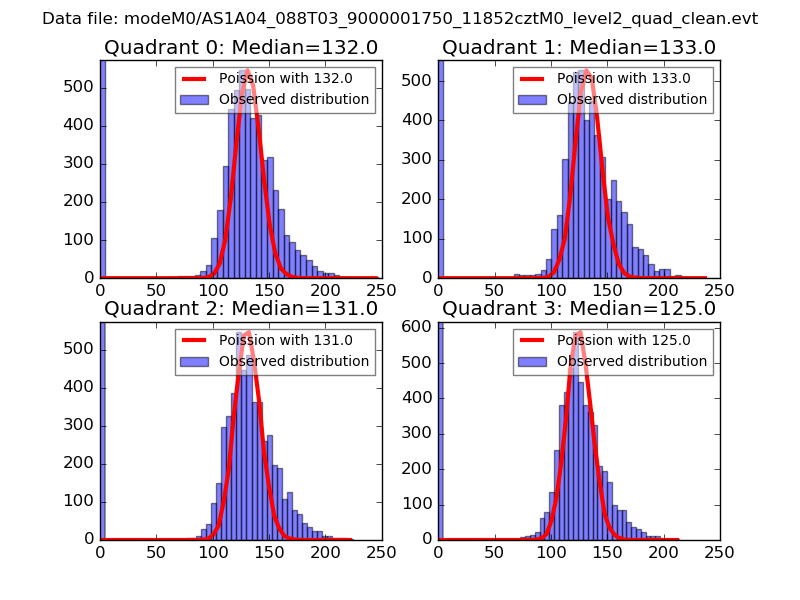 |
 |
| Quadrant-wise count rates Data is divided into 100 sec bins |
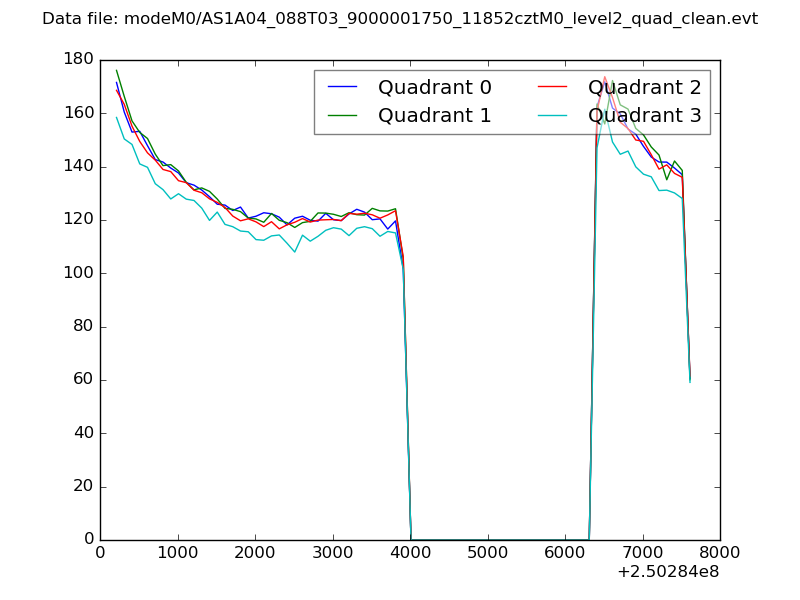 |
|
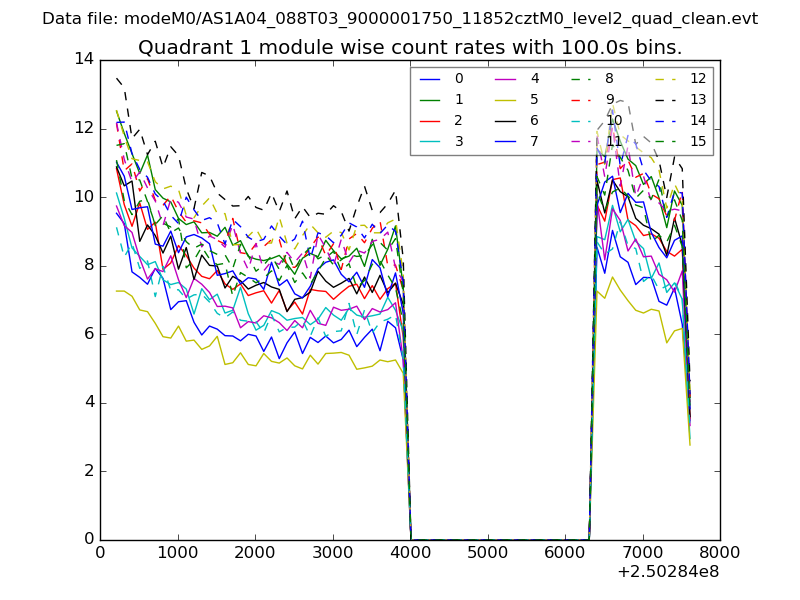
| Module-wise count rates for Quadrant A Data is divided into 100 sec bins |
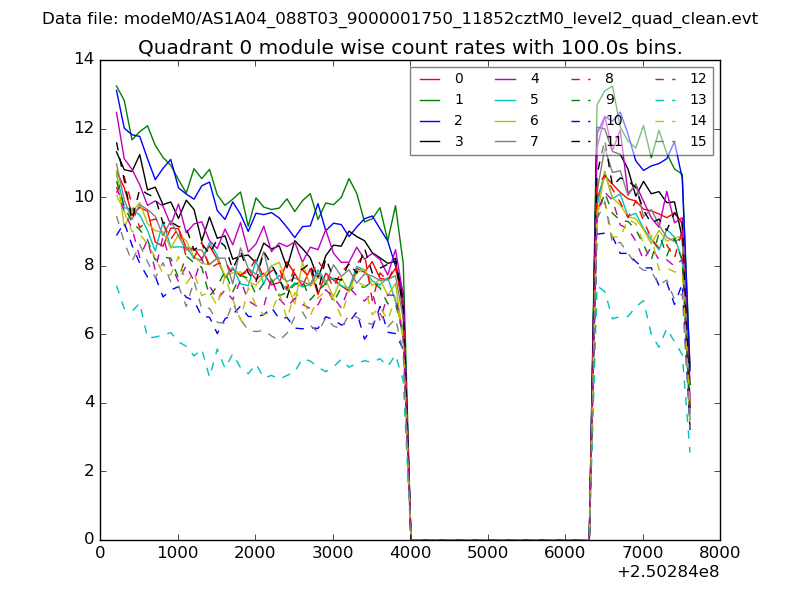 |
 |
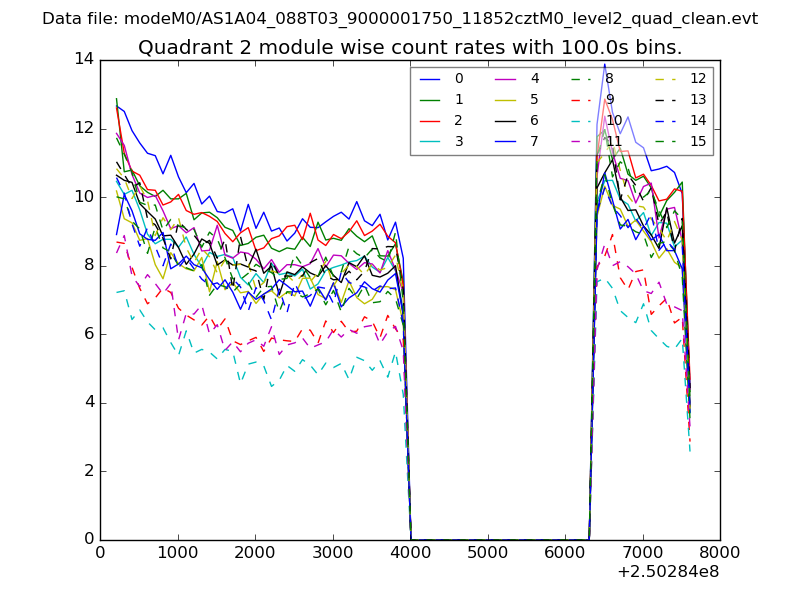
| Module-wise count rates for Quadrant B Data is divided into 100 sec bins |
 |
 |
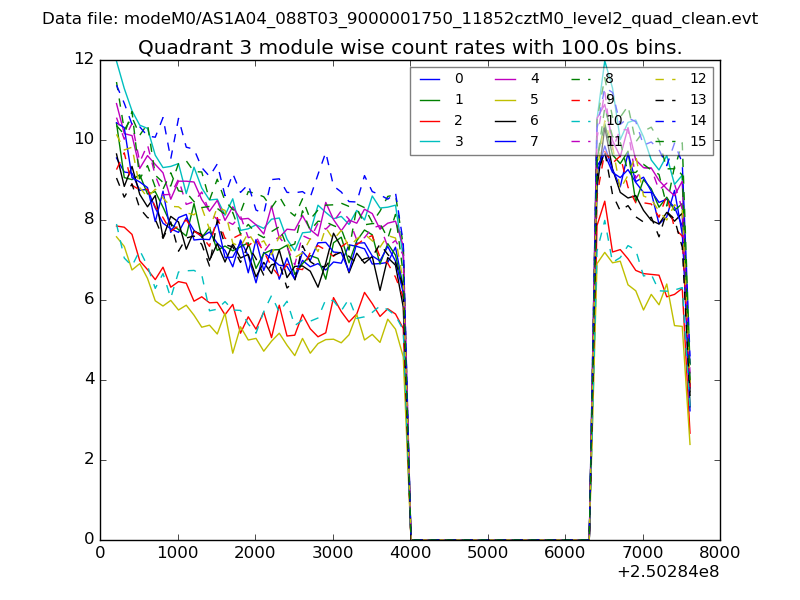
| Module-wise count rates for Quadrant C Data is divided into 100 sec bins |
 |
 |
| Module-wise count rates for Quadrant D Data is divided into 100 sec bins |
 |
 |
| Parameter | Plot |
|---|---|
| CZT HV Monitor | 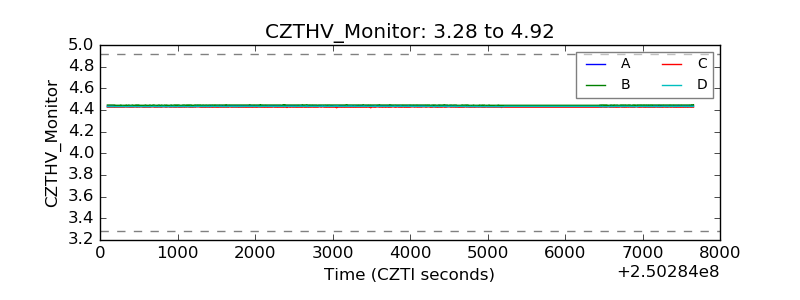 |
| D_VDD | 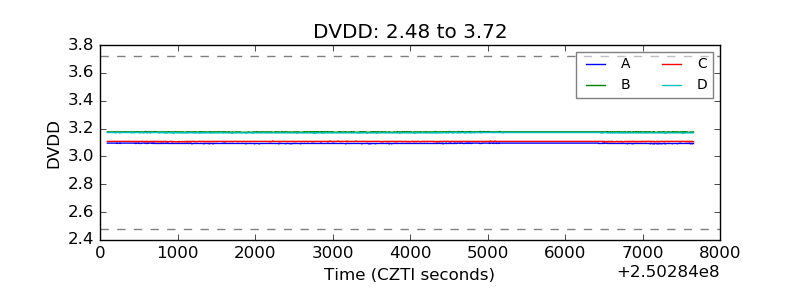 |
| Temperature 1 | 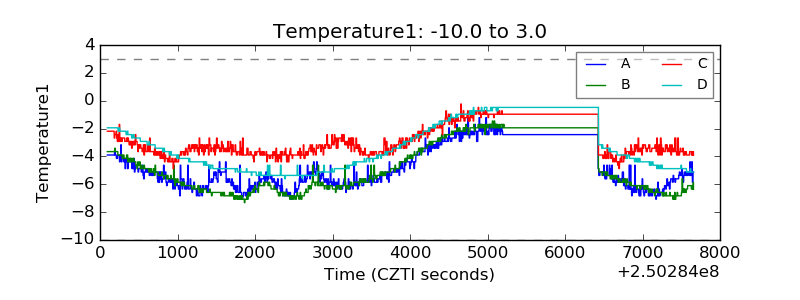 |
| Veto HV Monitor | 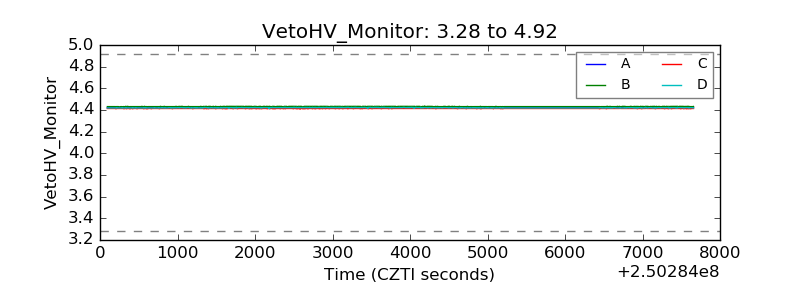 |
| Veto LLD |  |
| Alpha Counter | 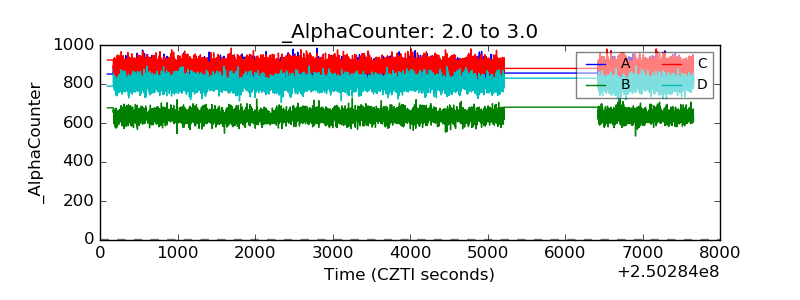 |
| _CPM_Rate | 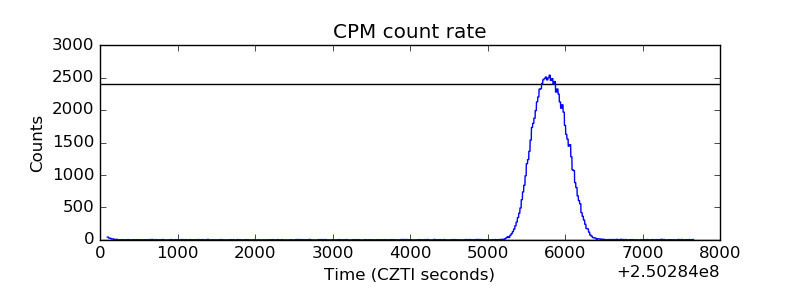 |
| CZT Counter | 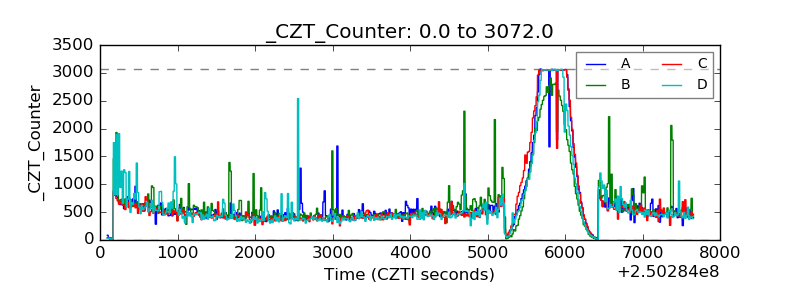 |
| +2.5 Volts monitor |  |
| +5 Volts monitor |  |
| _ROLL_ROT | 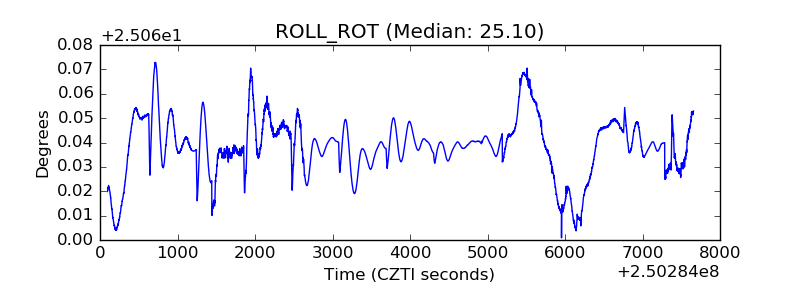 |
| _Roll_DEC | 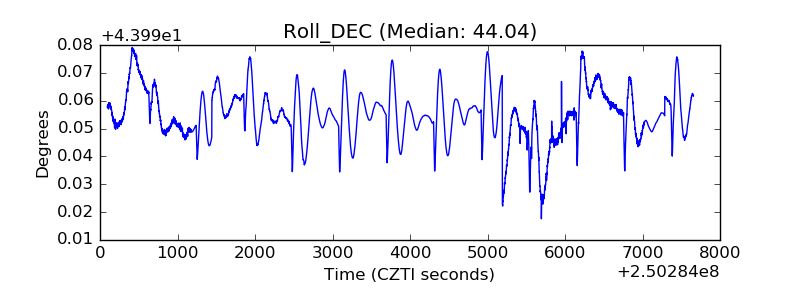 |
| _Roll_RA | 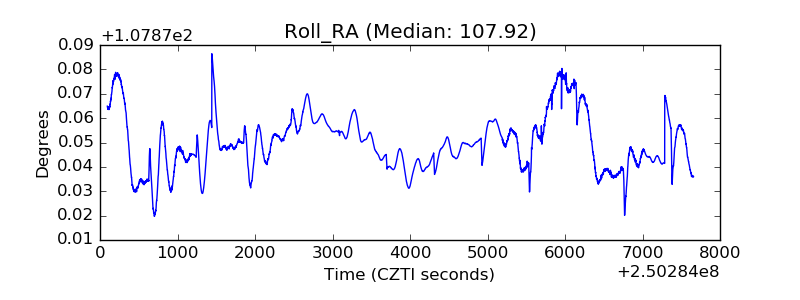 |
| Veto Counter | 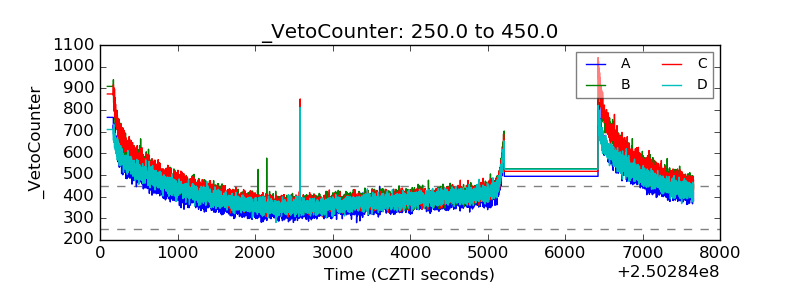 |