| Param | Original file | Final file |
|---|---|---|
| Filename | modeM0/AS1A04_088T03_9000001750_11853cztM0_level2.evt | modeM0/AS1A04_088T03_9000001750_11853cztM0_level2_quad_clean.evt |
| Size (bytes) | 440,136,000 | 97,712,640 |
| Size | 419.7 MB | 93.2 MB |
| Events in quadrant A | 3,134,555 | 643,113 |
| Events in quadrant B | 3,618,157 | 652,666 |
| Events in quadrant C | 2,849,890 | 639,088 |
| Events in quadrant D | 3,312,465 | 598,493 |
| Mode SS | |||
|---|---|---|---|
| Quadrant | BADHDUFLAG | Total packets | Discarded packets |
| A | 0 | 124 | 0 |
| B | 0 | 124 | 0 |
| C | 0 | 124 | 0 |
| D | 0 | 124 | 0 |
| Mode M0 | |||
|---|---|---|---|
| Quadrant | BADHDUFLAG | Total packets | Discarded packets |
| A | 0 | 13407 | 3 |
| B | 0 | 14793 | 2 |
| C | 0 | 12641 | 2 |
| D | 0 | 14147 | 2 |
| Mode M9 | |||
|---|---|---|---|
| Quadrant | BADHDUFLAG | Total packets | Discarded packets |
| A | 0 | 21 | 0 |
| B | 0 | 21 | 0 |
| C | 0 | 21 | 0 |
| D | 0 | 22 | 0 |
| Quadrant | Total seconds | Saturated seconds | Saturation percentage |
|---|---|---|---|
| A | 6100 | 38 | 0.622951% |
| B | 6100 | 171 | 2.803279% |
| C | 6100 | 7 | 0.114754% |
| D | 6100 | 75 | 1.229508% |
Noise dominated data is calculated using 1-second bins in cleaned event files. If a bin has >2000 counts, and if more than 50% of those come from <1% of pixels, then it is considered to be noise-dominated and hence unusable.
| Quadrant | # 1 sec bins | Bins with >0 counts | Bins with >2000 counts | High rate bins dominated by noise | Noise dominated (total time) | Noise dominated (detector-on time) | Marked lightcurve |
|---|---|---|---|---|---|---|---|
| A | 7411 | 6102 | 1 | 1 | 0.01% | 0.02% | 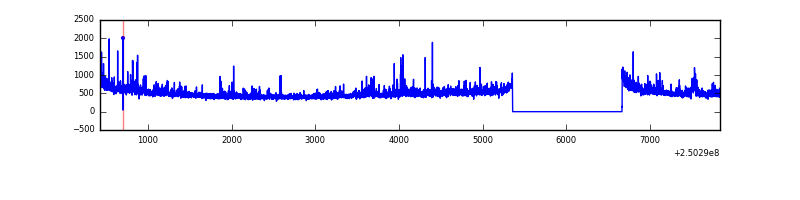 |
| B | 7411 | 6102 | 73 | 73 | 0.99% | 1.20% |  |
| C | 7411 | 6102 | 0 | 0 | 0.00% | 0.00% | 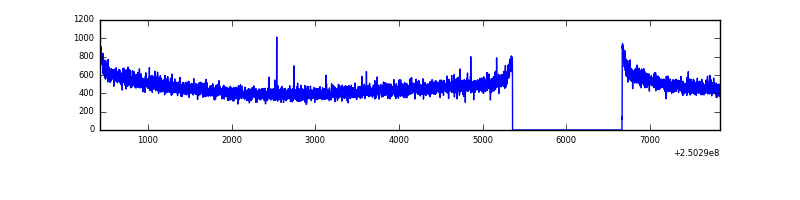 |
| D | 7411 | 6102 | 48 | 48 | 0.65% | 0.79% |  |
Top three noisy pixels from each quadrant. If the there are fewer than three noisy pixels in the level2.evt file, extra rows are filled as -1
| Pixel properties | Quadrant properties | ||||||
|---|---|---|---|---|---|---|---|
| Quadrant | DetID | PixID | Counts | Sigma | Mean | Median | Sigma |
| A | 1 | 162 | 100645 | 666.83 | 745 | 731 | 149.8 |
| A | 1 | 178 | 52863 | 347.93 | 745 | 731 | 149.8 |
| A | 1 | 161 | 46114 | 302.89 | 745 | 731 | 149.8 |
| B | 4 | 239 | 509279 | 3631.86 | 751 | 733 | 140.0 |
| B | 15 | 204 | 41892 | 293.94 | 751 | 733 | 140.0 |
| B | 10 | 252 | 35508 | 248.35 | 751 | 733 | 140.0 |
| C | 13 | 61 | 5410 | 27.98 | 730 | 736 | 167.1 |
| C | 12 | 4 | 2465 | 10.35 | 730 | 736 | 167.1 |
| C | 3 | 202 | 1813 | 6.45 | 730 | 736 | 167.1 |
| D | 1 | 52 | 294144 | 1747.46 | 711 | 691 | 167.9 |
| D | 13 | 104 | 222109 | 1318.5 | 711 | 691 | 167.9 |
| D | 10 | 199 | 40530 | 237.23 | 711 | 691 | 167.9 |
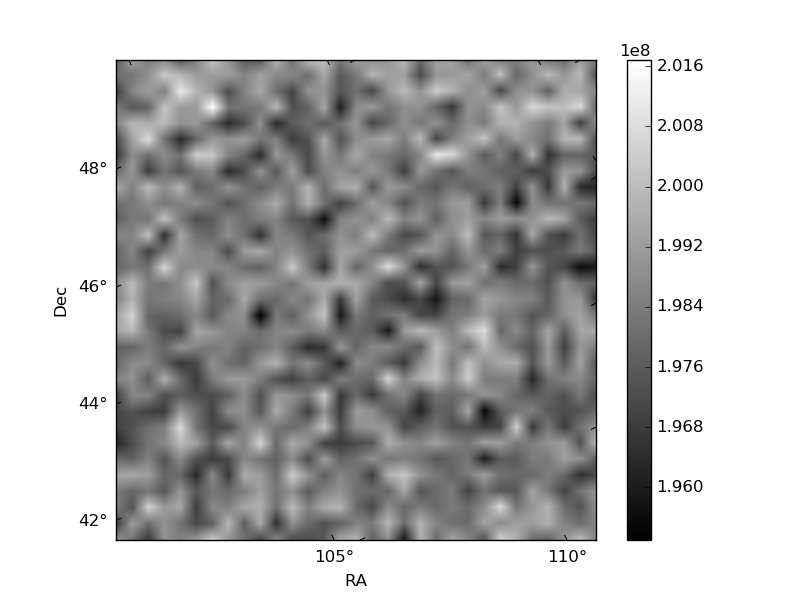
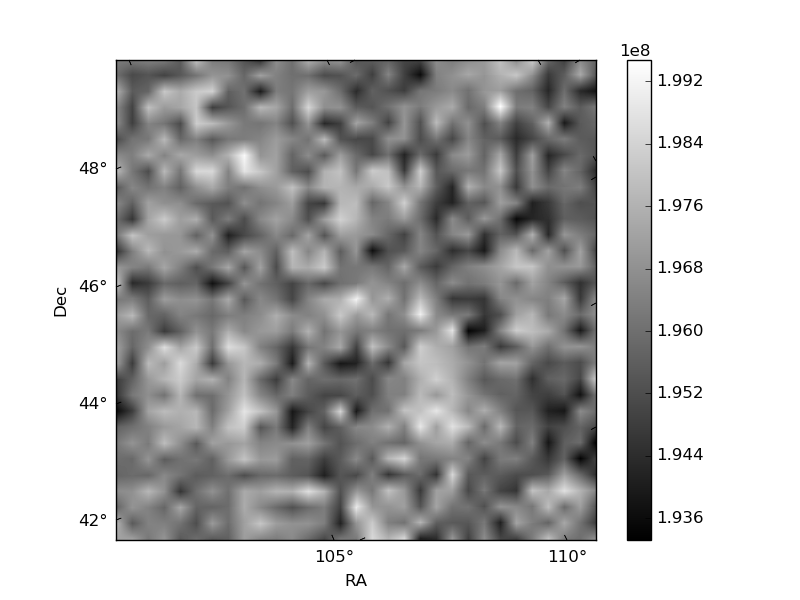
Histogram calculated using DETX and DETY for each event in the final _common_clean file
| Quadrant A | 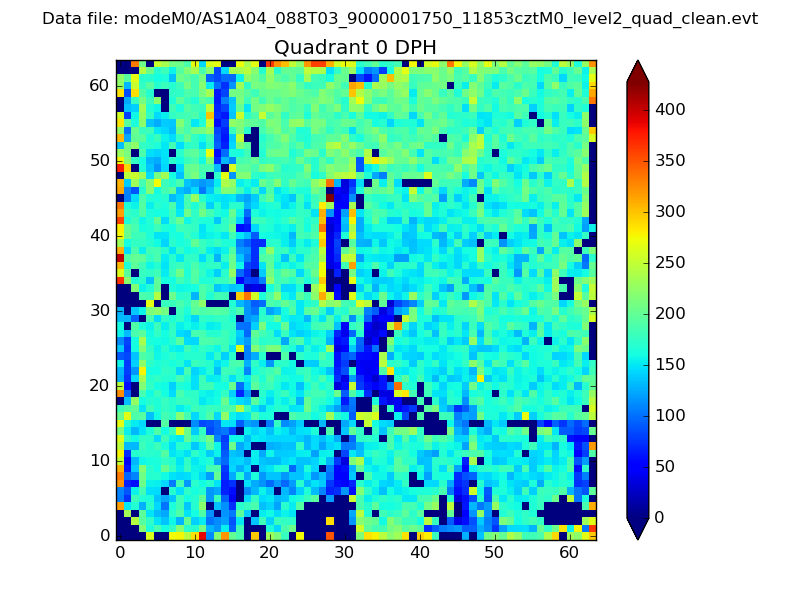 |
 |
Quadrant B |
|---|---|---|---|
| Quadrant D | 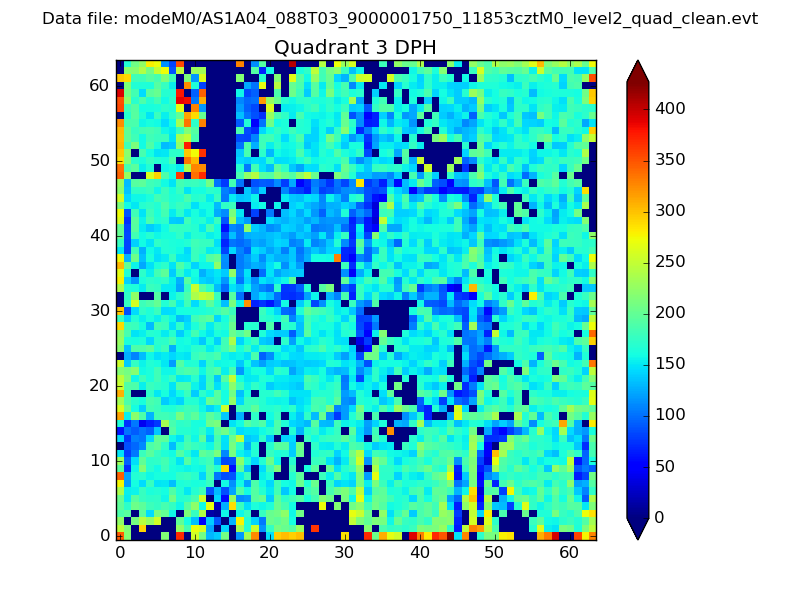 |
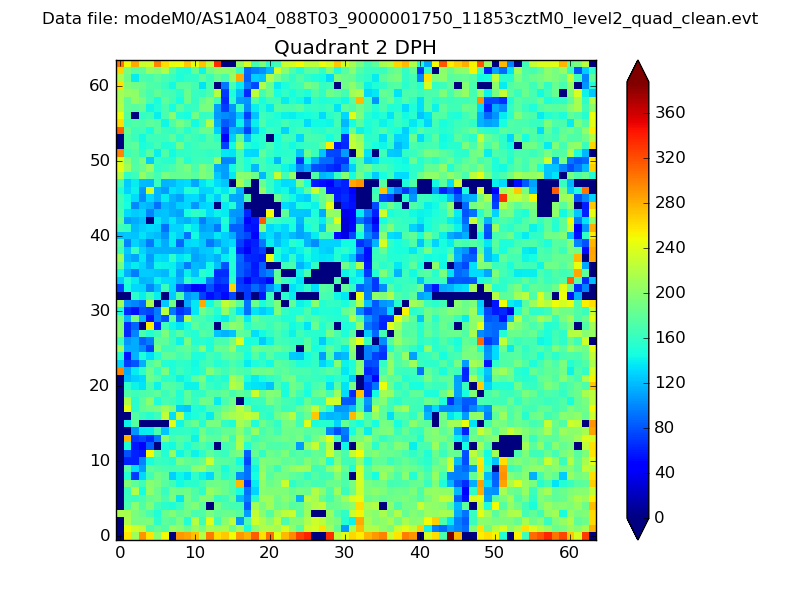 |
Quadrant C |
| Plot type | Count rate plots | Images |
|---|---|---|
| Comparison with Poisson distribution Blue bars denote a histogram of data divided into 1 sec bins. Red curve is a Poisson curve with rate = median count rate of data. |
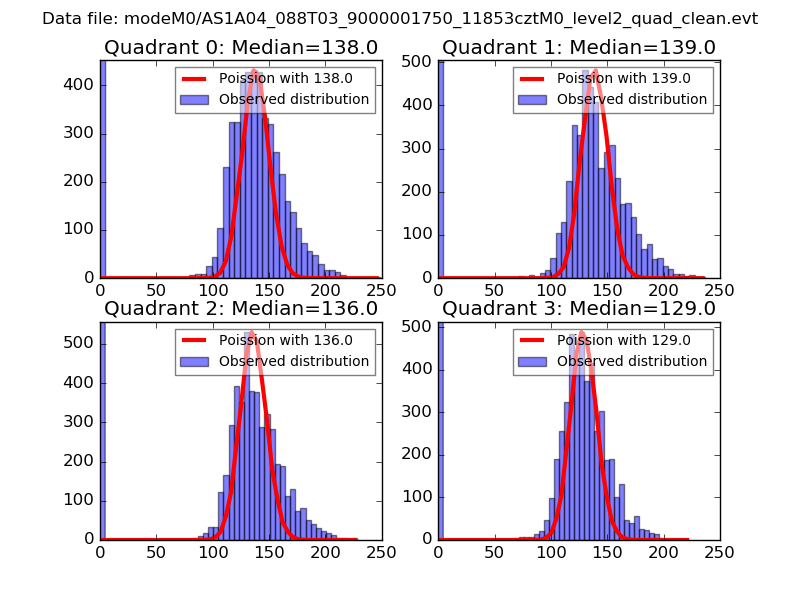 |
 |
| Quadrant-wise count rates Data is divided into 100 sec bins |
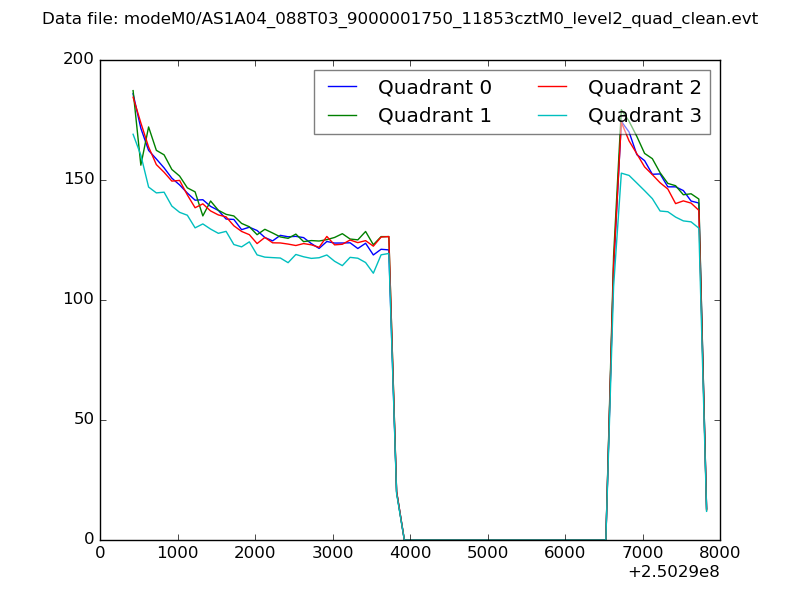 |
|
| Module-wise count rates for Quadrant A Data is divided into 100 sec bins |
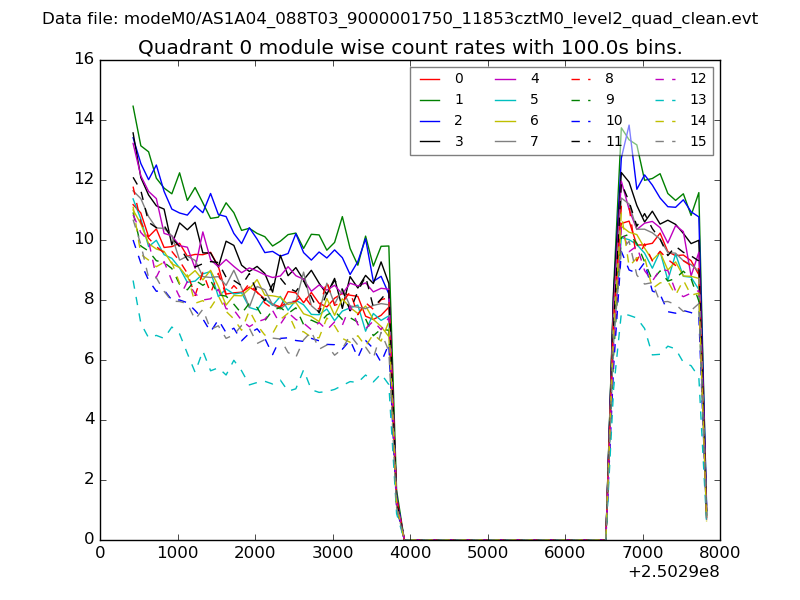 |
 |
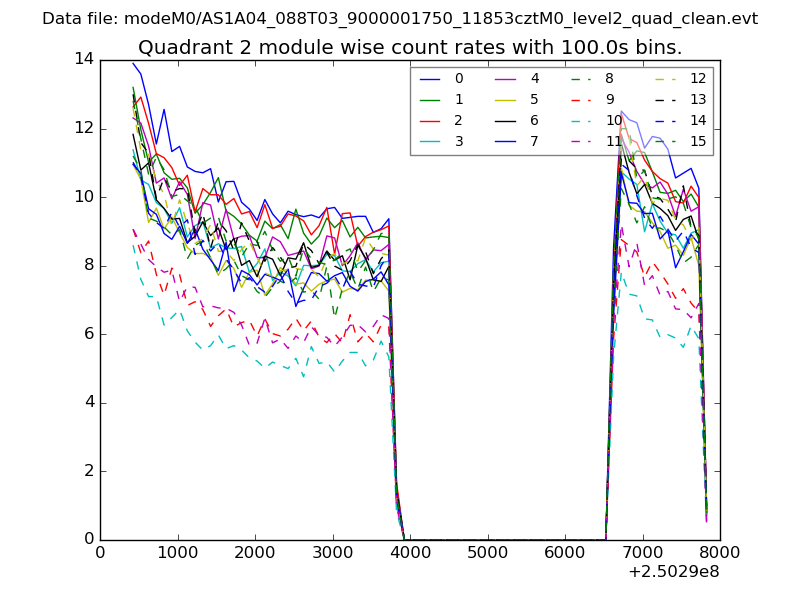
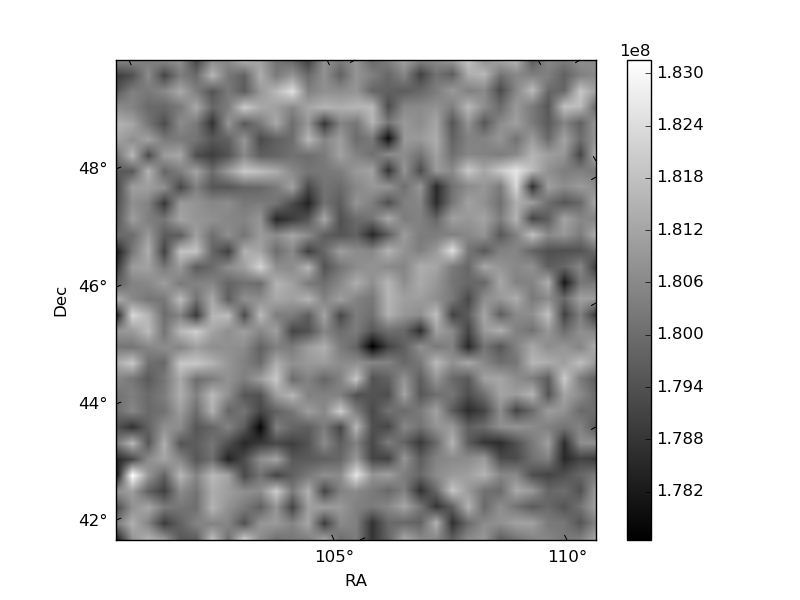
| Module-wise count rates for Quadrant B Data is divided into 100 sec bins |
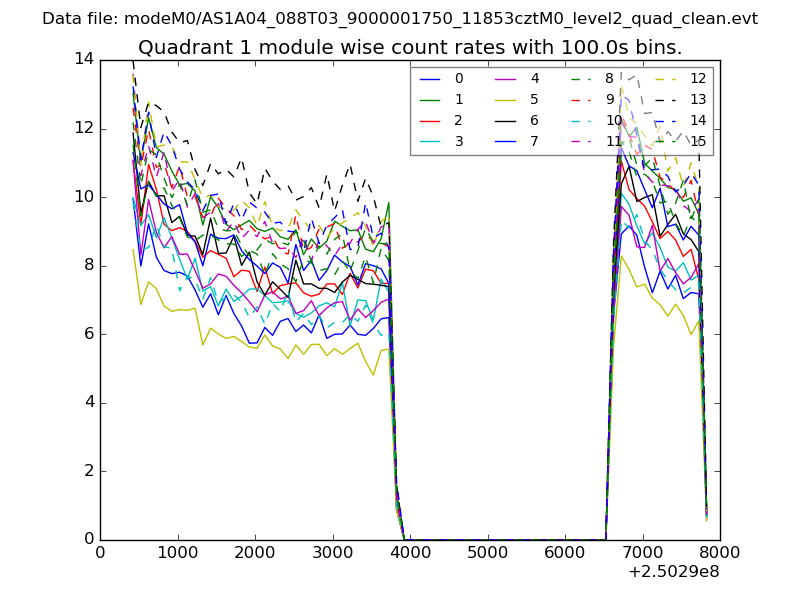 |
 |
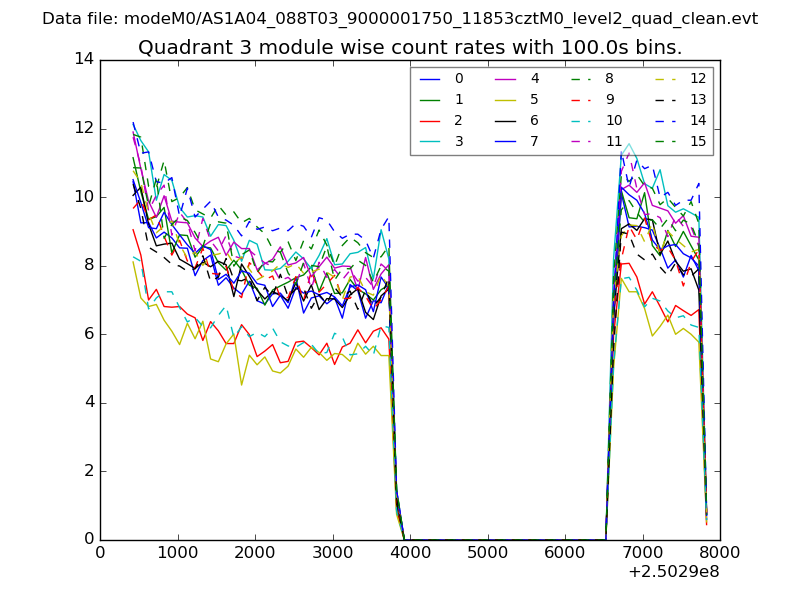
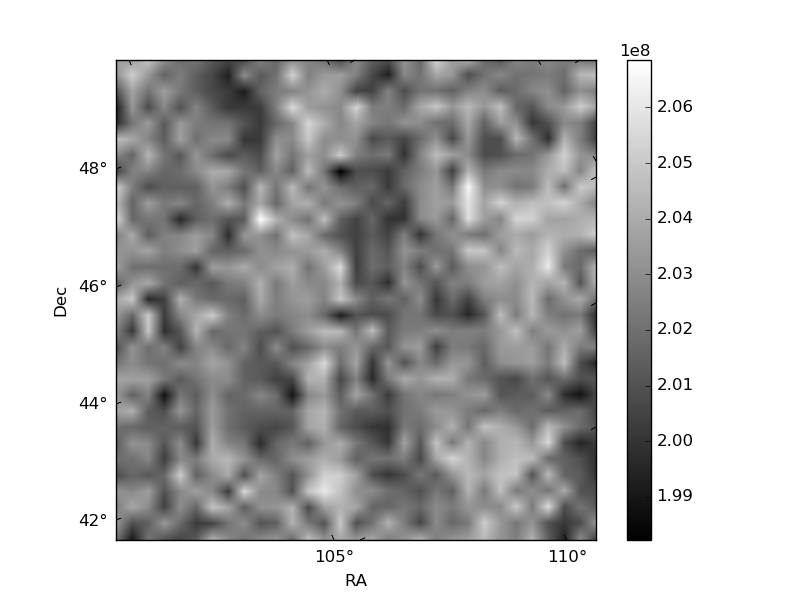
| Module-wise count rates for Quadrant C Data is divided into 100 sec bins |
 |
 |
| Module-wise count rates for Quadrant D Data is divided into 100 sec bins |
 |
 |
| Parameter | Plot |
|---|---|
| CZT HV Monitor | 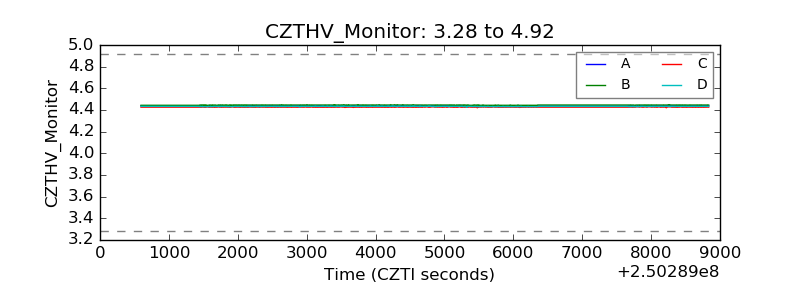 |
| D_VDD | 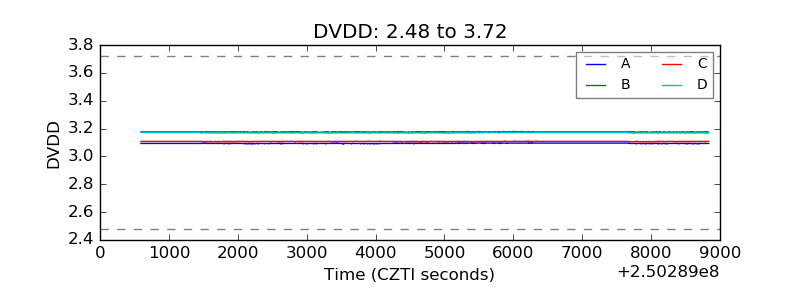 |
| Temperature 1 |  |
| Veto HV Monitor | 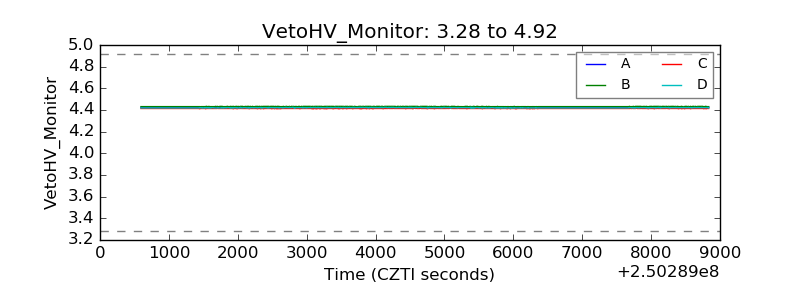 |
| Veto LLD | 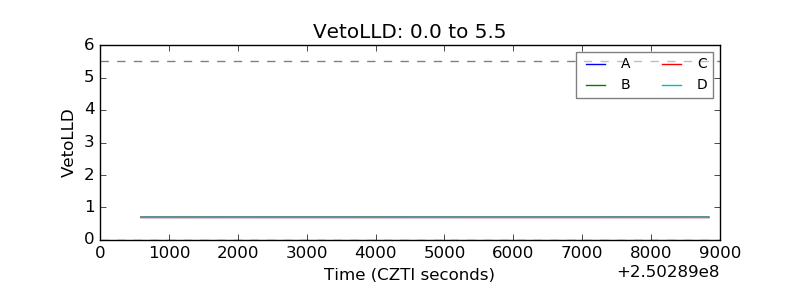 |
| Alpha Counter | 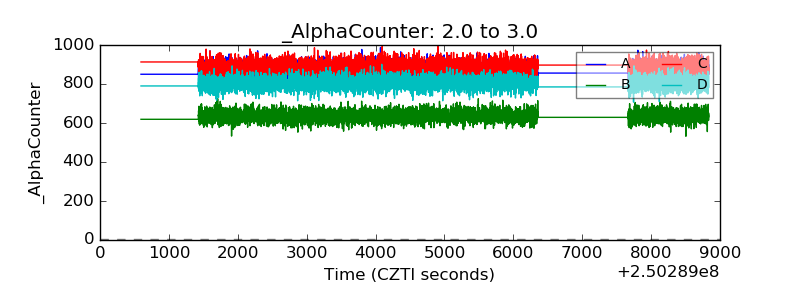 |
| _CPM_Rate | 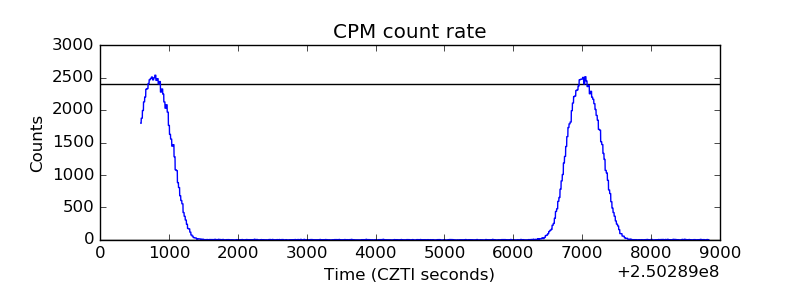 |
| CZT Counter | 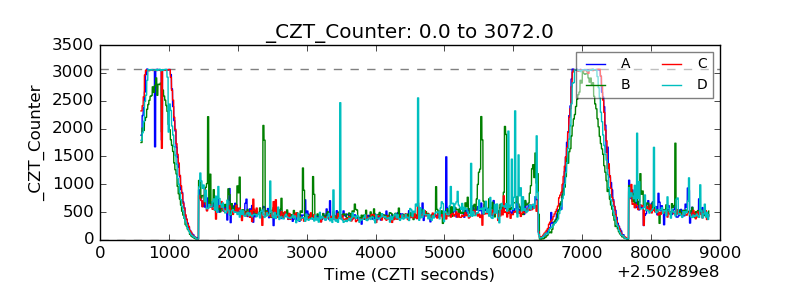 |
| +2.5 Volts monitor |  |
| +5 Volts monitor |  |
| _ROLL_ROT | 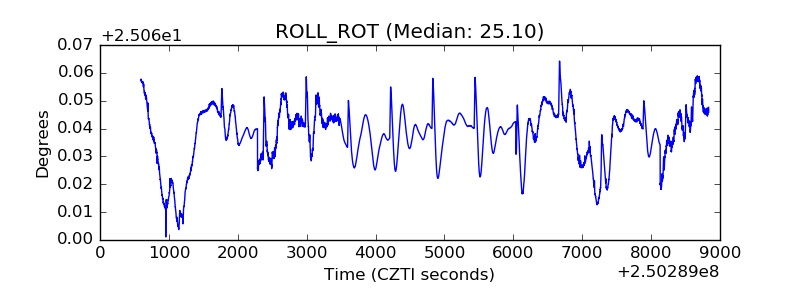 |
| _Roll_DEC | 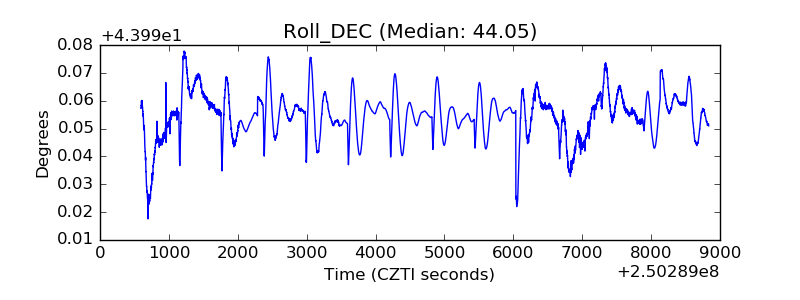 |
| _Roll_RA | 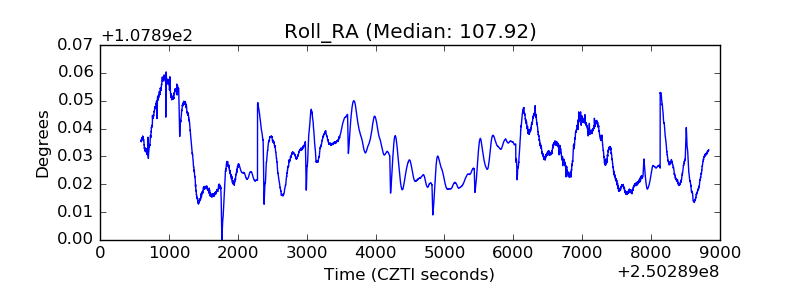 |
| Veto Counter | 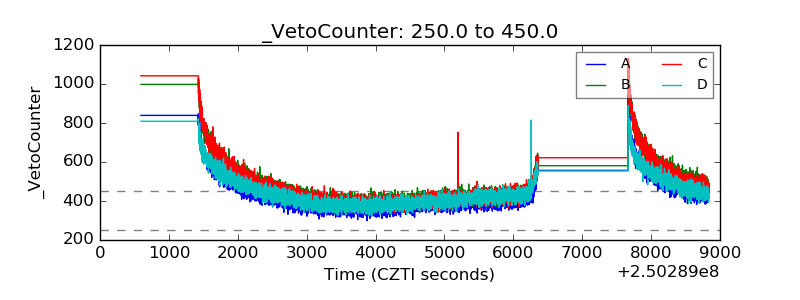 |