| Param | Original file | Final file |
|---|---|---|
| Filename | modeM0/AS1A04_088T03_9000001750_11854cztM0_level2.evt | modeM0/AS1A04_088T03_9000001750_11854cztM0_level2_quad_clean.evt |
| Size (bytes) | 450,083,520 | 93,651,840 |
| Size | 429.2 MB | 89.3 MB |
| Events in quadrant A | 3,233,534 | 611,338 |
| Events in quadrant B | 3,566,580 | 621,755 |
| Events in quadrant C | 2,881,437 | 604,275 |
| Events in quadrant D | 3,527,367 | 565,529 |
| Mode SS | |||
|---|---|---|---|
| Quadrant | BADHDUFLAG | Total packets | Discarded packets |
| A | 0 | 126 | 0 |
| B | 0 | 126 | 0 |
| C | 0 | 126 | 0 |
| D | 0 | 126 | 0 |
| Mode M0 | |||
|---|---|---|---|
| Quadrant | BADHDUFLAG | Total packets | Discarded packets |
| A | 0 | 13646 | 3 |
| B | 0 | 14630 | 2 |
| C | 0 | 12795 | 2 |
| D | 0 | 14772 | 2 |
| Mode M9 | |||
|---|---|---|---|
| Quadrant | BADHDUFLAG | Total packets | Discarded packets |
| A | 0 | 17 | 0 |
| B | 0 | 17 | 0 |
| C | 0 | 17 | 0 |
| D | 0 | 18 | 0 |
| Quadrant | Total seconds | Saturated seconds | Saturation percentage |
|---|---|---|---|
| A | 6209 | 40 | 0.644226% |
| B | 6209 | 169 | 2.721855% |
| C | 6209 | 14 | 0.225479% |
| D | 6209 | 145 | 2.335320% |
Noise dominated data is calculated using 1-second bins in cleaned event files. If a bin has >2000 counts, and if more than 50% of those come from <1% of pixels, then it is considered to be noise-dominated and hence unusable.
| Quadrant | # 1 sec bins | Bins with >0 counts | Bins with >2000 counts | High rate bins dominated by noise | Noise dominated (total time) | Noise dominated (detector-on time) | Marked lightcurve |
|---|---|---|---|---|---|---|---|
| A | 7565 | 6212 | 4 | 4 | 0.05% | 0.06% | 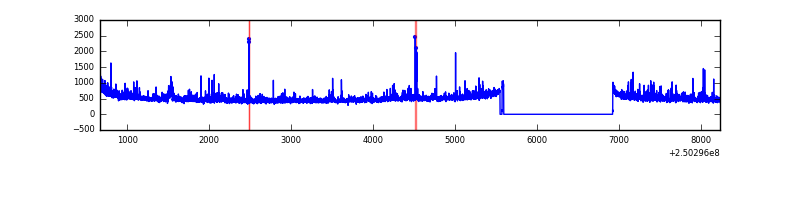 |
| B | 7565 | 6212 | 59 | 59 | 0.78% | 0.95% | 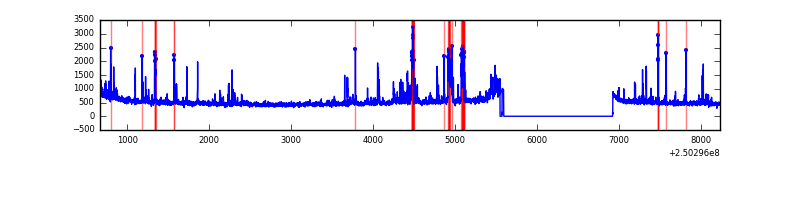 |
| C | 7565 | 6212 | 0 | 0 | 0.00% | 0.00% | 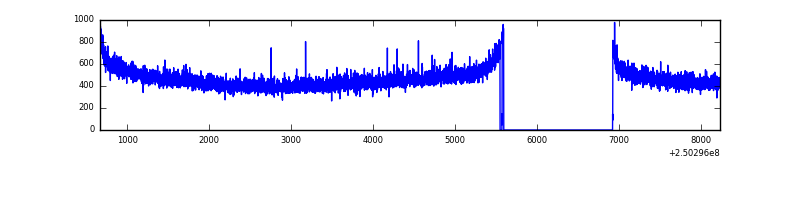 |
| D | 7565 | 6212 | 124 | 124 | 1.64% | 2.00% |  |
Top three noisy pixels from each quadrant. If the there are fewer than three noisy pixels in the level2.evt file, extra rows are filled as -1
| Pixel properties | Quadrant properties | ||||||
|---|---|---|---|---|---|---|---|
| Quadrant | DetID | PixID | Counts | Sigma | Mean | Median | Sigma |
| A | 1 | 162 | 122788 | 797.92 | 761 | 747 | 152.9 |
| A | 1 | 178 | 61753 | 398.87 | 761 | 747 | 152.9 |
| A | 1 | 161 | 53550 | 345.23 | 761 | 747 | 152.9 |
| B | 4 | 239 | 455977 | 3208.26 | 764 | 746 | 141.9 |
| B | 15 | 204 | 38866 | 268.65 | 764 | 746 | 141.9 |
| B | 11 | 51 | 27213 | 186.53 | 764 | 746 | 141.9 |
| C | 13 | 61 | 5483 | 28.02 | 738 | 743 | 169.1 |
| C | 3 | 202 | 1836 | 6.46 | 738 | 743 | 169.1 |
| C | 7 | 247 | 1795 | 6.22 | 738 | 743 | 169.1 |
| D | 1 | 52 | 521782 | 3081.88 | 719 | 699 | 169.1 |
| D | 13 | 104 | 150315 | 884.89 | 719 | 699 | 169.1 |
| D | 10 | 199 | 31440 | 181.81 | 719 | 699 | 169.1 |
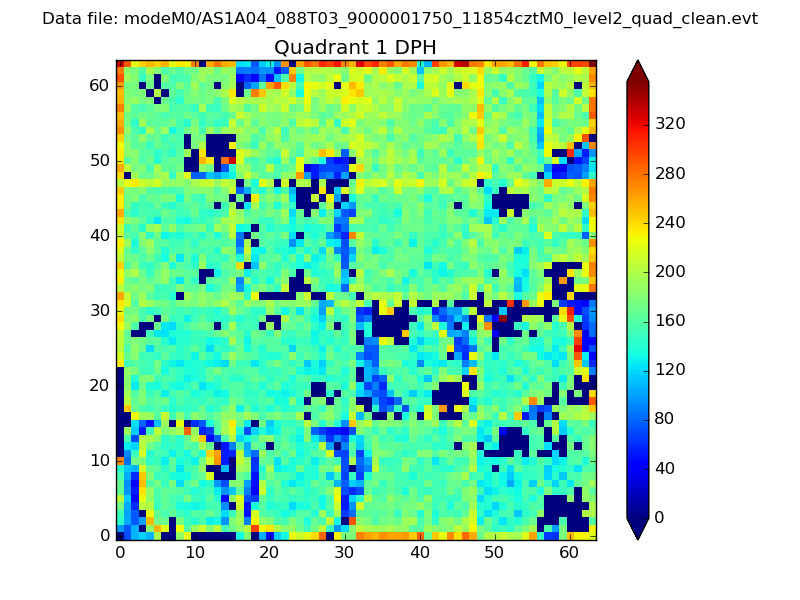
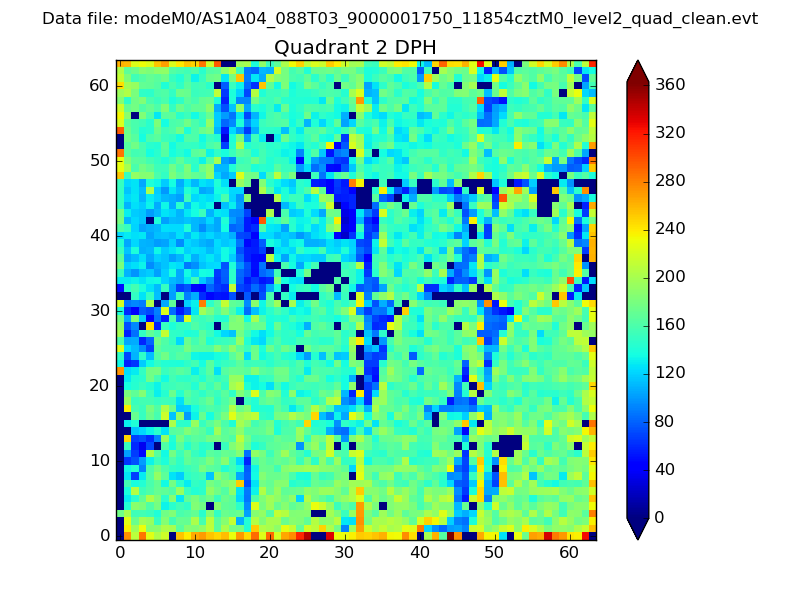
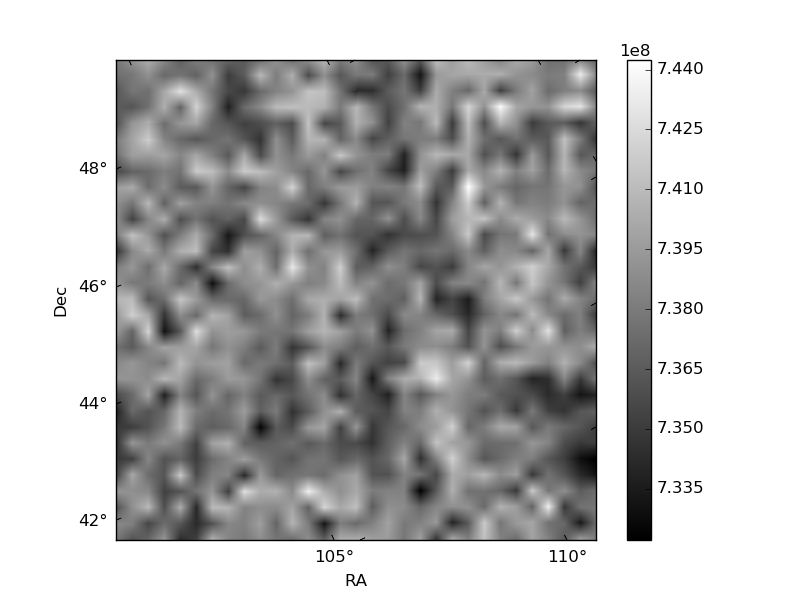
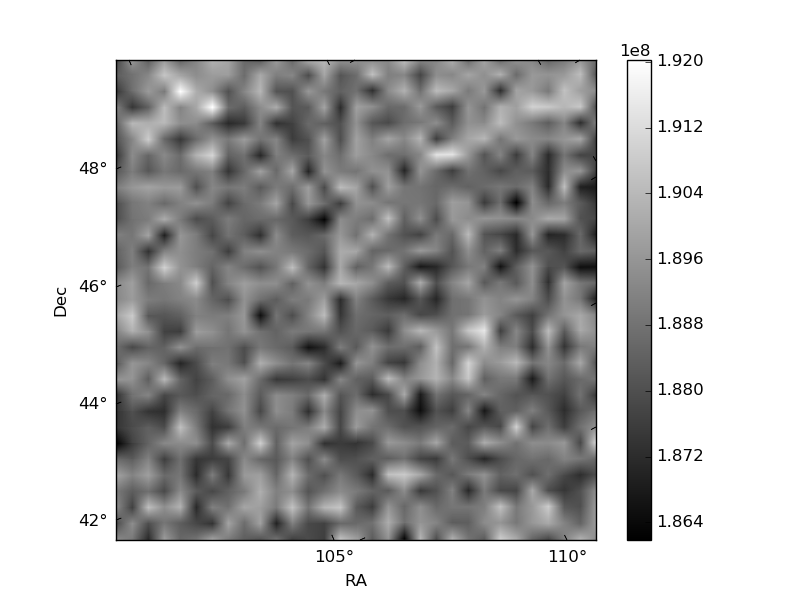
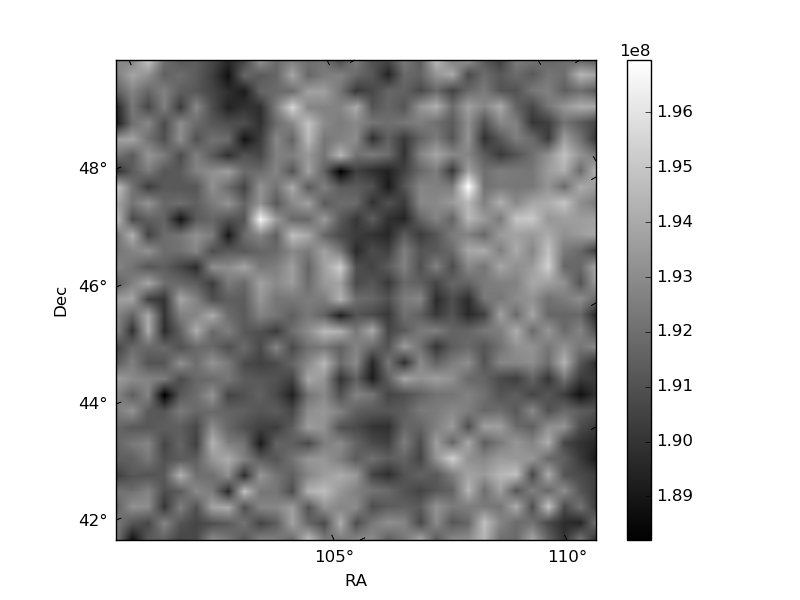
Histogram calculated using DETX and DETY for each event in the final _common_clean file
| Quadrant A | 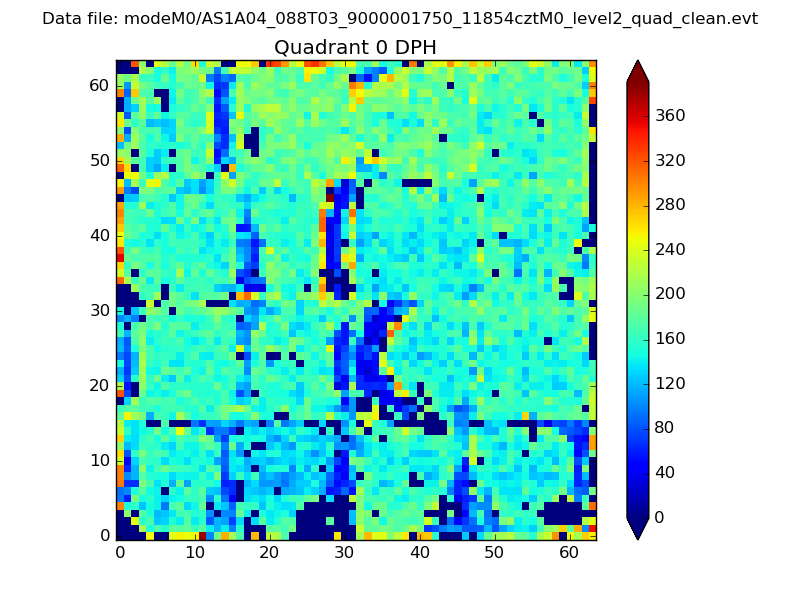 |
 |
Quadrant B |
|---|---|---|---|
| Quadrant D | 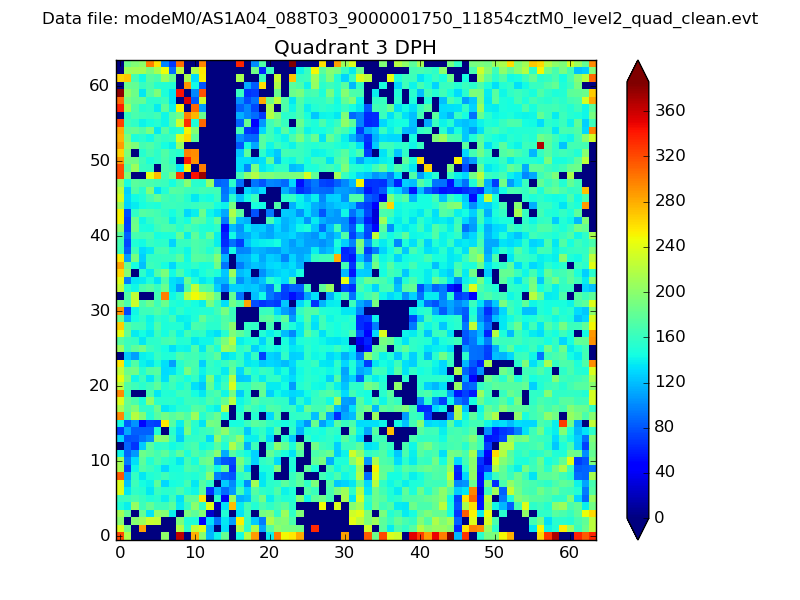 |
 |
Quadrant C |
| Plot type | Count rate plots | Images |
|---|---|---|
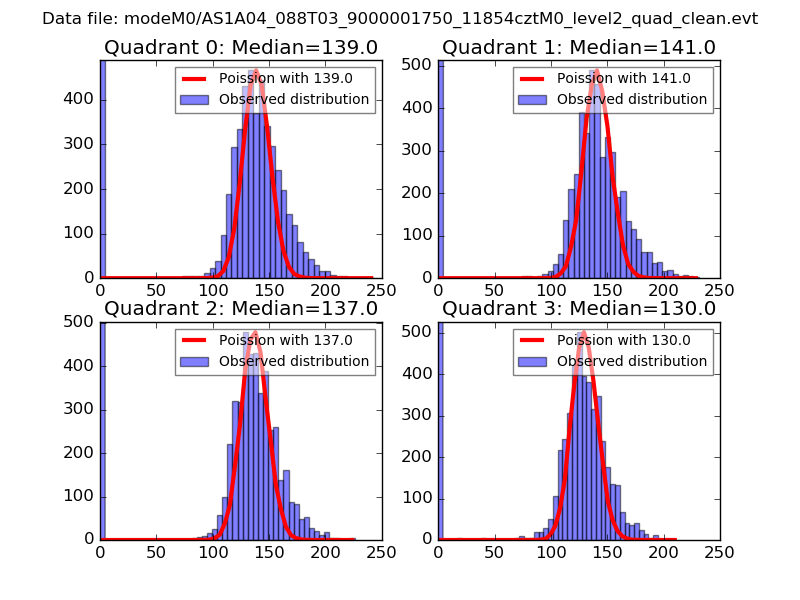
| Comparison with Poisson distribution Blue bars denote a histogram of data divided into 1 sec bins. Red curve is a Poisson curve with rate = median count rate of data. |
 |
 |
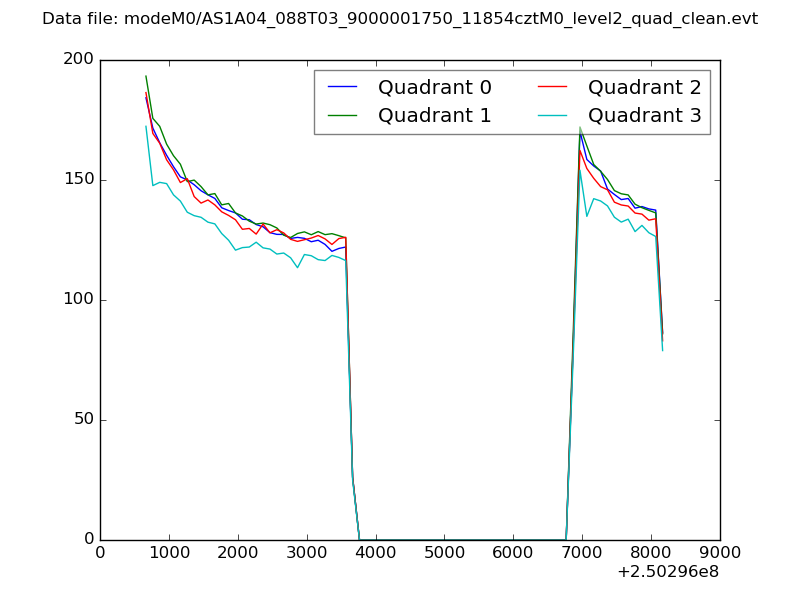
| Quadrant-wise count rates Data is divided into 100 sec bins |
 |
|
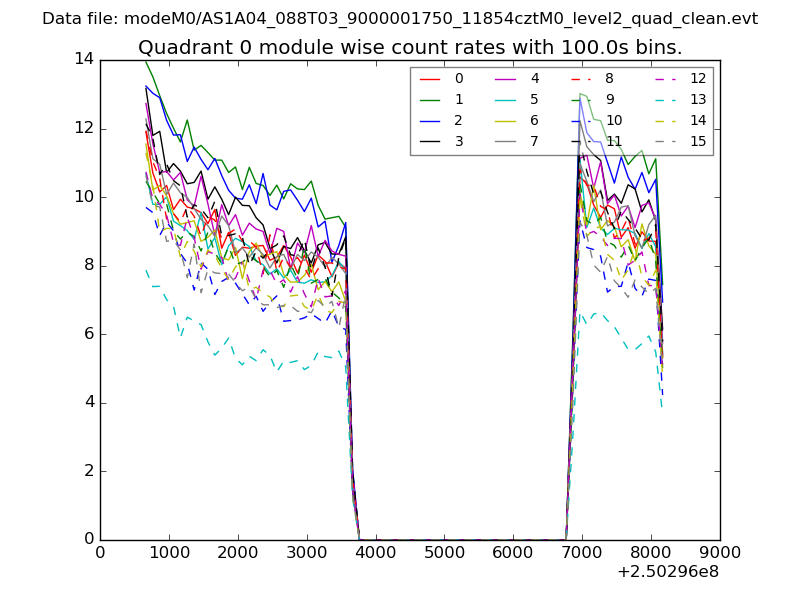
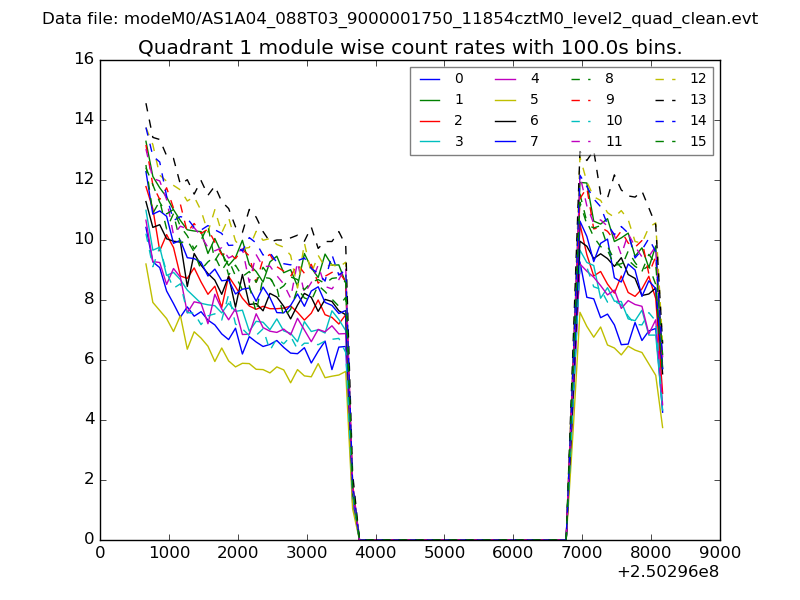
| Module-wise count rates for Quadrant A Data is divided into 100 sec bins |
 |
 |
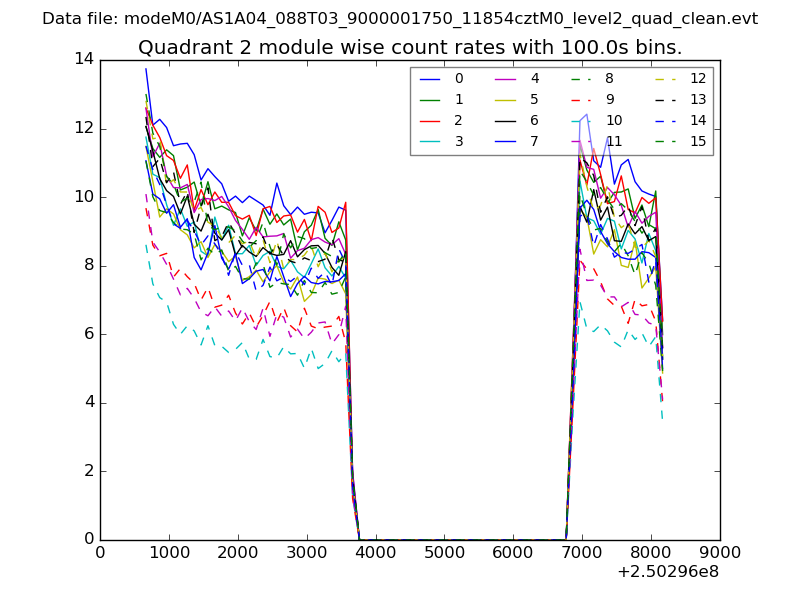
| Module-wise count rates for Quadrant B Data is divided into 100 sec bins |
 |
 |
| Module-wise count rates for Quadrant C Data is divided into 100 sec bins |
 |
 |
| Module-wise count rates for Quadrant D Data is divided into 100 sec bins |
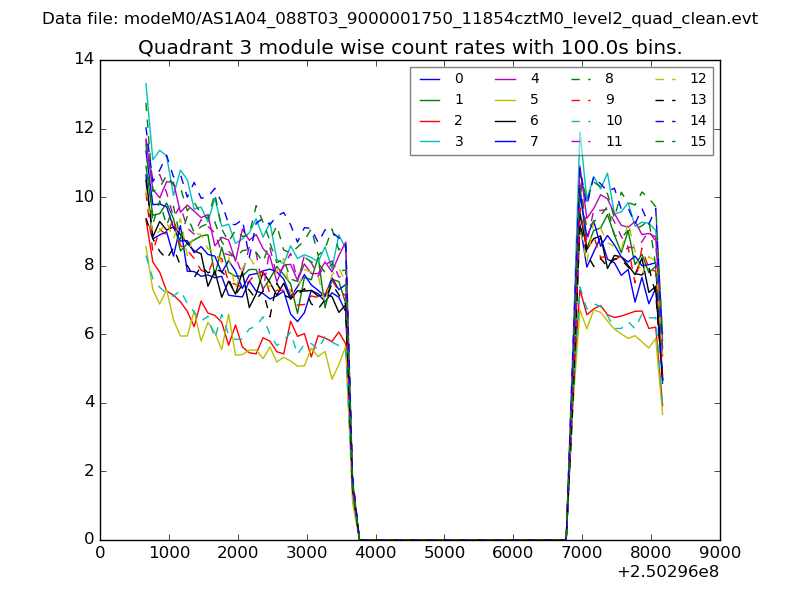 |
 |
| Parameter | Plot |
|---|---|
| CZT HV Monitor | 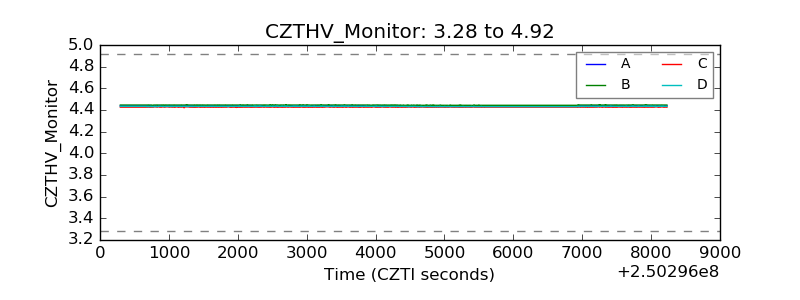 |
| D_VDD | 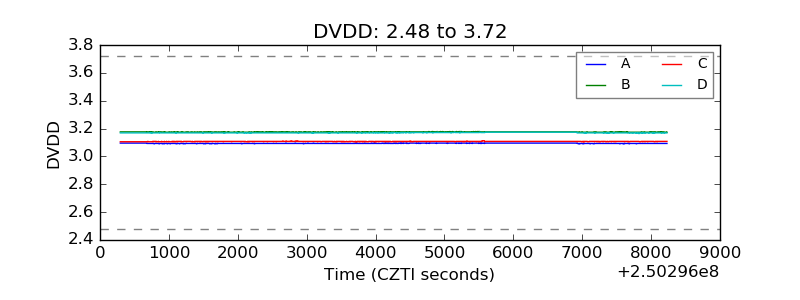 |
| Temperature 1 | 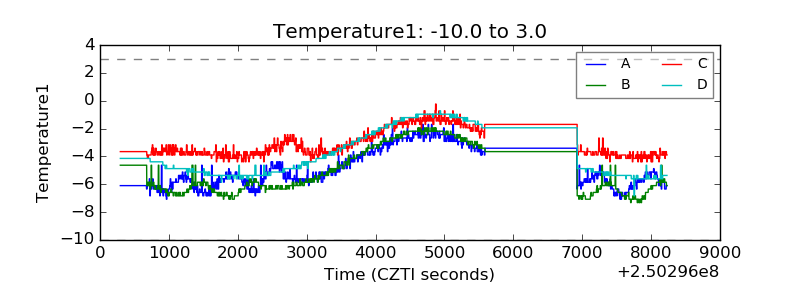 |
| Veto HV Monitor | 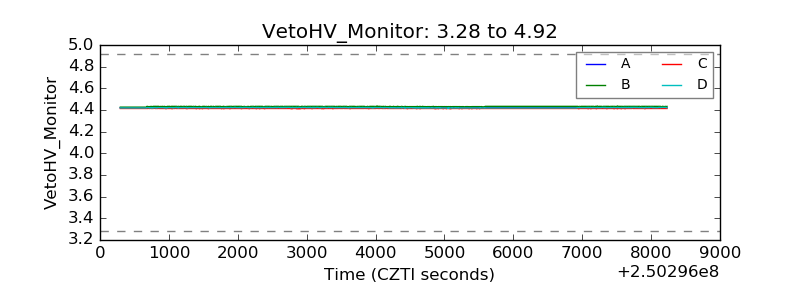 |
| Veto LLD | 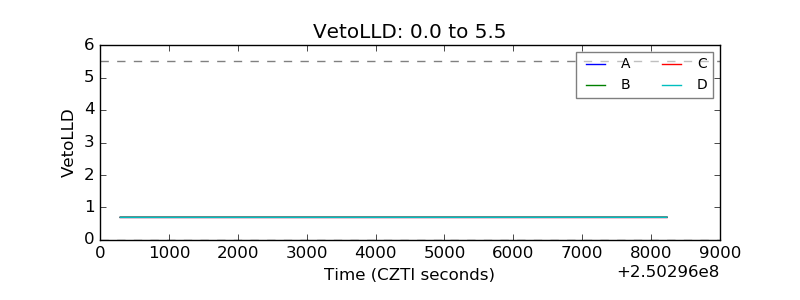 |
| Alpha Counter | 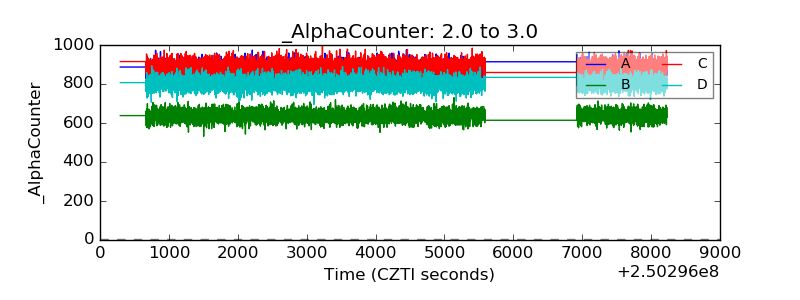 |
| _CPM_Rate | 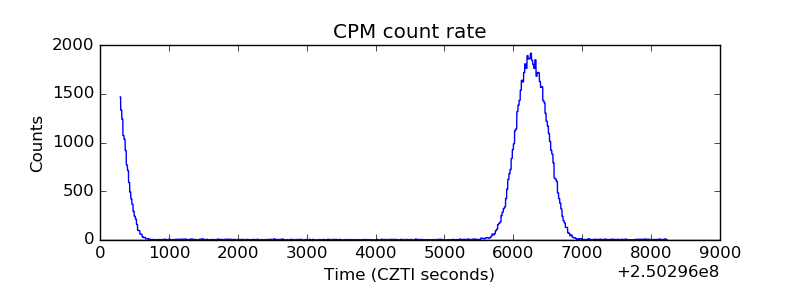 |
| CZT Counter | 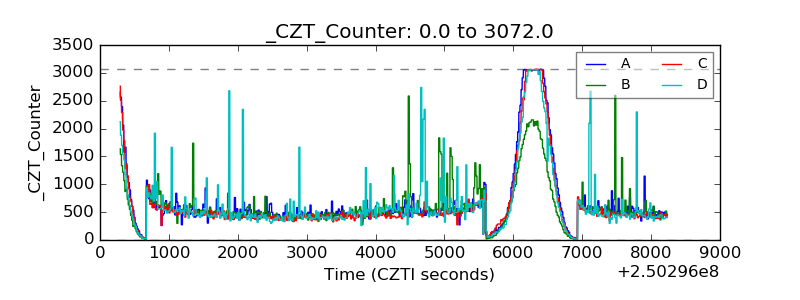 |
| +2.5 Volts monitor |  |
| +5 Volts monitor |  |
| _ROLL_ROT | 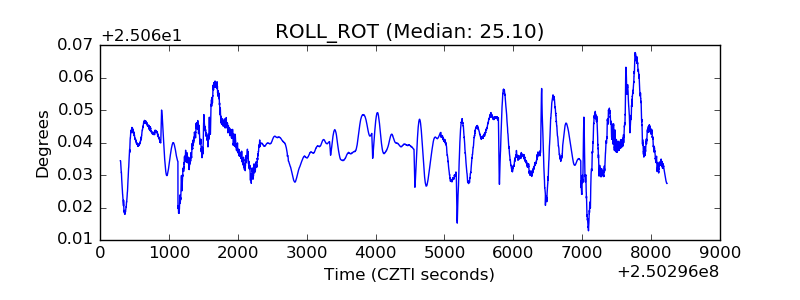 |
| _Roll_DEC | 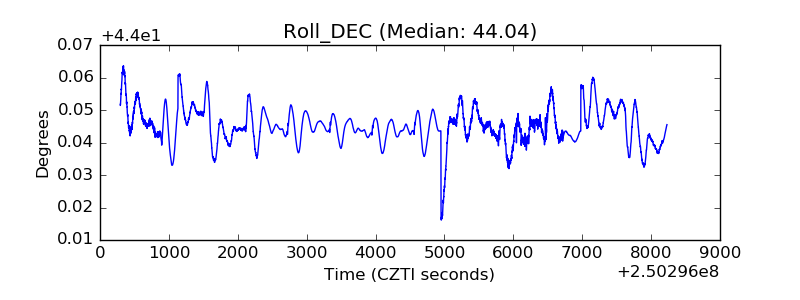 |
| _Roll_RA | 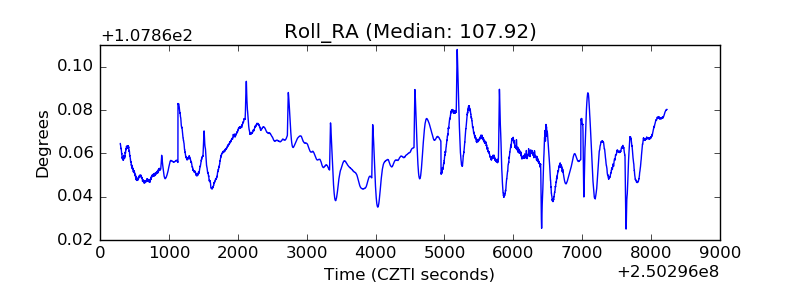 |
| Veto Counter | 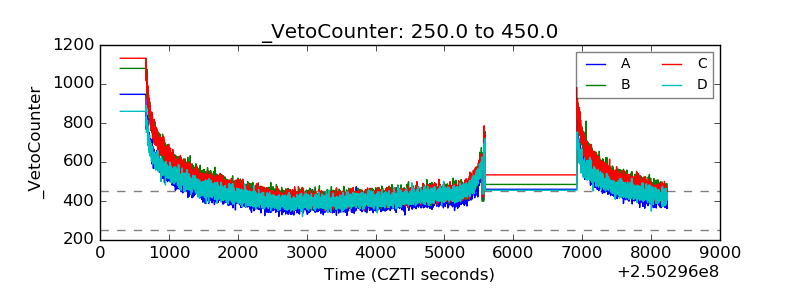 |