| Param | Original file | Final file |
|---|---|---|
| Filename | modeM0/AS1A04_088T03_9000001750_11855cztM0_level2.evt | modeM0/AS1A04_088T03_9000001750_11855cztM0_level2_quad_clean.evt |
| Size (bytes) | 477,069,120 | 93,767,040 |
| Size | 455.0 MB | 89.4 MB |
| Events in quadrant A | 3,329,047 | 610,301 |
| Events in quadrant B | 4,101,928 | 613,074 |
| Events in quadrant C | 2,999,552 | 597,880 |
| Events in quadrant D | 3,574,007 | 563,125 |
| Mode SS | |||
|---|---|---|---|
| Quadrant | BADHDUFLAG | Total packets | Discarded packets |
| A | 0 | 134 | 0 |
| B | 0 | 134 | 0 |
| C | 0 | 134 | 0 |
| D | 0 | 134 | 0 |
| Mode M0 | |||
|---|---|---|---|
| Quadrant | BADHDUFLAG | Total packets | Discarded packets |
| A | 0 | 14062 | 3 |
| B | 0 | 16500 | 2 |
| C | 0 | 13507 | 2 |
| D | 0 | 15278 | 4 |
| Mode M9 | |||
|---|---|---|---|
| Quadrant | BADHDUFLAG | Total packets | Discarded packets |
| A | 0 | 26 | 0 |
| B | 0 | 26 | 0 |
| C | 0 | 26 | 0 |
| D | 0 | 26 | 0 |
| Quadrant | Total seconds | Saturated seconds | Saturation percentage |
|---|---|---|---|
| A | 6529 | 80 | 1.225302% |
| B | 6529 | 353 | 5.406647% |
| C | 6529 | 41 | 0.627968% |
| D | 6528 | 193 | 2.956495% |
Noise dominated data is calculated using 1-second bins in cleaned event files. If a bin has >2000 counts, and if more than 50% of those come from <1% of pixels, then it is considered to be noise-dominated and hence unusable.
| Quadrant | # 1 sec bins | Bins with >0 counts | Bins with >2000 counts | High rate bins dominated by noise | Noise dominated (total time) | Noise dominated (detector-on time) | Marked lightcurve |
|---|---|---|---|---|---|---|---|
| A | 9150 | 6533 | 1 | 1 | 0.01% | 0.02% | 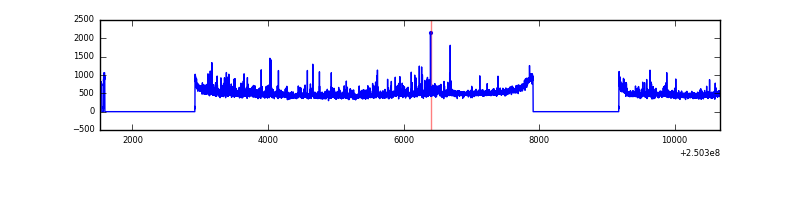 |
| B | 9150 | 6533 | 152 | 152 | 1.66% | 2.33% | 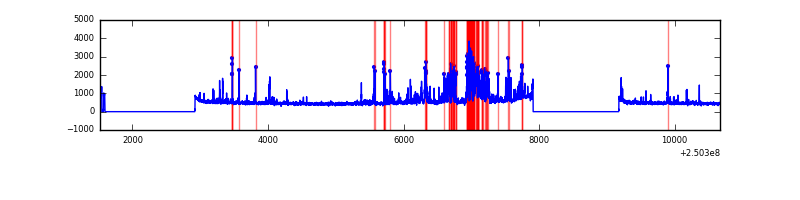 |
| C | 9150 | 6533 | 0 | 0 | 0.00% | 0.00% | 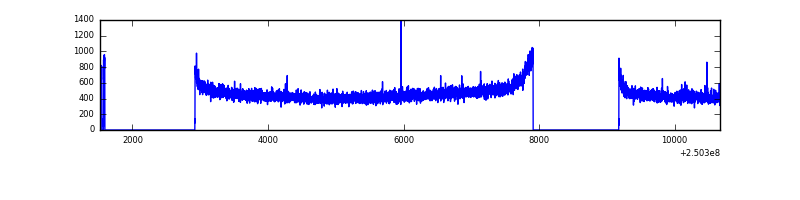 |
| D | 9150 | 6533 | 95 | 95 | 1.04% | 1.45% | 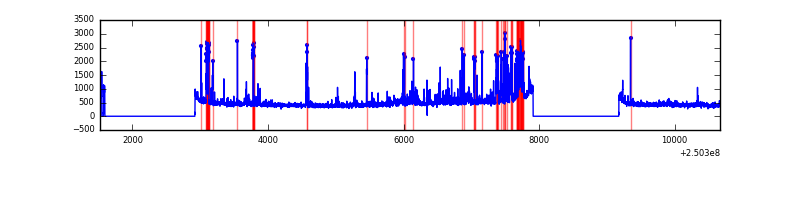 |
Top three noisy pixels from each quadrant. If the there are fewer than three noisy pixels in the level2.evt file, extra rows are filled as -1
| Pixel properties | Quadrant properties | ||||||
|---|---|---|---|---|---|---|---|
| Quadrant | DetID | PixID | Counts | Sigma | Mean | Median | Sigma |
| A | 1 | 162 | 91841 | 561.76 | 801 | 786 | 162.1 |
| A | 1 | 178 | 48197 | 292.5 | 801 | 786 | 162.1 |
| A | 1 | 161 | 42421 | 256.87 | 801 | 786 | 162.1 |
| B | 4 | 239 | 850562 | 5657.71 | 788 | 769 | 150.2 |
| B | 15 | 204 | 53597 | 351.72 | 788 | 769 | 150.2 |
| B | 11 | 51 | 26067 | 168.43 | 788 | 769 | 150.2 |
| C | 13 | 61 | 5590 | 27.12 | 769 | 773 | 177.6 |
| C | 12 | 4 | 2722 | 10.97 | 769 | 773 | 177.6 |
| C | 3 | 202 | 1881 | 6.24 | 769 | 773 | 177.6 |
| D | 9 | 85 | 275727 | 1543.41 | 752 | 730 | 178.2 |
| D | 1 | 52 | 256868 | 1437.57 | 752 | 730 | 178.2 |
| D | 13 | 104 | 91843 | 511.37 | 752 | 730 | 178.2 |
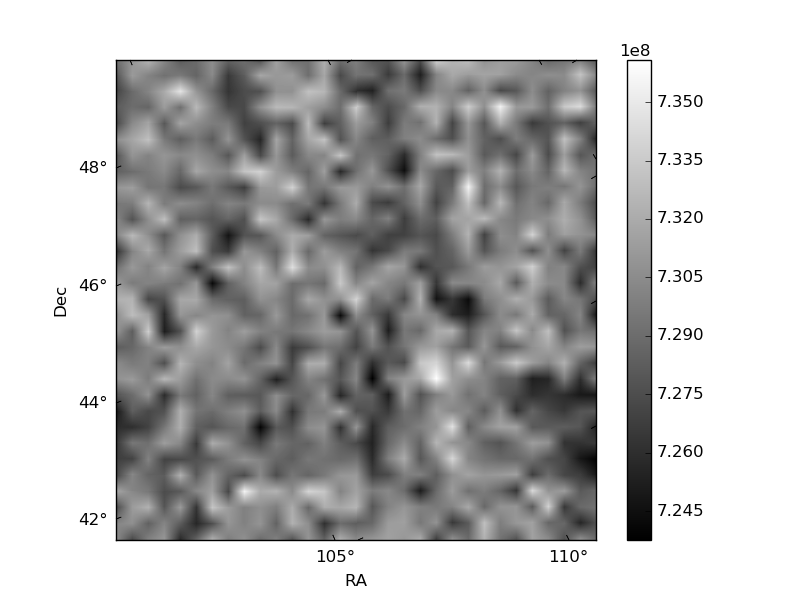
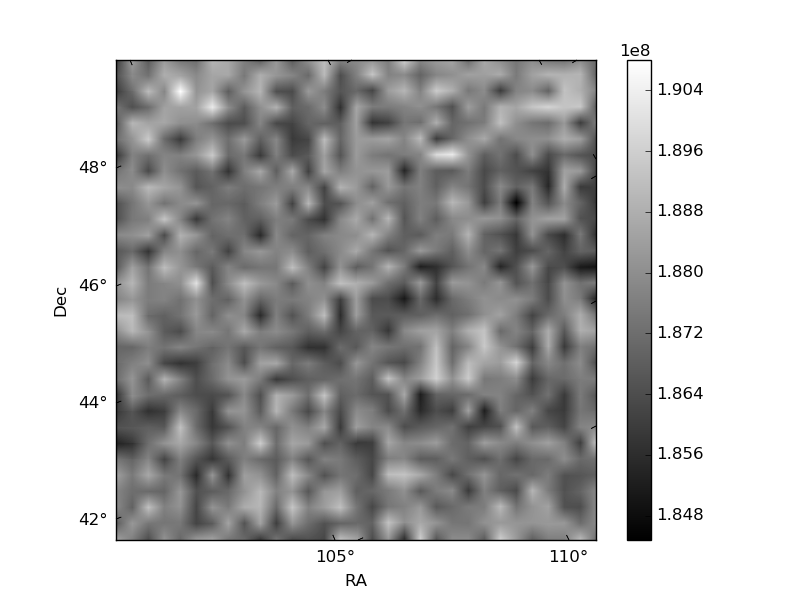
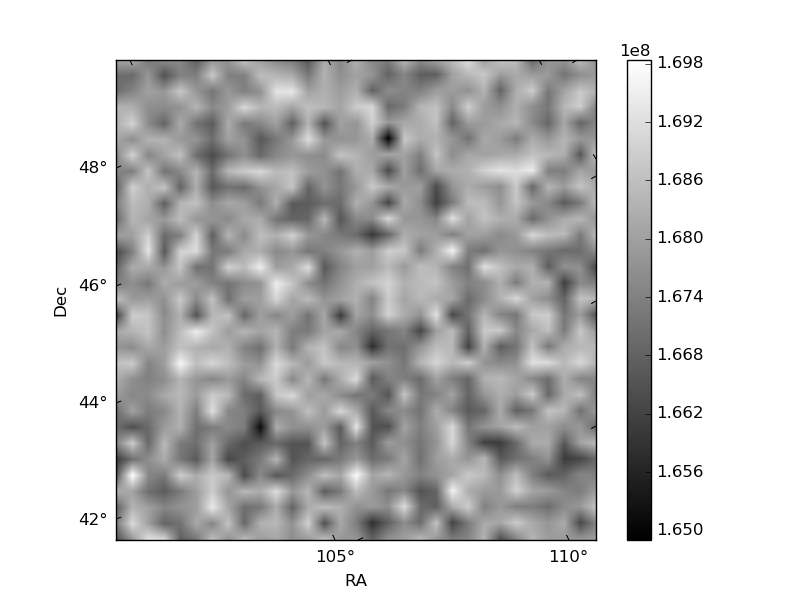
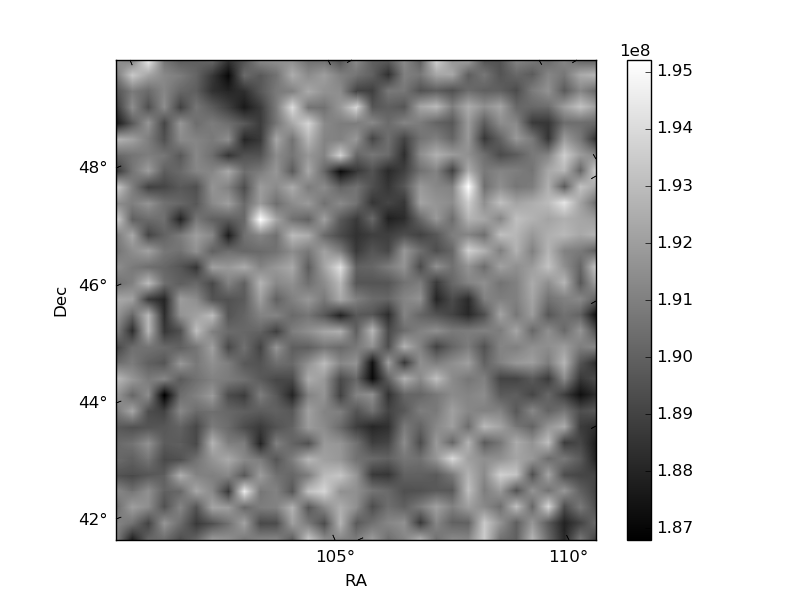
Histogram calculated using DETX and DETY for each event in the final _common_clean file
| Quadrant A | 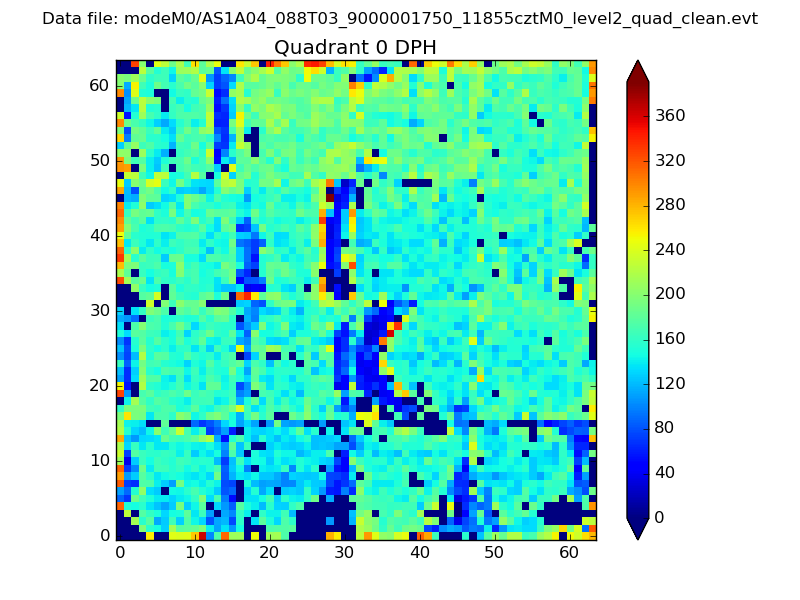 |
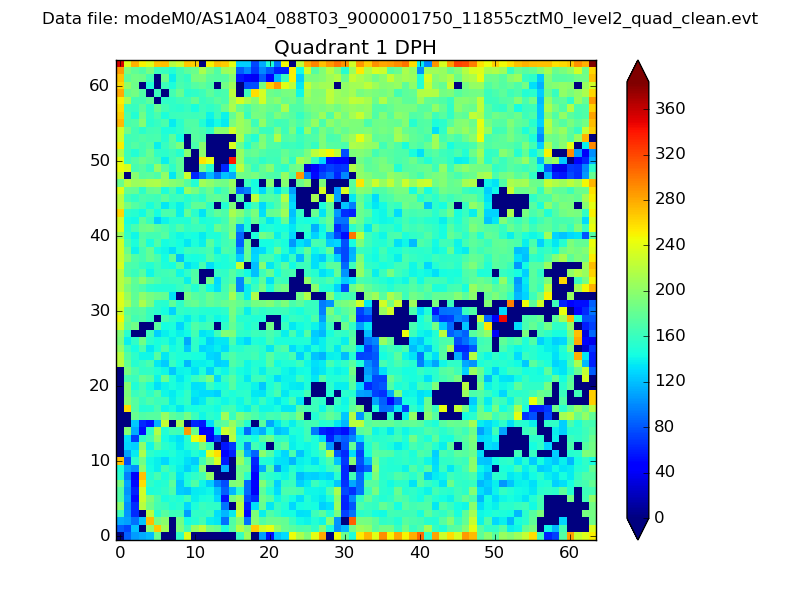 |
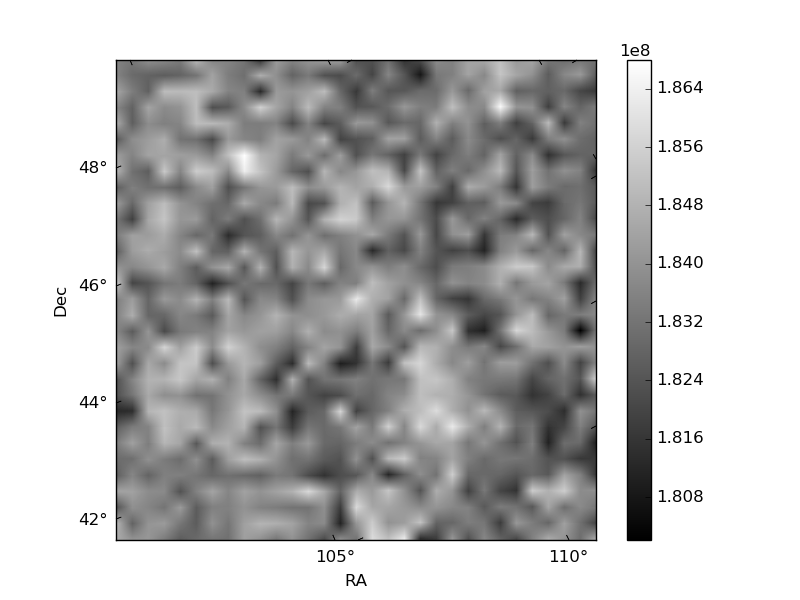
Quadrant B |
|---|---|---|---|
| Quadrant D | 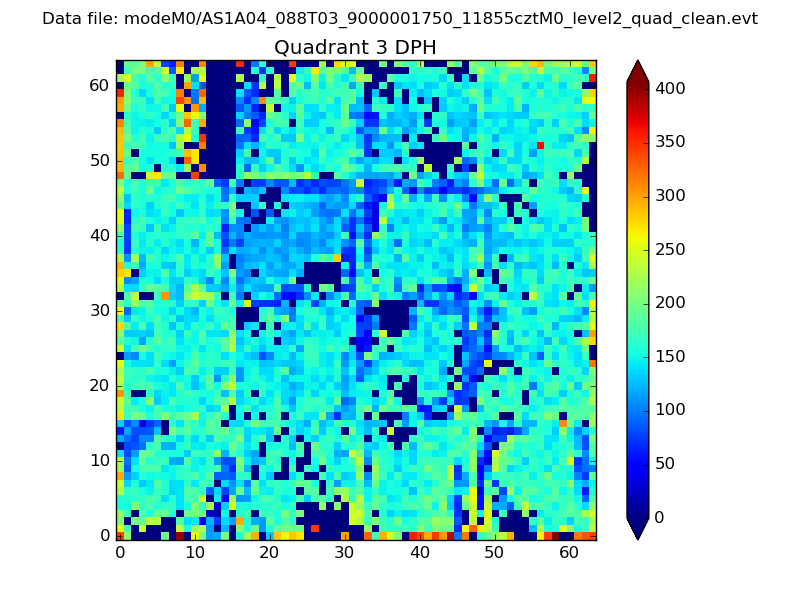 |
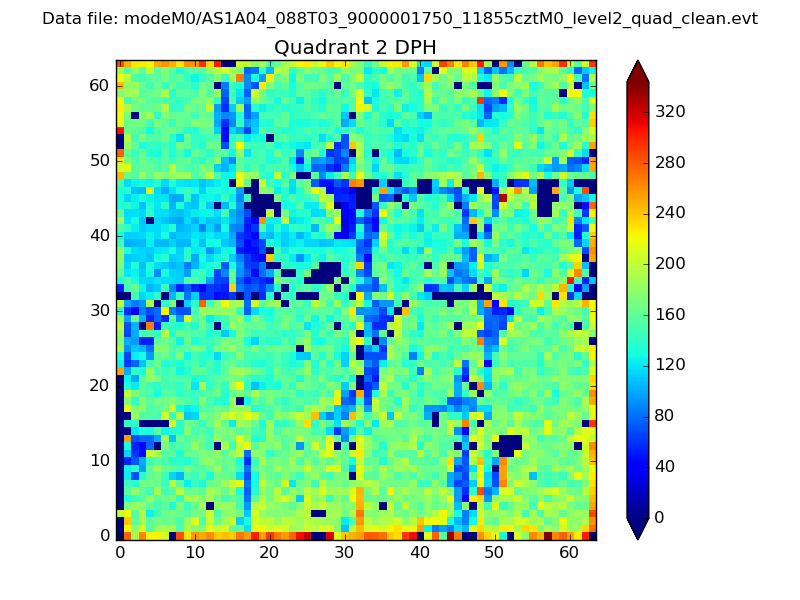 |
Quadrant C |
| Plot type | Count rate plots | Images |
|---|---|---|
| Comparison with Poisson distribution Blue bars denote a histogram of data divided into 1 sec bins. Red curve is a Poisson curve with rate = median count rate of data. |
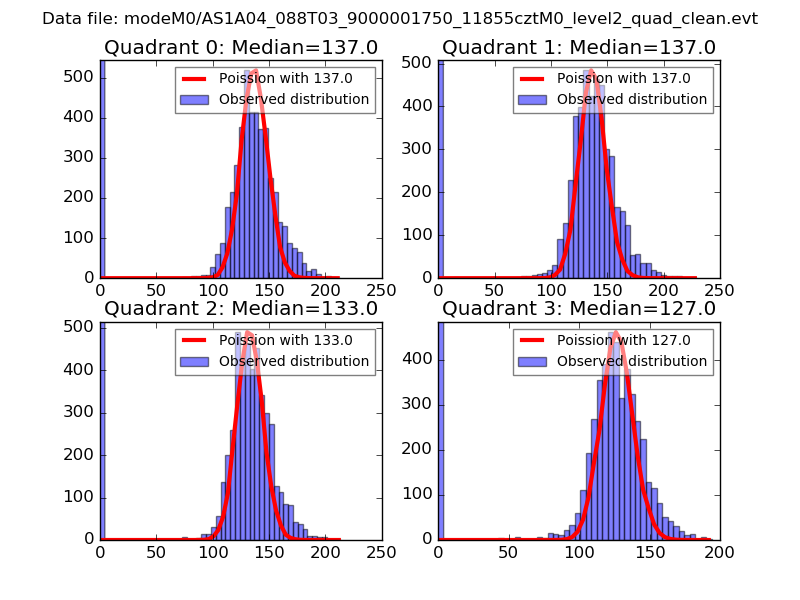 |
 |
| Quadrant-wise count rates Data is divided into 100 sec bins |
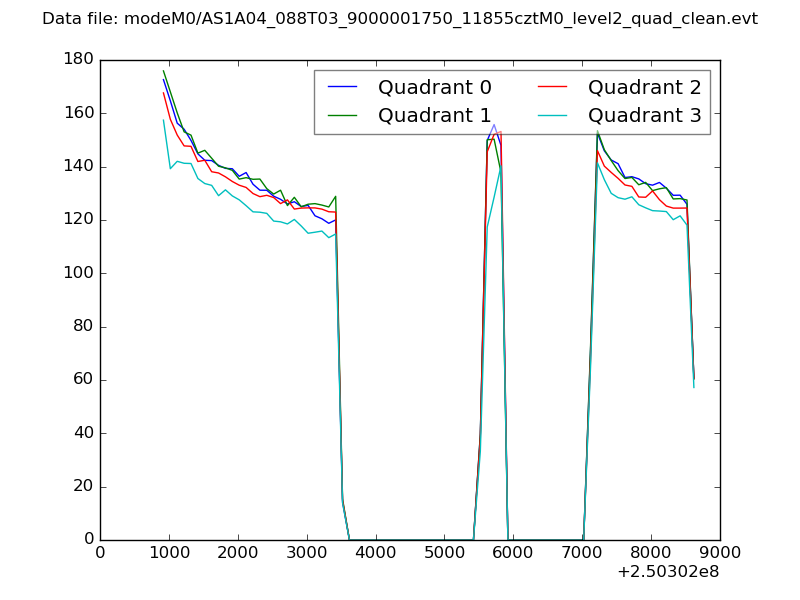 |
|
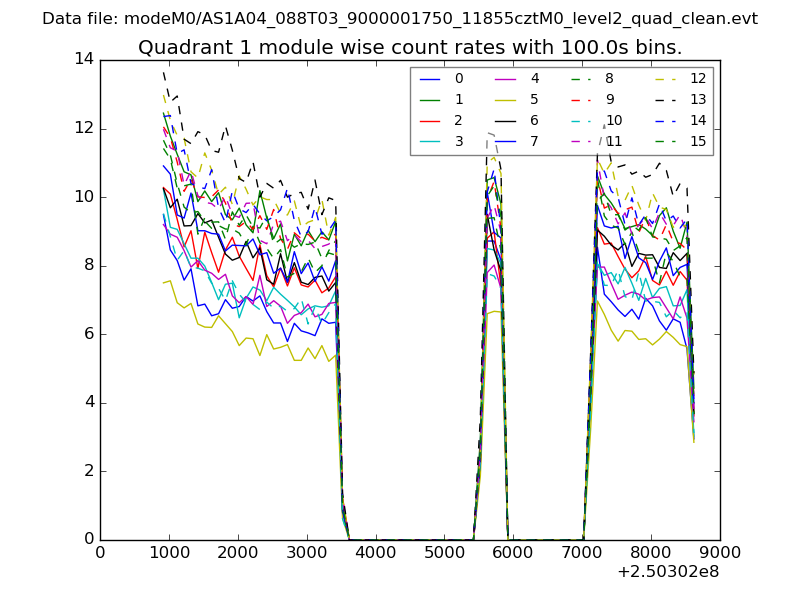
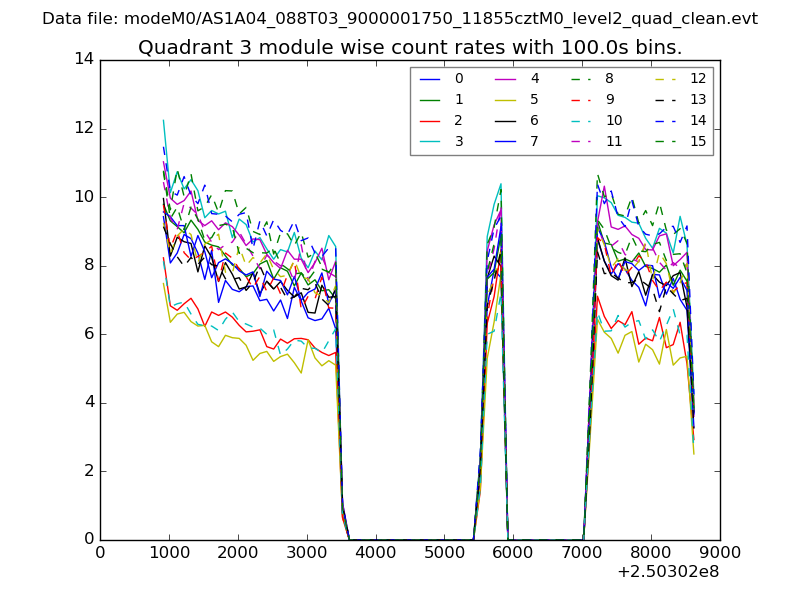
| Module-wise count rates for Quadrant A Data is divided into 100 sec bins |
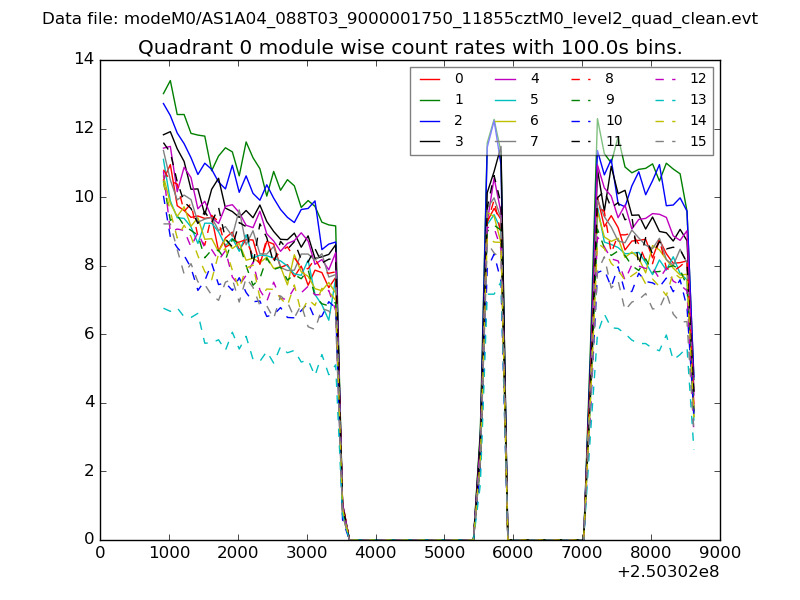 |
 |
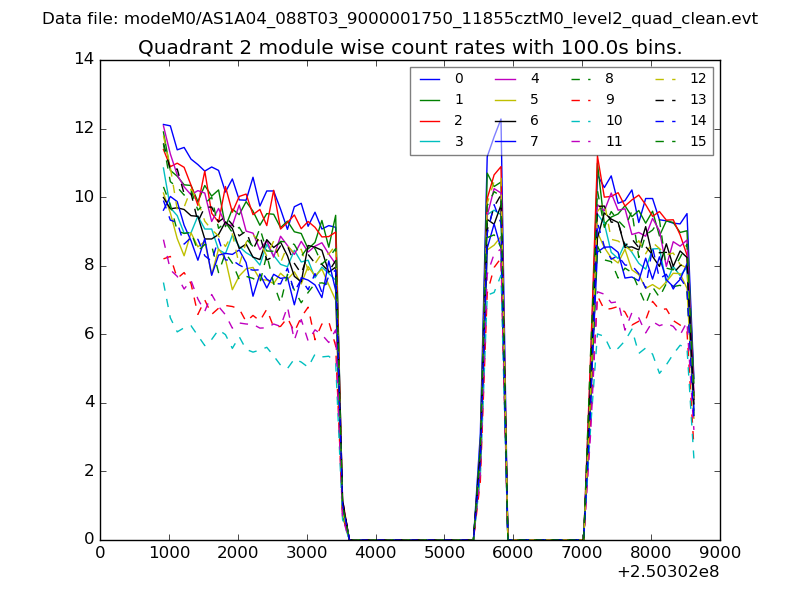
| Module-wise count rates for Quadrant B Data is divided into 100 sec bins |
 |
 |
| Module-wise count rates for Quadrant C Data is divided into 100 sec bins |
 |
 |
| Module-wise count rates for Quadrant D Data is divided into 100 sec bins |
 |
 |
| Parameter | Plot |
|---|---|
| CZT HV Monitor | 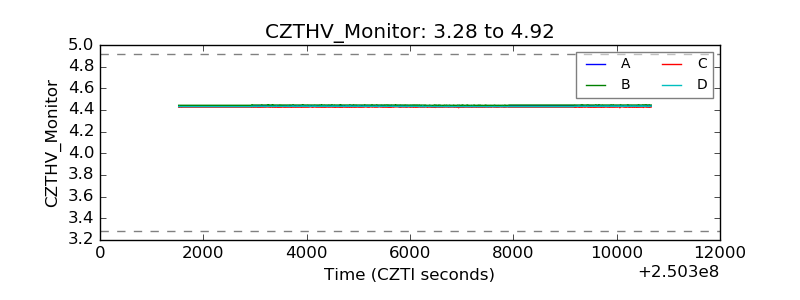 |
| D_VDD | 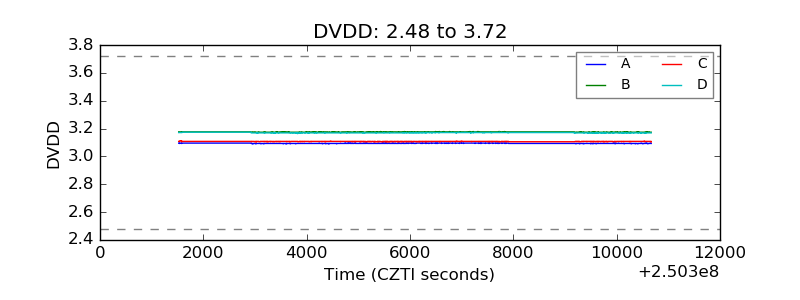 |
| Temperature 1 |  |
| Veto HV Monitor | 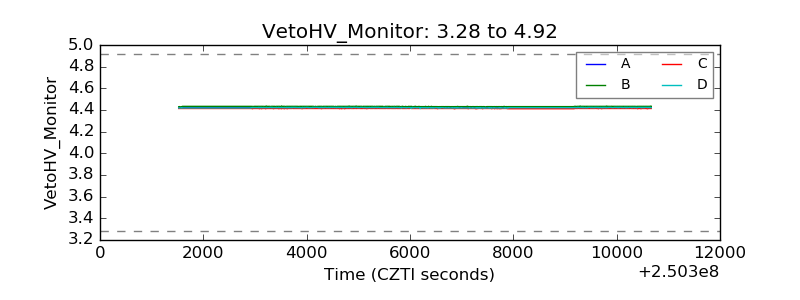 |
| Veto LLD |  |
| Alpha Counter | 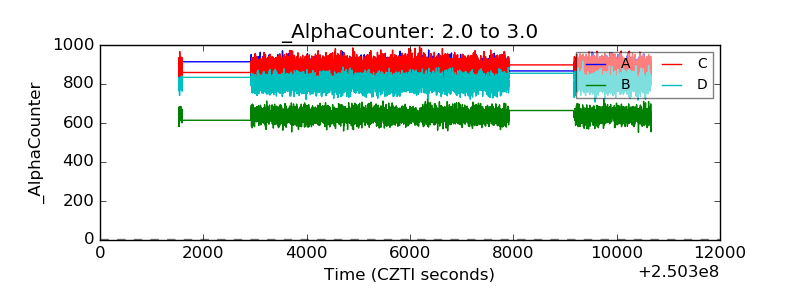 |
| _CPM_Rate | 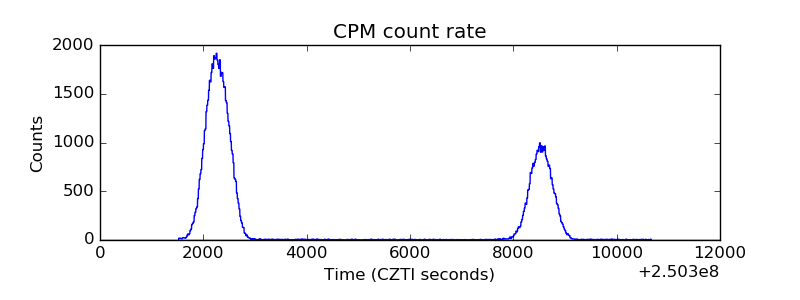 |
| CZT Counter | 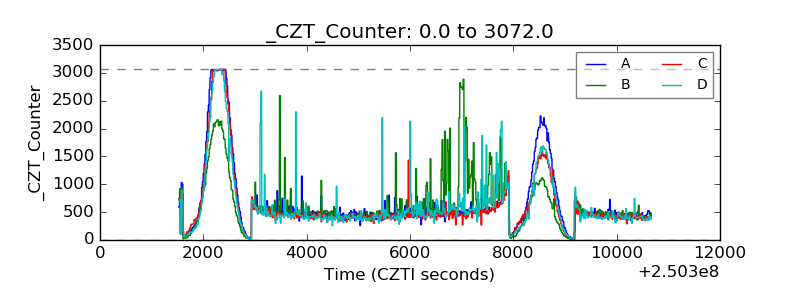 |
| +2.5 Volts monitor |  |
| +5 Volts monitor |  |
| _ROLL_ROT | 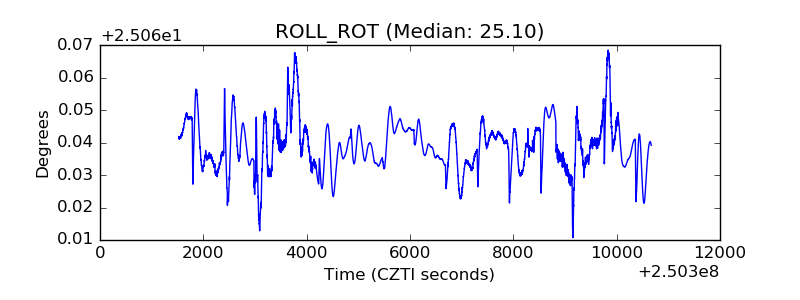 |
| _Roll_DEC | 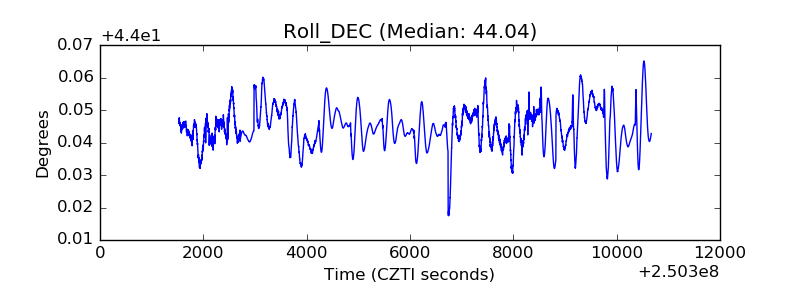 |
| _Roll_RA | 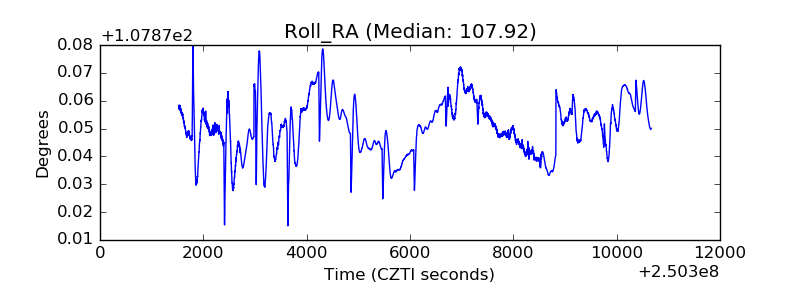 |
| Veto Counter | 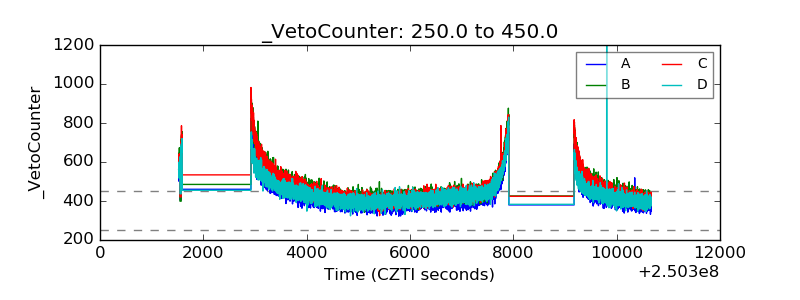 |