| Param | Original file | Final file |
|---|---|---|
| Filename | modeM0/AS1A04_088T03_9000001750_11858cztM0_level2.evt | modeM0/AS1A04_088T03_9000001750_11858cztM0_level2_quad_clean.evt |
| Size (bytes) | 494,596,800 | 88,824,960 |
| Size | 471.7 MB | 84.7 MB |
| Events in quadrant A | 3,508,080 | 561,945 |
| Events in quadrant B | 4,120,575 | 553,361 |
| Events in quadrant C | 3,120,498 | 556,007 |
| Events in quadrant D | 3,753,420 | 529,988 |
| Mode SS | |||
|---|---|---|---|
| Quadrant | BADHDUFLAG | Total packets | Discarded packets |
| A | 0 | 142 | 0 |
| B | 0 | 142 | 0 |
| C | 0 | 142 | 0 |
| D | 0 | 142 | 0 |
| Mode M0 | |||
|---|---|---|---|
| Quadrant | BADHDUFLAG | Total packets | Discarded packets |
| A | 0 | 14915 | 2 |
| B | 0 | 16751 | 1 |
| C | 0 | 14364 | 1 |
| D | 0 | 16131 | 1 |
| Mode M9 | |||
|---|---|---|---|
| Quadrant | BADHDUFLAG | Total packets | Discarded packets |
| A | 0 | 2 | 0 |
| B | 0 | 2 | 0 |
| C | 0 | 2 | 0 |
| D | 0 | 2 | 0 |
| Quadrant | Total seconds | Saturated seconds | Saturation percentage |
|---|---|---|---|
| A | 7010 | 214 | 3.052782% |
| B | 7010 | 386 | 5.506419% |
| C | 7010 | 139 | 1.982882% |
| D | 7010 | 275 | 3.922967% |
Noise dominated data is calculated using 1-second bins in cleaned event files. If a bin has >2000 counts, and if more than 50% of those come from <1% of pixels, then it is considered to be noise-dominated and hence unusable.
| Quadrant | # 1 sec bins | Bins with >0 counts | Bins with >2000 counts | High rate bins dominated by noise | Noise dominated (total time) | Noise dominated (detector-on time) | Marked lightcurve |
|---|---|---|---|---|---|---|---|
| A | 7181 | 7012 | 3 | 3 | 0.04% | 0.04% | 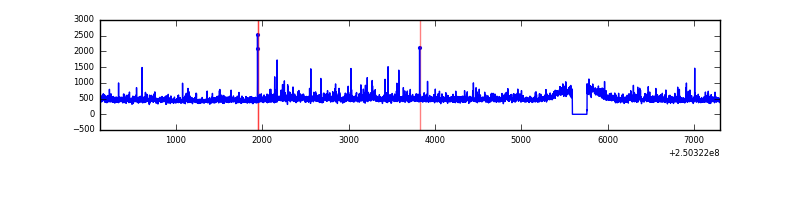 |
| B | 7181 | 7012 | 127 | 127 | 1.77% | 1.81% |  |
| C | 7181 | 7012 | 1 | 1 | 0.01% | 0.01% | 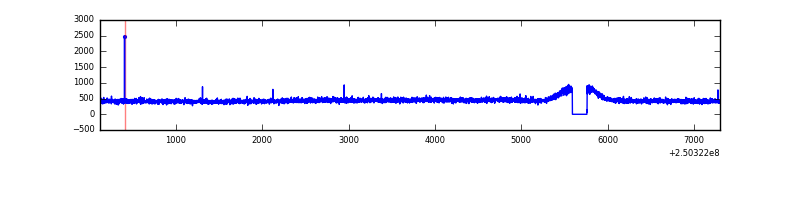 |
| D | 7181 | 7012 | 100 | 100 | 1.39% | 1.43% |  |
Top three noisy pixels from each quadrant. If the there are fewer than three noisy pixels in the level2.evt file, extra rows are filled as -1
| Pixel properties | Quadrant properties | ||||||
|---|---|---|---|---|---|---|---|
| Quadrant | DetID | PixID | Counts | Sigma | Mean | Median | Sigma |
| A | 1 | 162 | 107142 | 631.52 | 822 | 805 | 168.4 |
| A | 8 | 15 | 69244 | 406.45 | 822 | 805 | 168.4 |
| A | 1 | 178 | 53453 | 312.67 | 822 | 805 | 168.4 |
| B | 4 | 239 | 704722 | 4473.52 | 811 | 789 | 157.4 |
| B | 15 | 204 | 85235 | 536.66 | 811 | 789 | 157.4 |
| B | 4 | 173 | 47806 | 298.8 | 811 | 789 | 157.4 |
| C | 8 | 128 | 8234 | 40.3 | 795 | 796 | 184.6 |
| C | 13 | 61 | 5817 | 27.2 | 795 | 796 | 184.6 |
| C | 8 | 112 | 4279 | 18.87 | 795 | 796 | 184.6 |
| D | 1 | 52 | 536290 | 2832.68 | 788 | 764 | 189.1 |
| D | 13 | 104 | 130660 | 687.09 | 788 | 764 | 189.1 |
| D | 13 | 249 | 45486 | 236.56 | 788 | 764 | 189.1 |
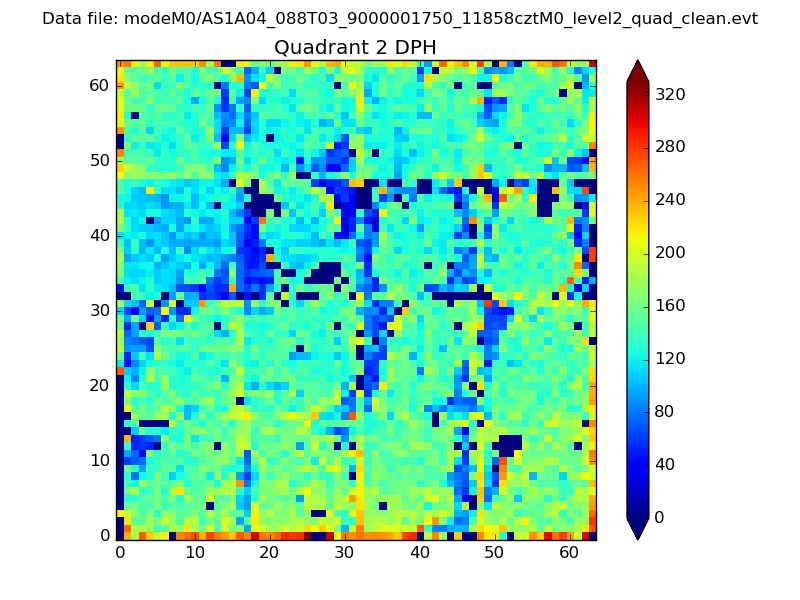
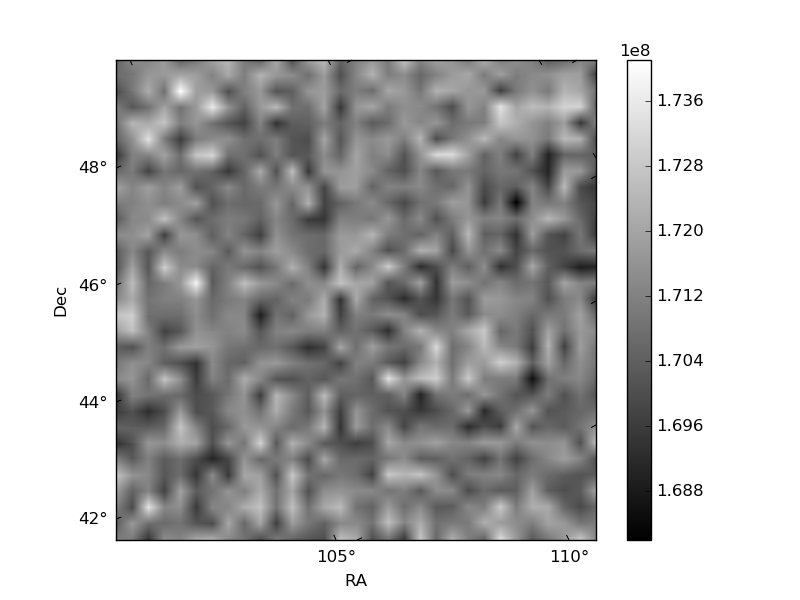
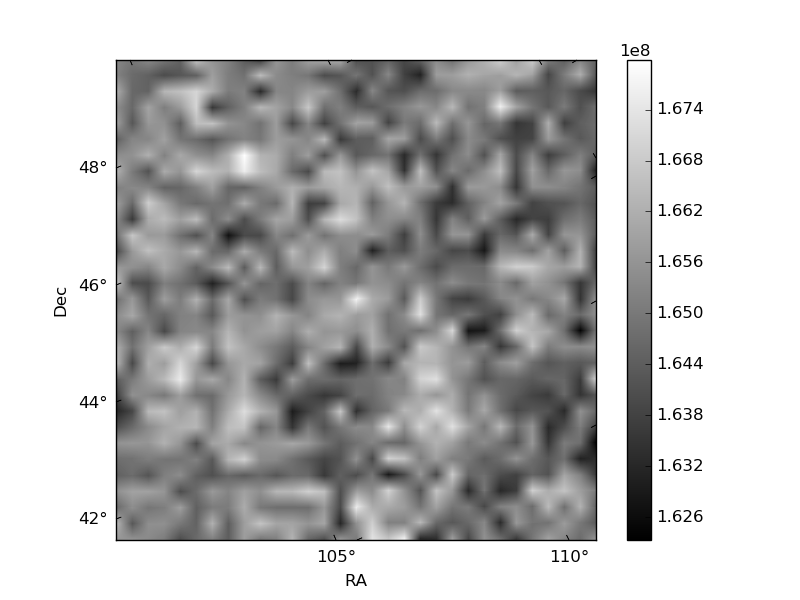
Histogram calculated using DETX and DETY for each event in the final _common_clean file
| Quadrant A | 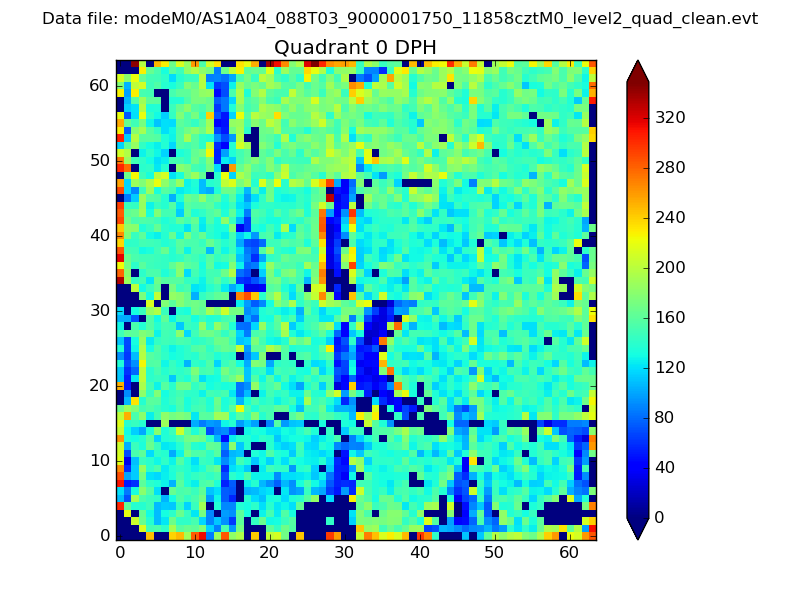 |
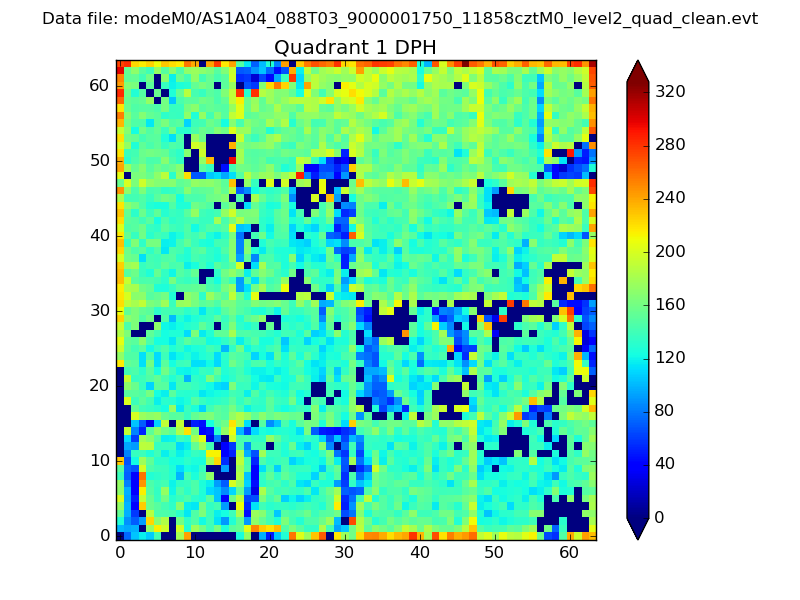 |
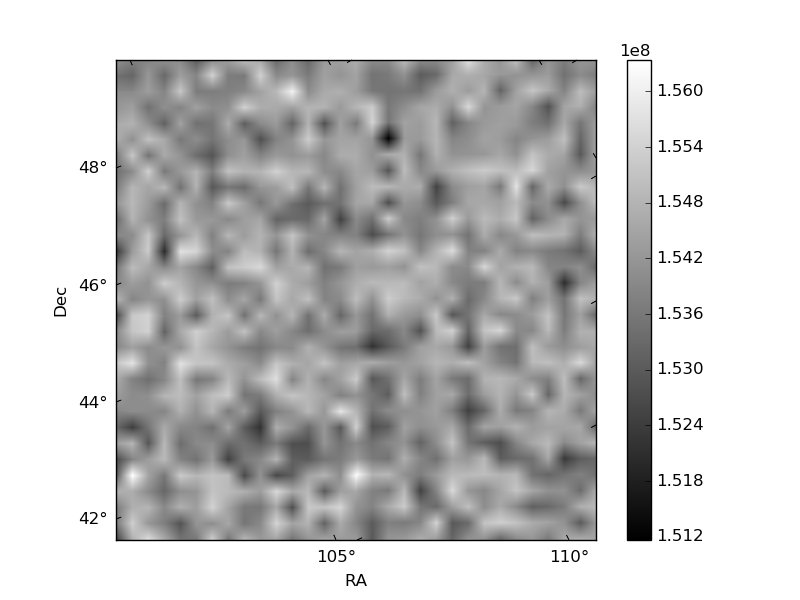
Quadrant B |
|---|---|---|---|
| Quadrant D |  |
 |
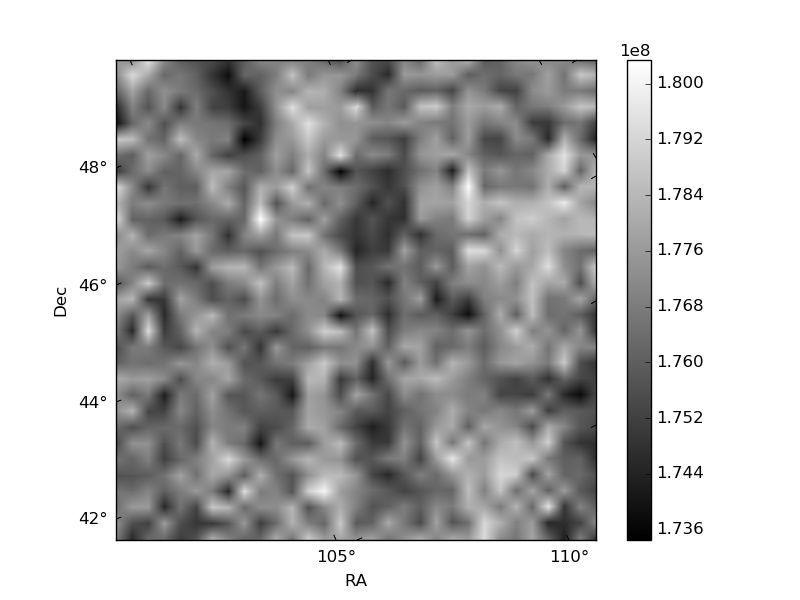
Quadrant C |
| Plot type | Count rate plots | Images |
|---|---|---|
| Comparison with Poisson distribution Blue bars denote a histogram of data divided into 1 sec bins. Red curve is a Poisson curve with rate = median count rate of data. |
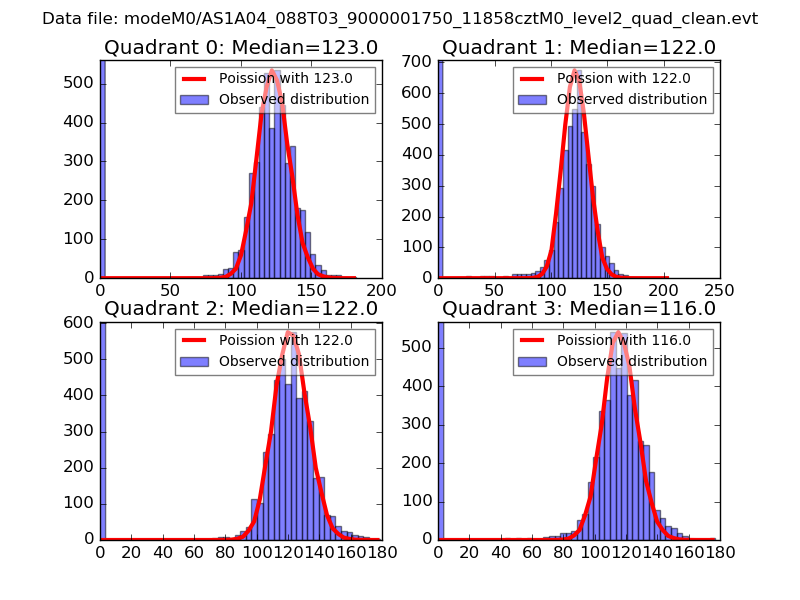 |
 |
| Quadrant-wise count rates Data is divided into 100 sec bins |
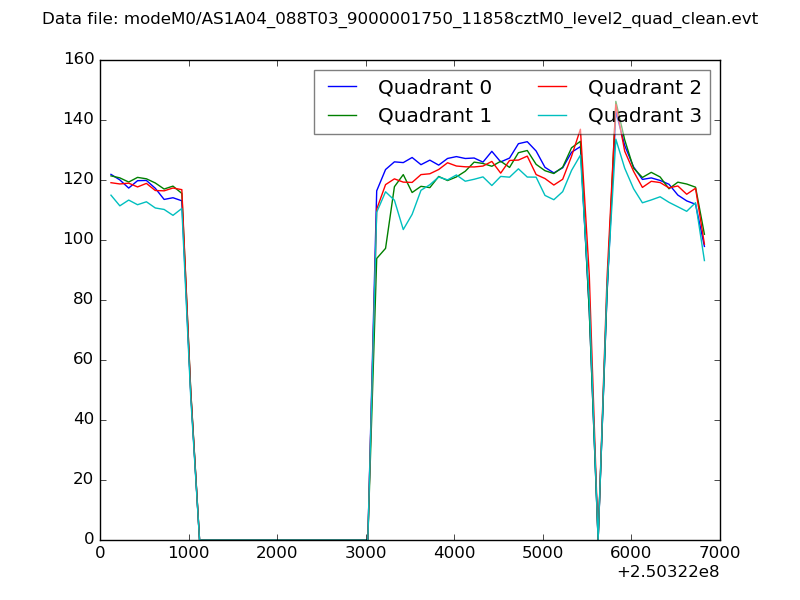 |
|
| Module-wise count rates for Quadrant A Data is divided into 100 sec bins |
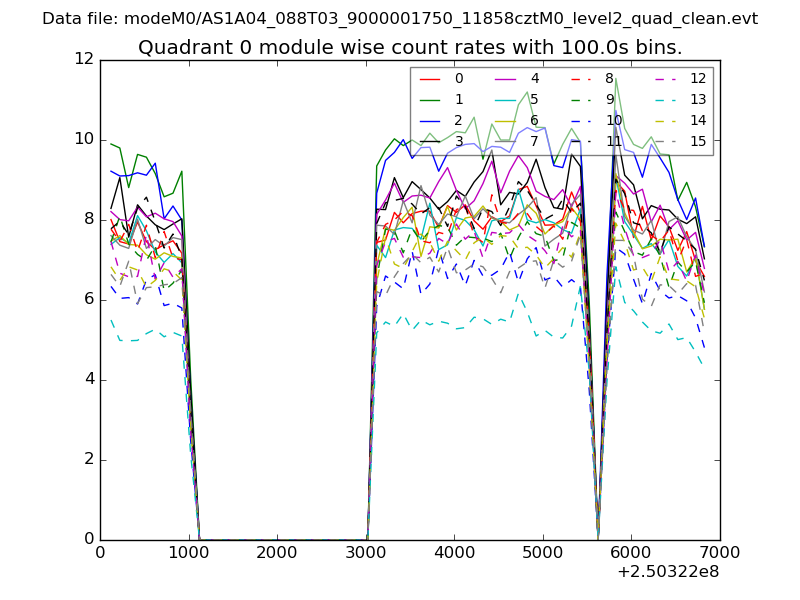 |
 |
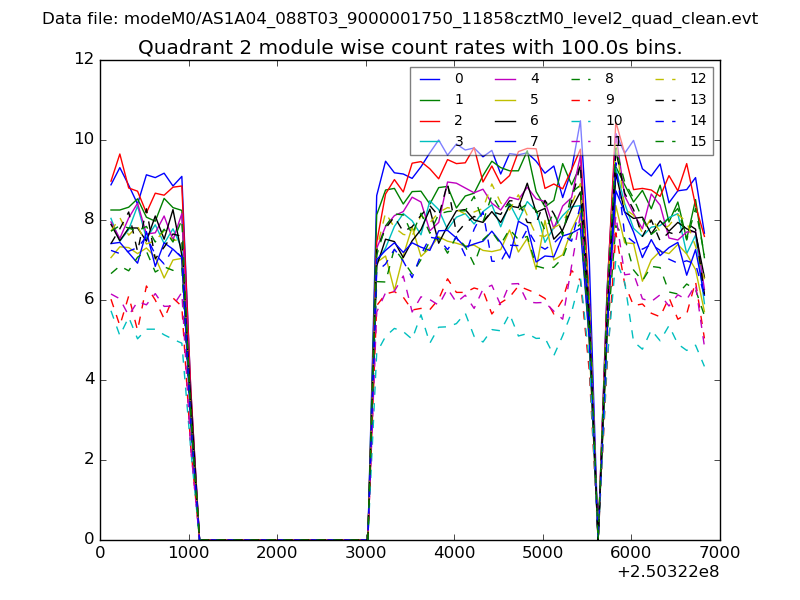
| Module-wise count rates for Quadrant B Data is divided into 100 sec bins |
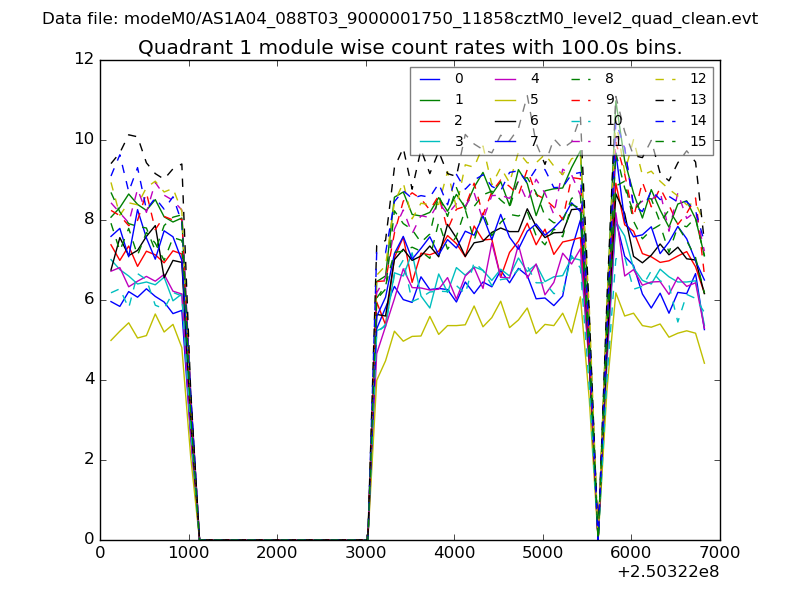 |
 |
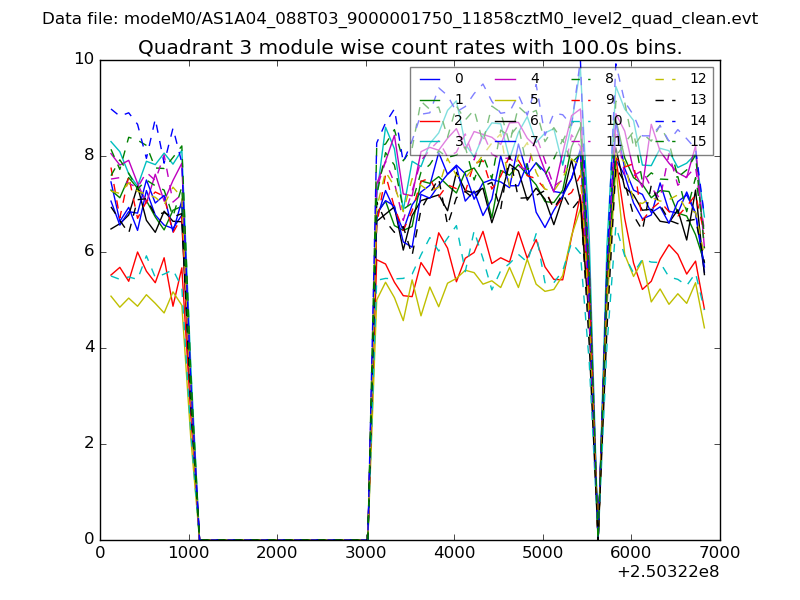
| Module-wise count rates for Quadrant C Data is divided into 100 sec bins |
 |
 |
| Module-wise count rates for Quadrant D Data is divided into 100 sec bins |
 |
 |
| Parameter | Plot |
|---|---|
| CZT HV Monitor | 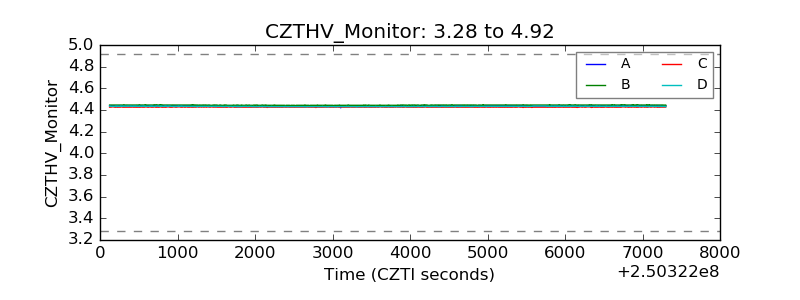 |
| D_VDD |  |
| Temperature 1 |  |
| Veto HV Monitor | 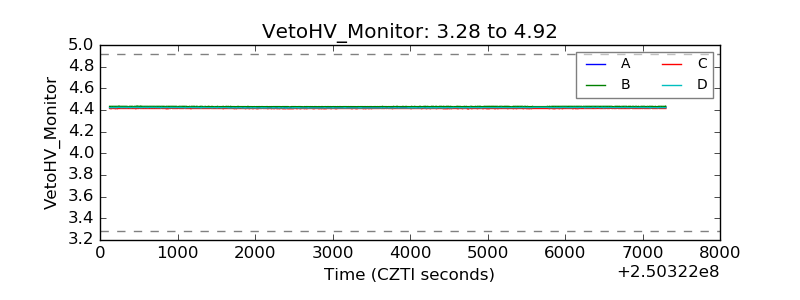 |
| Veto LLD | 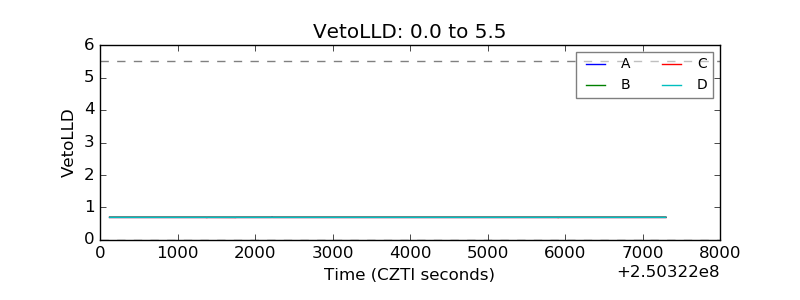 |
| Alpha Counter | 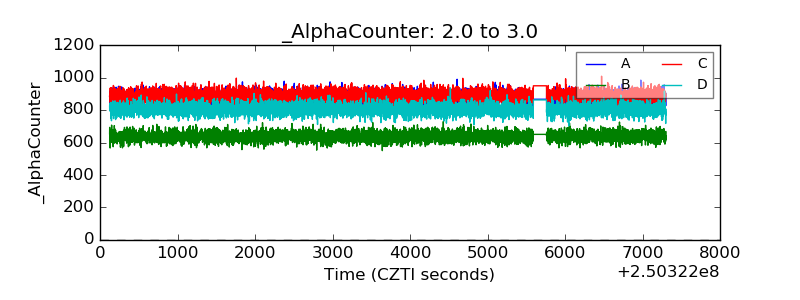 |
| _CPM_Rate | 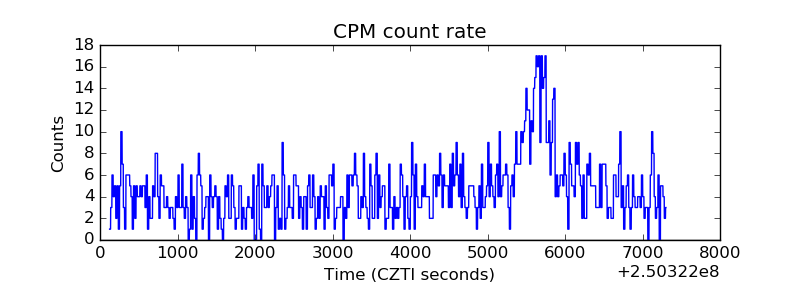 |
| CZT Counter | 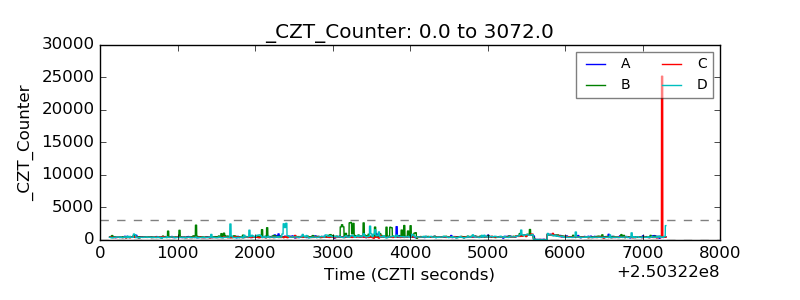 |
| +2.5 Volts monitor |  |
| +5 Volts monitor |  |
| _ROLL_ROT | 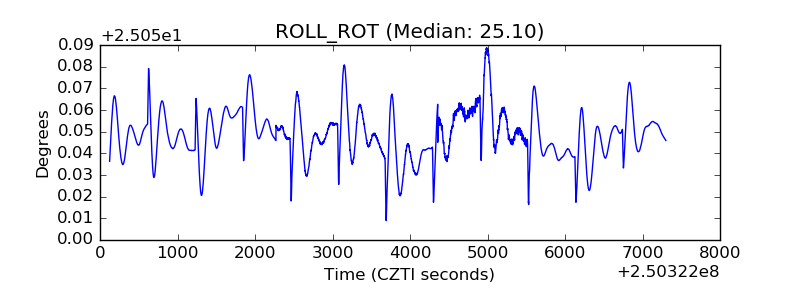 |
| _Roll_DEC | 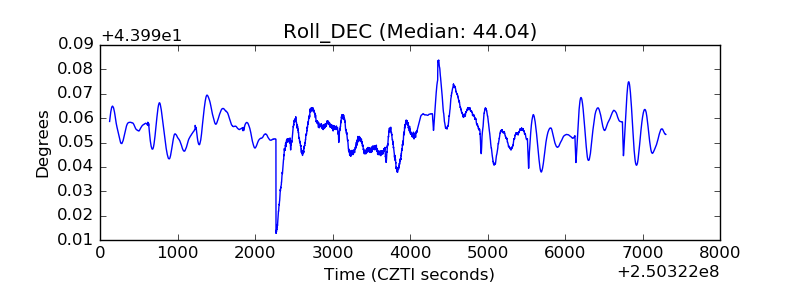 |
| _Roll_RA | 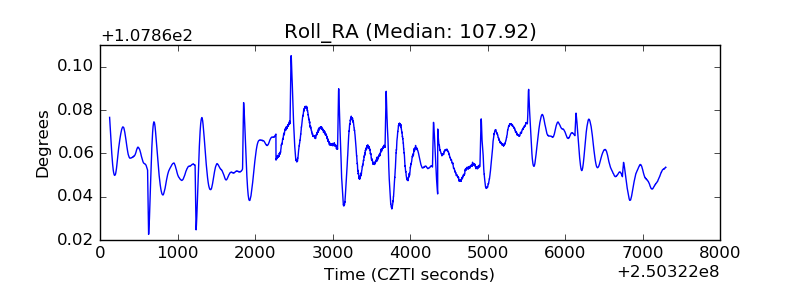 |
| Veto Counter | 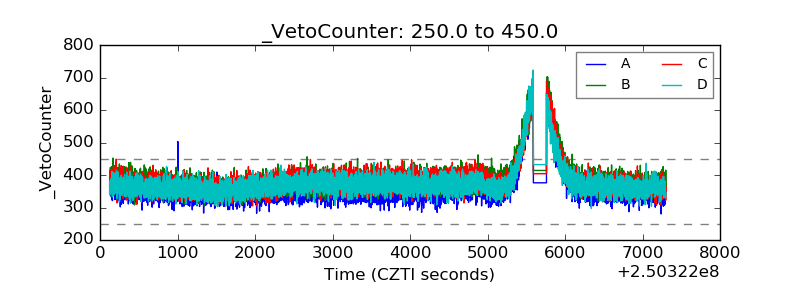 |