| Param | Original file | Final file |
|---|---|---|
| Filename | modeM0/AS1A04_049T01_9000001754cztM0_level2.fits | modeM0/AS1A04_049T01_9000001754cztM0_level2_quad_clean.evt |
| Size (bytes) | 241,606,080 | 168,935,040 |
| Size | 230.4 MB | 161.1 MB |
| Events in quadrant A | 1,462,160 | 867,939 |
| Events in quadrant B | 1,399,968 | 861,311 |
| Events in quadrant C | 1,449,028 | 844,431 |
| Events in quadrant D | 1,227,936 | 763,338 |
| Mode M0 | |||
|---|---|---|---|
| Quadrant | BADHDUFLAG | Total packets | Discarded packets |
| A | 0 | 55240 | 0 |
| B | 0 | 64610 | 0 |
| C | 0 | 52876 | 0 |
| D | 0 | 62839 | 0 |
| Mode SS | |||
|---|---|---|---|
| Quadrant | BADHDUFLAG | Total packets | Discarded packets |
| A | 0 | 528 | 0 |
| B | 0 | 528 | 0 |
| C | 0 | 528 | 0 |
| D | 0 | 528 | 0 |
| Mode M9 | |||
|---|---|---|---|
| Quadrant | BADHDUFLAG | Total packets | Discarded packets |
| A | 0 | 53 | 0 |
| B | 0 | 53 | 0 |
| C | 0 | 53 | 0 |
| D | 0 | 53 | 0 |
| Quadrant | Total seconds | Saturated seconds | Saturation percentage |
|---|---|---|---|
| A | 25838 | 342 | 1.323632% |
| B | 25838 | 1176 | 4.551436% |
| C | 25838 | 171 | 0.661816% |
| D | 25838 | 933 | 3.610961% |
Noise dominated data is calculated using 1-second bins in cleaned event files. If a bin has >2000 counts, and if more than 50% of those come from <1% of pixels, then it is considered to be noise-dominated and hence unusable.
| Quadrant | # 1 sec bins | Bins with >0 counts | Bins with >2000 counts | High rate bins dominated by noise | Noise dominated (total time) | Noise dominated (detector-on time) | Marked lightcurve |
|---|---|---|---|---|---|---|---|
| A | 31153 | 25838 | 0 | 0 | 0.00% | 0.00% | 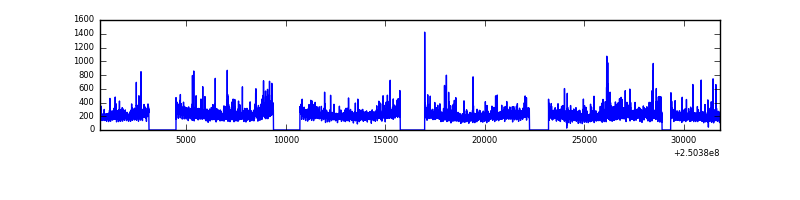 |
| B | 31153 | 25834 | 0 | 0 | 0.00% | 0.00% | 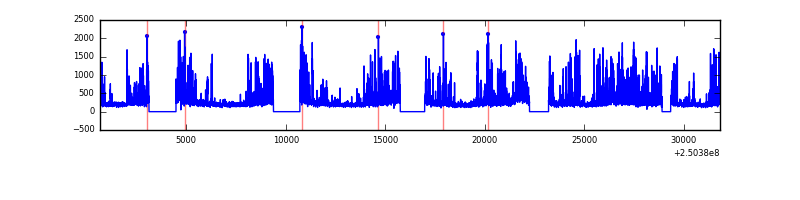 |
| C | 31152 | 25834 | 0 | 0 | 0.00% | 0.00% | 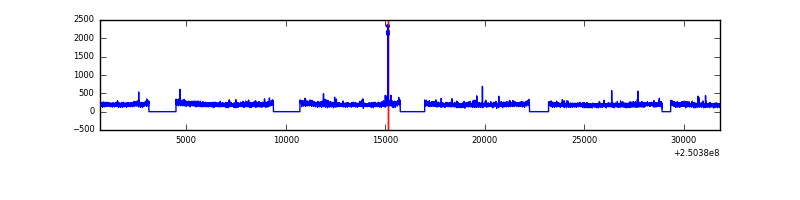 |
| D | 31153 | 25782 | 0 | 0 | 0.00% | 0.00% | 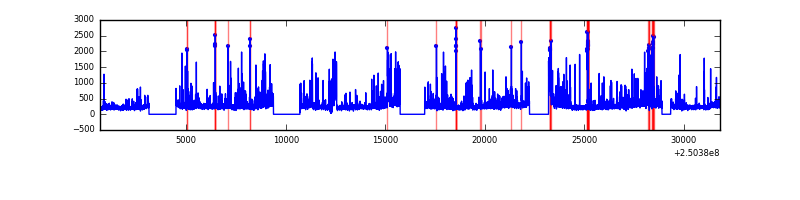 |
Top three noisy pixels from each quadrant. If the there are fewer than three noisy pixels in the level2.evt file, extra rows are filled as -1
| Pixel properties | Quadrant properties | ||||||
|---|---|---|---|---|---|---|---|
| Quadrant | DetID | PixID | Counts | Sigma | Mean | Median | Sigma |
| A | 0 | 29 | 1374 | 10.62 | 380 | 357 | 95.8 |
| A | 7 | 110 | 1215 | 8.96 | 380 | 357 | 95.8 |
| A | 9 | 19 | 1083 | 7.58 | 380 | 357 | 95.8 |
| B | 2 | 9 | 1179 | 11.17 | 370 | 355 | 73.8 |
| B | 3 | 17 | 1004 | 8.79 | 370 | 355 | 73.8 |
| B | 12 | 226 | 909 | 7.51 | 370 | 355 | 73.8 |
| C | 12 | 241 | 1032 | 6.74 | 382 | 357 | 100.1 |
| C | 9 | 233 | 967 | 6.1 | 382 | 357 | 100.1 |
| C | 2 | 191 | 964 | 6.07 | 382 | 357 | 100.1 |
| D | 3 | 14 | 926 | 6.35 | 350 | 317 | 95.8 |
| D | 6 | 231 | 901 | 6.09 | 350 | 317 | 95.8 |
| D | 10 | 189 | 879 | 5.86 | 350 | 317 | 95.8 |
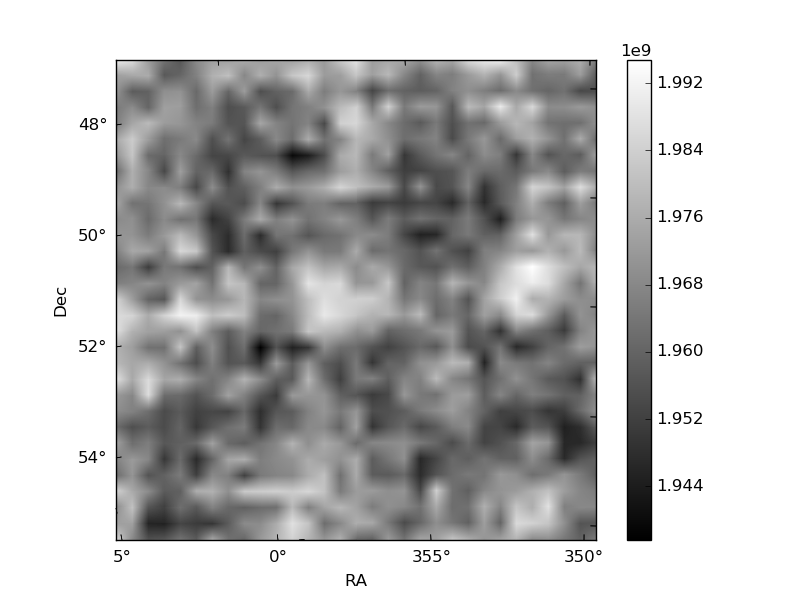
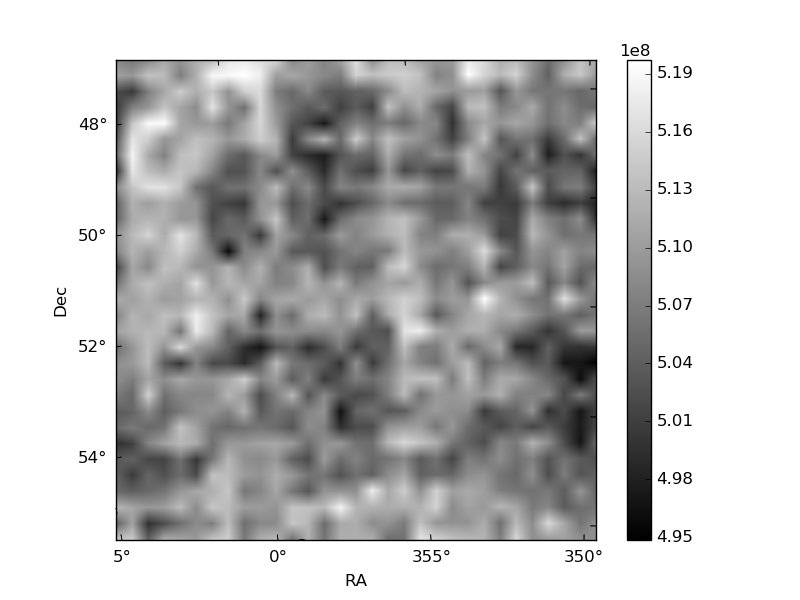
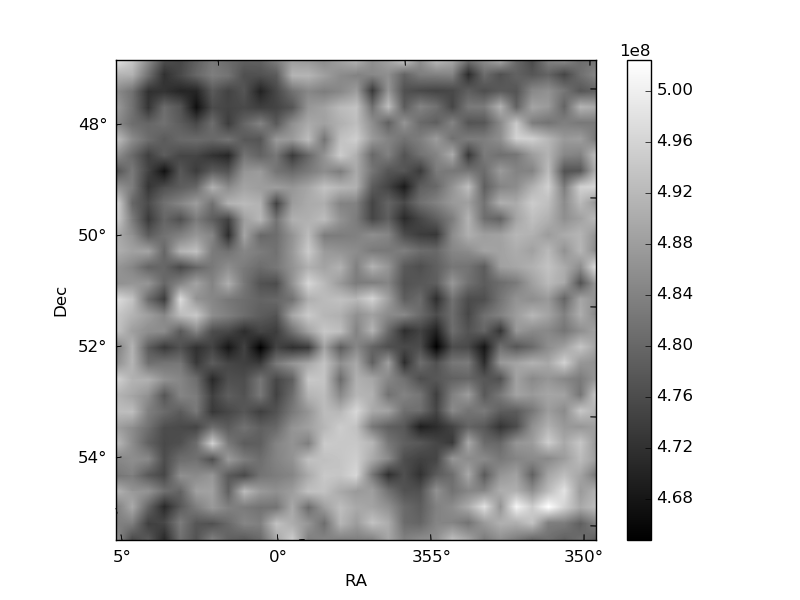
Histogram calculated using DETX and DETY for each event in the final _common_clean file
| Quadrant A | 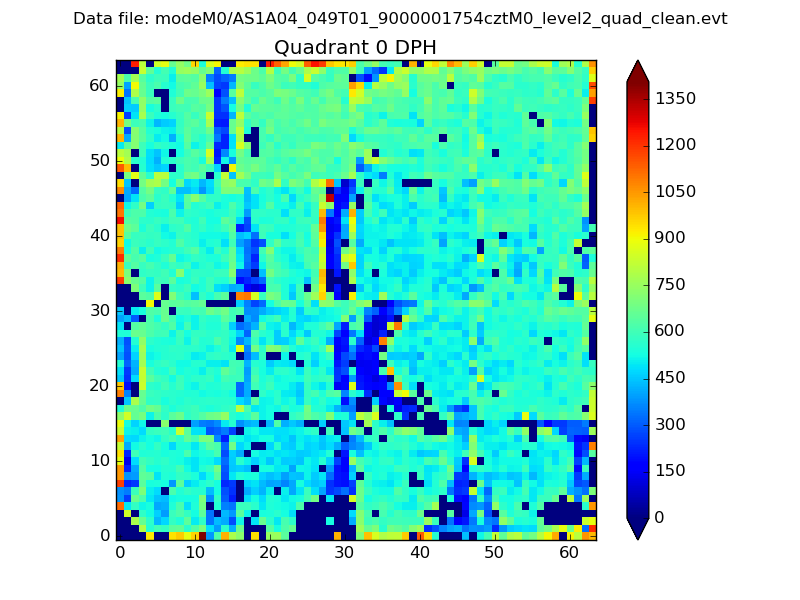 |
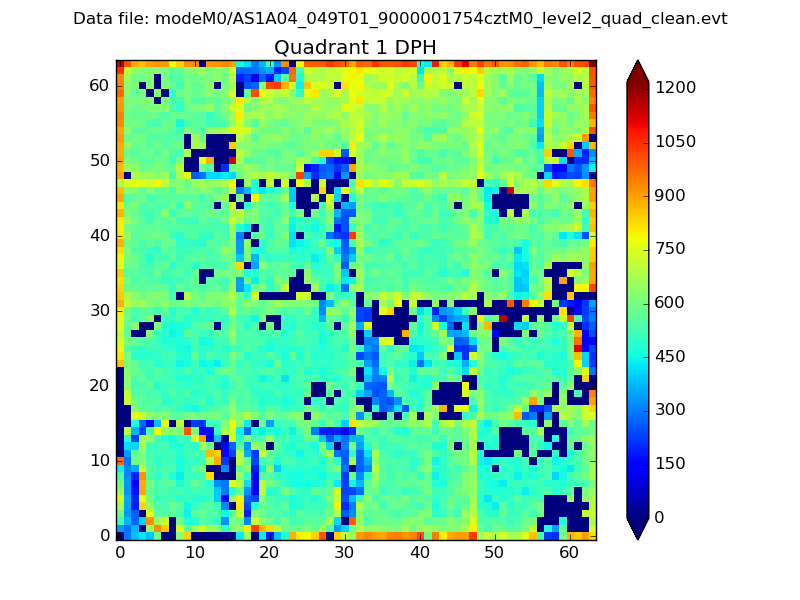 |
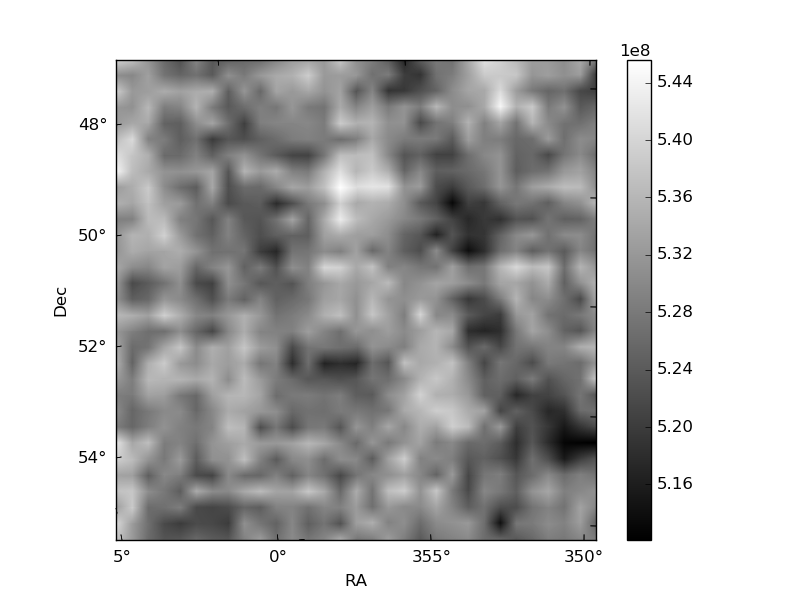
Quadrant B |
|---|---|---|---|
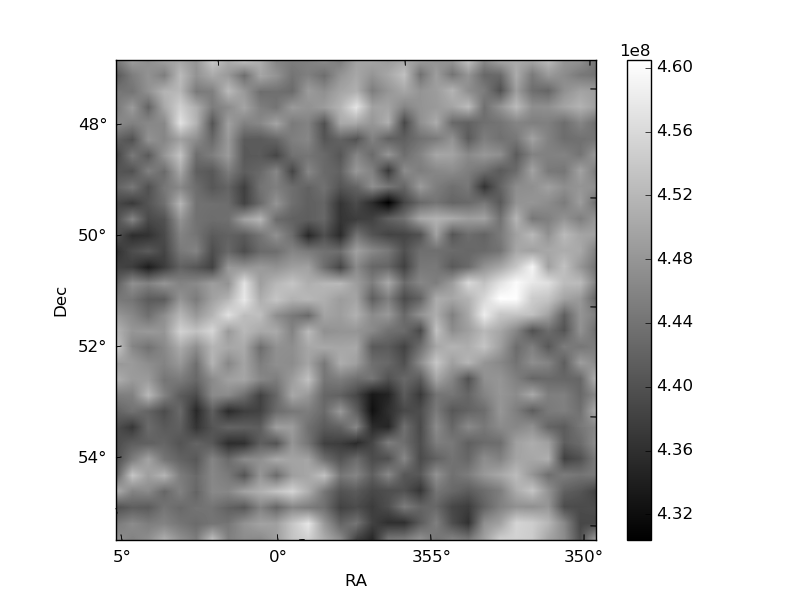
| Quadrant D | 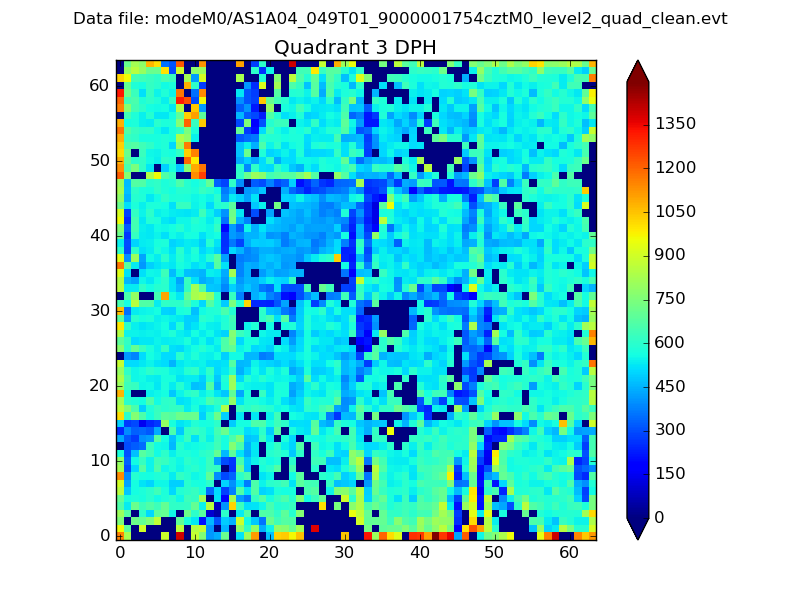 |
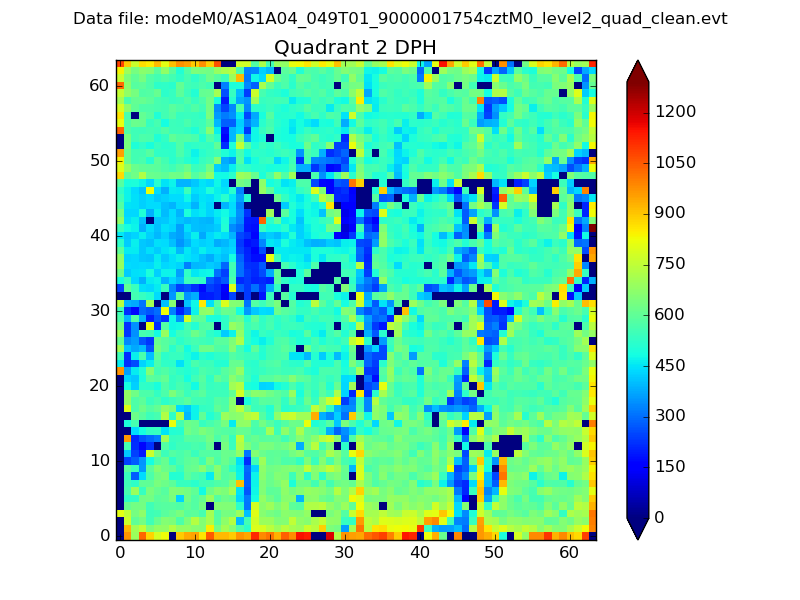 |
Quadrant C |
| Plot type | Count rate plots | Images |
|---|---|---|
| Comparison with Poisson distribution Blue bars denote a histogram of data divided into 1 sec bins. Red curve is a Poisson curve with rate = median count rate of data. |
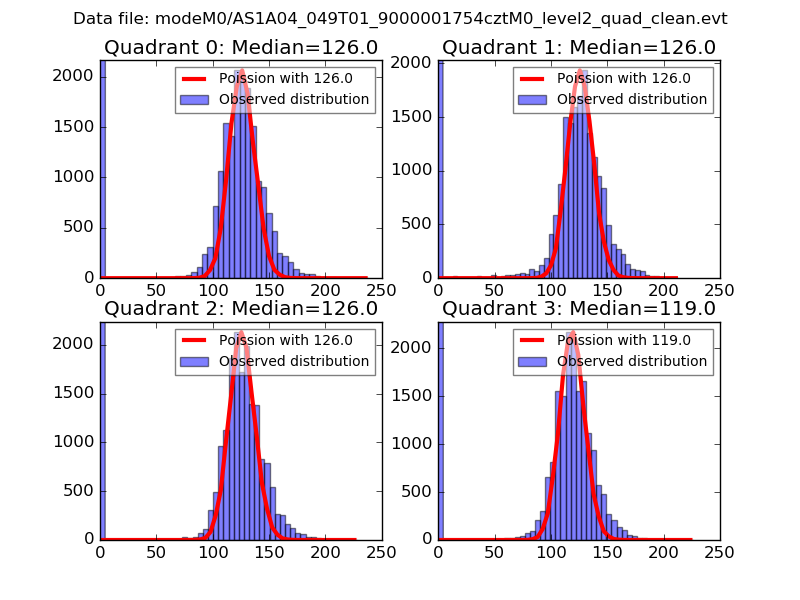 |
 |
| Quadrant-wise count rates Data is divided into 100 sec bins |
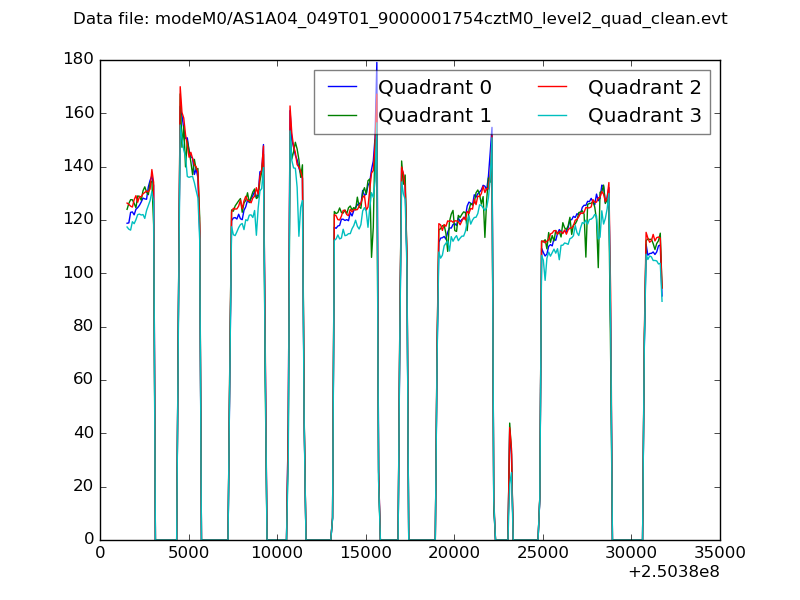 |
|
| Module-wise count rates for Quadrant A Data is divided into 100 sec bins |
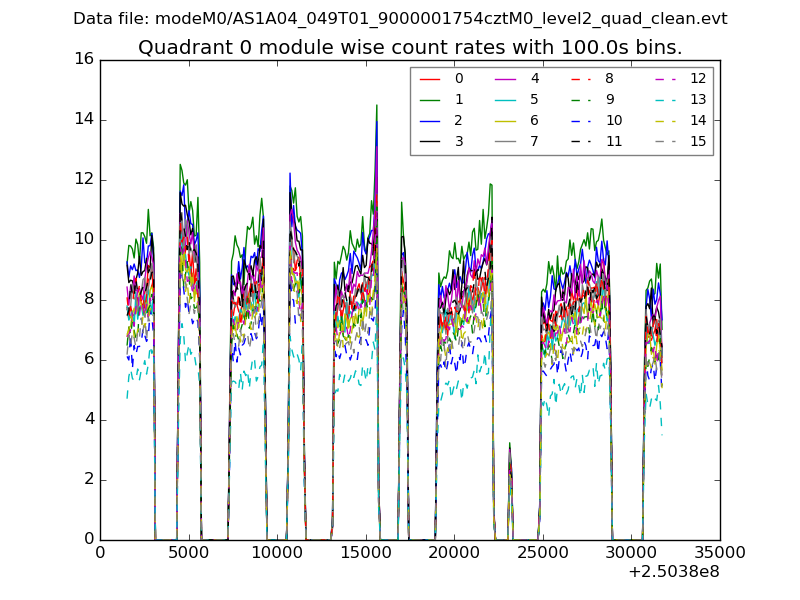 |
 |
| Module-wise count rates for Quadrant B Data is divided into 100 sec bins |
 |
 |
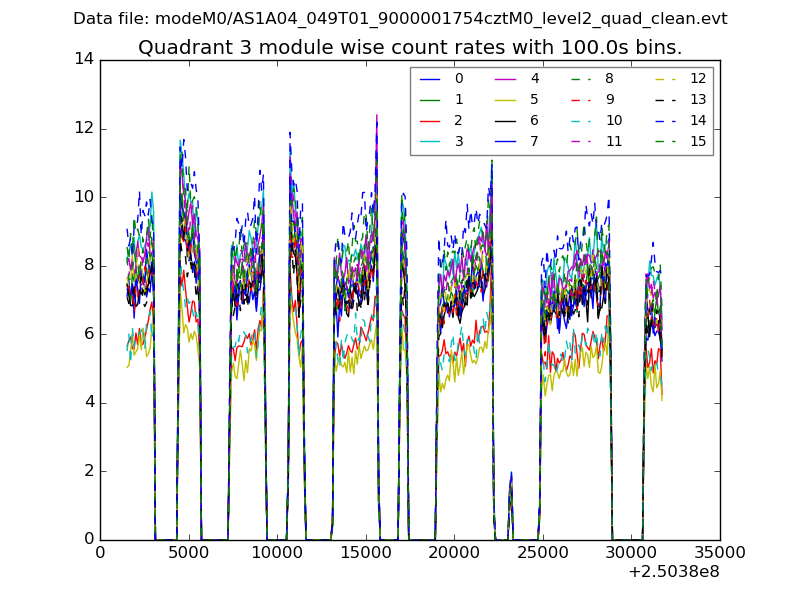
| Module-wise count rates for Quadrant C Data is divided into 100 sec bins |
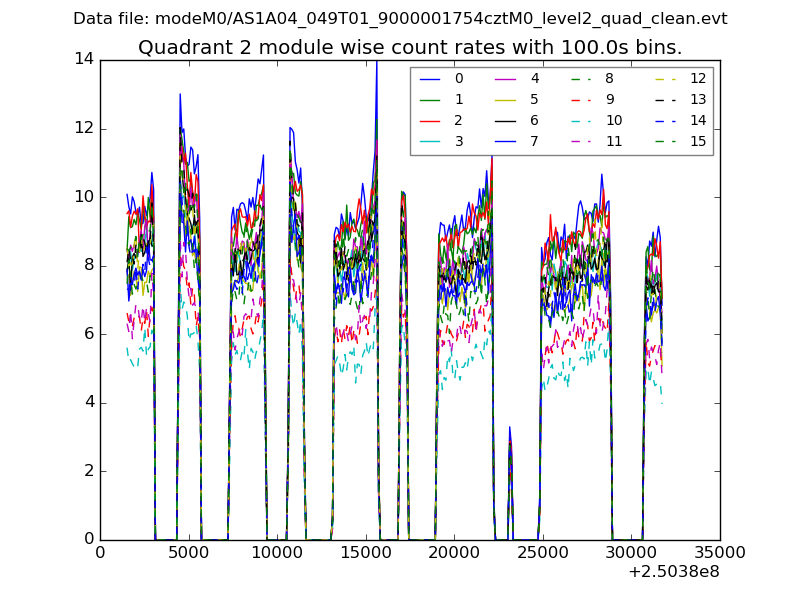 |
 |
| Module-wise count rates for Quadrant D Data is divided into 100 sec bins |
 |
 |
| Parameter | Plot |
|---|---|
| CZT HV Monitor | 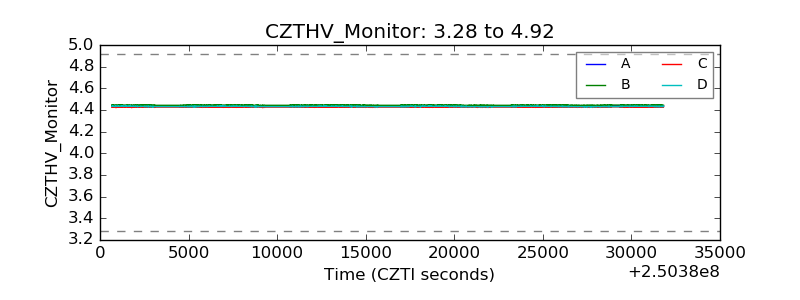 |
| D_VDD | 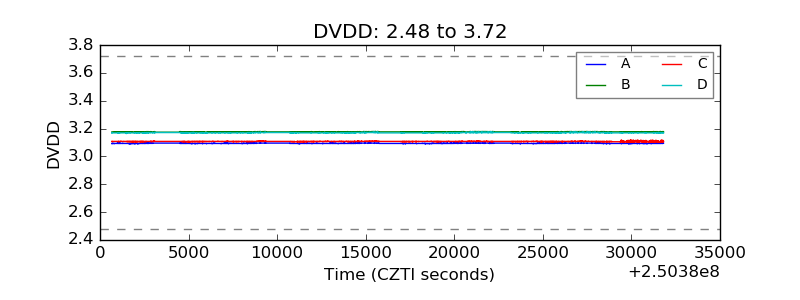 |
| Temperature 1 | 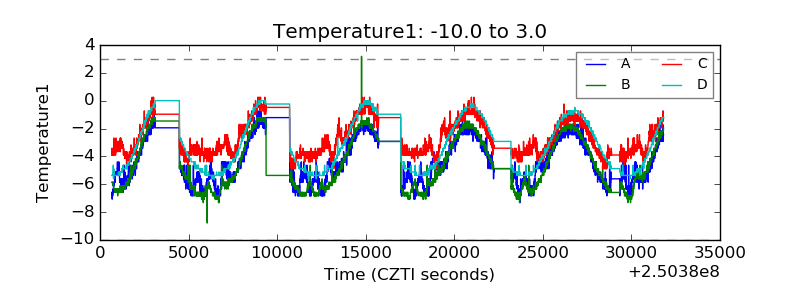 |
| Veto HV Monitor | 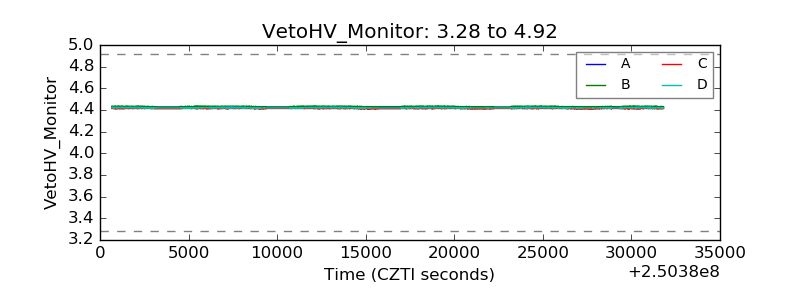 |
| Veto LLD | 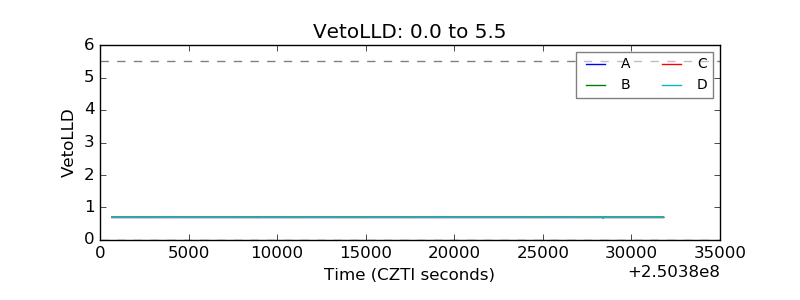 |
| Alpha Counter |  |
| _CPM_Rate | 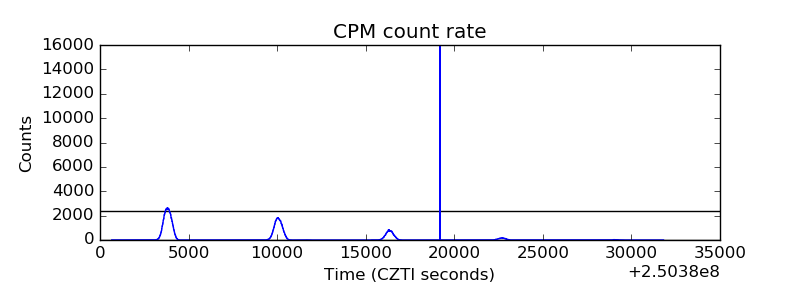 |
| CZT Counter | 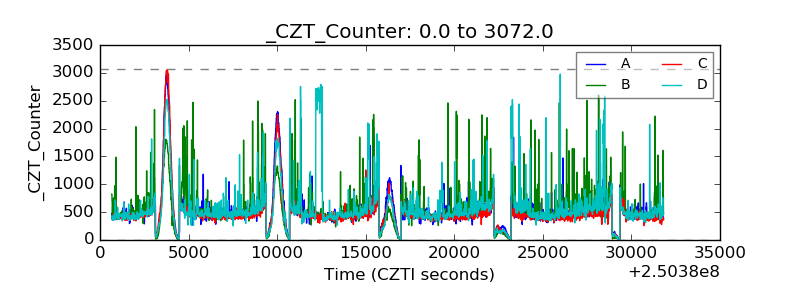 |
| +2.5 Volts monitor | 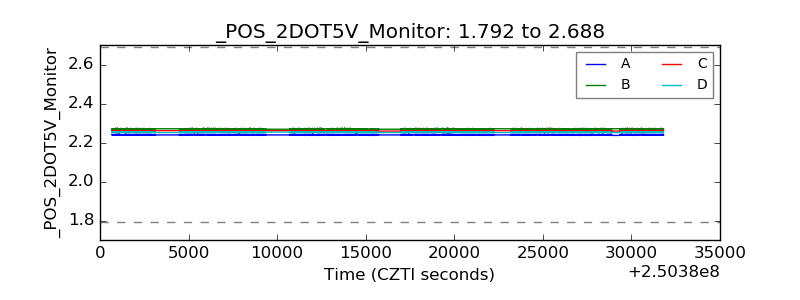 |
| +5 Volts monitor |  |
| _ROLL_ROT | 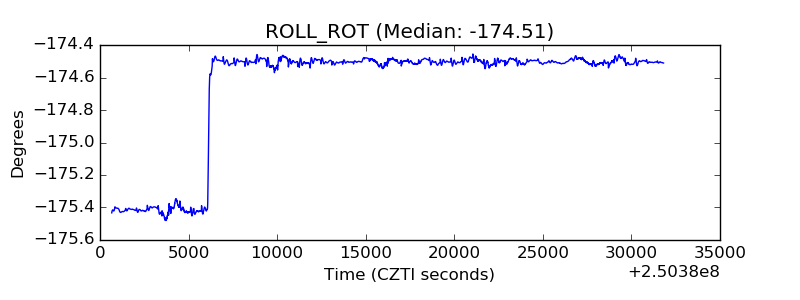 |
| _Roll_DEC | 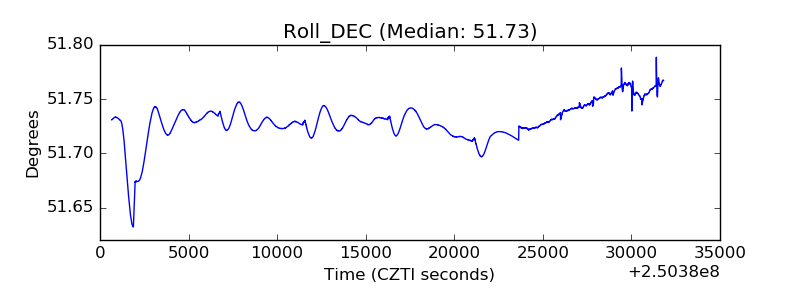 |
| _Roll_RA | 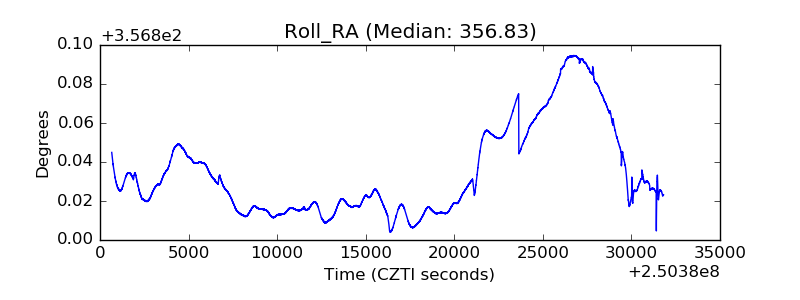 |
| Veto Counter | 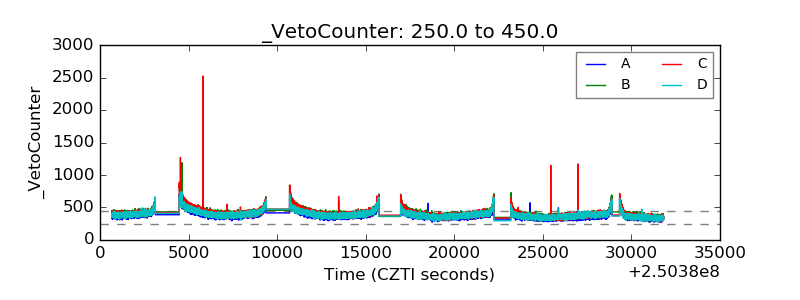 |