| Param | Original file | Final file |
|---|---|---|
| Filename | modeM0/AS1A04_049T01_9000001754_11868cztM0_level2.evt | modeM0/AS1A04_049T01_9000001754_11868cztM0_level2_quad_clean.evt |
| Size (bytes) | 265,374,720 | 58,723,200 |
| Size | 253.1 MB | 56.0 MB |
| Events in quadrant A | 1,863,471 | 381,946 |
| Events in quadrant B | 2,399,791 | 383,131 |
| Events in quadrant C | 1,711,508 | 387,716 |
| Events in quadrant D | 1,811,197 | 365,754 |
| Mode M0 | |||
|---|---|---|---|
| Quadrant | BADHDUFLAG | Total packets | Discarded packets |
| A | 0 | 7891 | 2 |
| B | 0 | 9539 | 1 |
| C | 0 | 7509 | 1 |
| D | 0 | 7849 | 1 |
| Mode SS | |||
|---|---|---|---|
| Quadrant | BADHDUFLAG | Total packets | Discarded packets |
| A | 0 | 76 | 0 |
| B | 0 | 76 | 0 |
| C | 0 | 76 | 0 |
| D | 0 | 76 | 0 |
| Mode M9 | |||
|---|---|---|---|
| Quadrant | BADHDUFLAG | Total packets | Discarded packets |
| A | 0 | 13 | 0 |
| B | 0 | 13 | 0 |
| C | 0 | 13 | 0 |
| D | 0 | 13 | 0 |
| Quadrant | Total seconds | Saturated seconds | Saturation percentage |
|---|---|---|---|
| A | 3665 | 14 | 0.381992% |
| B | 3665 | 179 | 4.884038% |
| C | 3665 | 5 | 0.136426% |
| D | 3665 | 20 | 0.545703% |
Noise dominated data is calculated using 1-second bins in cleaned event files. If a bin has >2000 counts, and if more than 50% of those come from <1% of pixels, then it is considered to be noise-dominated and hence unusable.
| Quadrant | # 1 sec bins | Bins with >0 counts | Bins with >2000 counts | High rate bins dominated by noise | Noise dominated (total time) | Noise dominated (detector-on time) | Marked lightcurve |
|---|---|---|---|---|---|---|---|
| A | 5026 | 3667 | 2 | 2 | 0.04% | 0.05% | 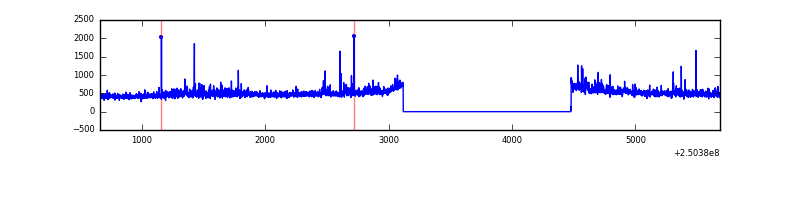 |
| B | 5026 | 3667 | 94 | 94 | 1.87% | 2.56% | 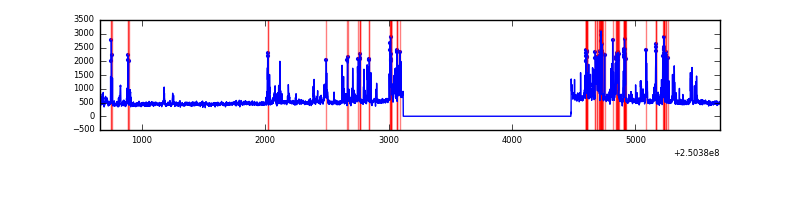 |
| C | 5026 | 3667 | 0 | 0 | 0.00% | 0.00% | 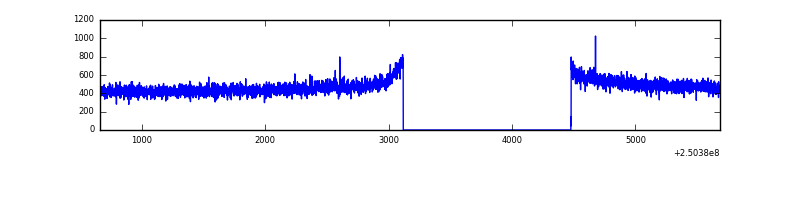 |
| D | 5026 | 3667 | 10 | 10 | 0.20% | 0.27% | 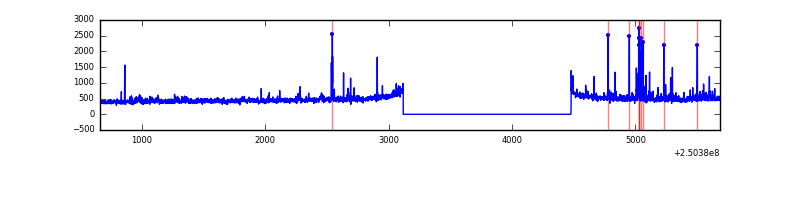 |
Top three noisy pixels from each quadrant. If the there are fewer than three noisy pixels in the level2.evt file, extra rows are filled as -1
| Pixel properties | Quadrant properties | ||||||
|---|---|---|---|---|---|---|---|
| Quadrant | DetID | PixID | Counts | Sigma | Mean | Median | Sigma |
| A | 1 | 162 | 47258 | 512.53 | 445 | 437 | 91.4 |
| A | 1 | 178 | 23817 | 255.93 | 445 | 437 | 91.4 |
| A | 1 | 161 | 21213 | 227.42 | 445 | 437 | 91.4 |
| B | 4 | 239 | 447274 | 5381.05 | 442 | 432 | 83.0 |
| B | 3 | 64 | 86894 | 1041.21 | 442 | 432 | 83.0 |
| B | 10 | 252 | 48520 | 579.1 | 442 | 432 | 83.0 |
| C | 13 | 61 | 3177 | 27.1 | 438 | 440 | 101.0 |
| C | 7 | 247 | 1574 | 11.23 | 438 | 440 | 101.0 |
| C | 14 | 234 | 1312 | 8.64 | 438 | 440 | 101.0 |
| D | 1 | 52 | 47840 | 458.6 | 431 | 418 | 103.4 |
| D | 13 | 104 | 42428 | 406.27 | 431 | 418 | 103.4 |
| D | 12 | 233 | 31260 | 298.26 | 431 | 418 | 103.4 |
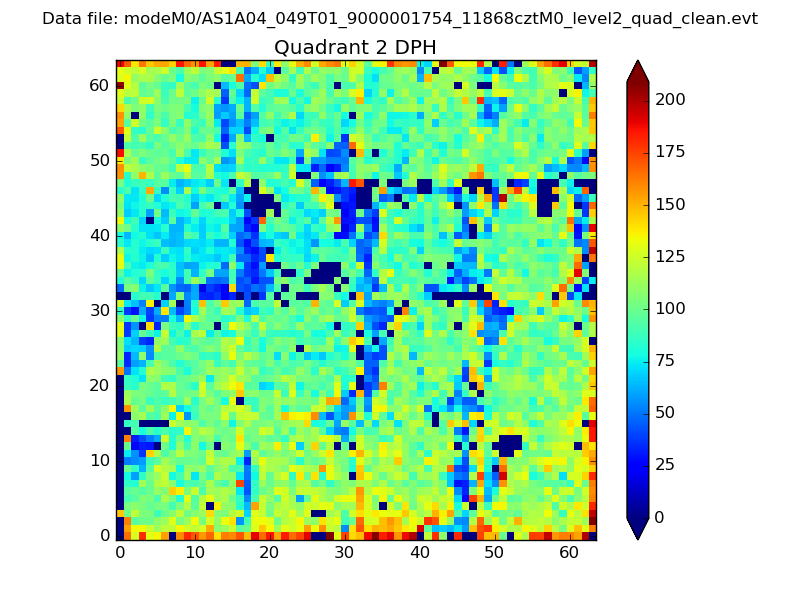
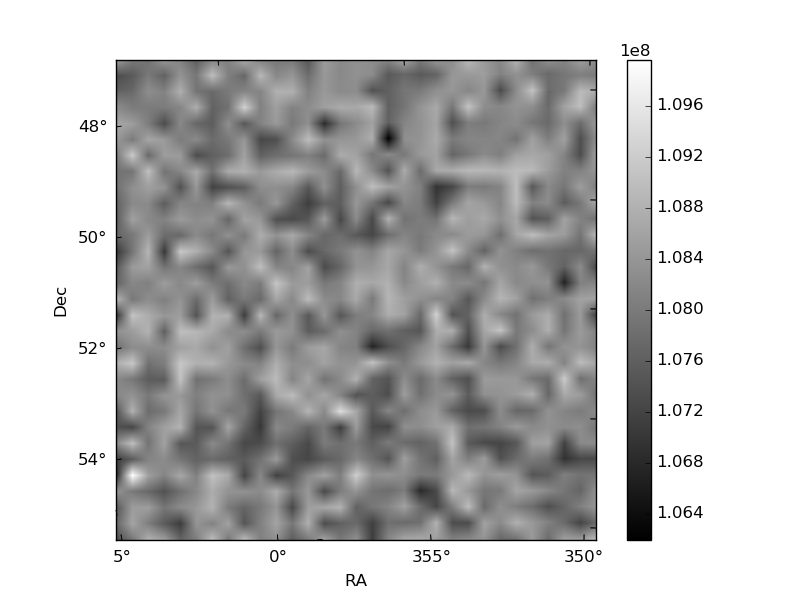
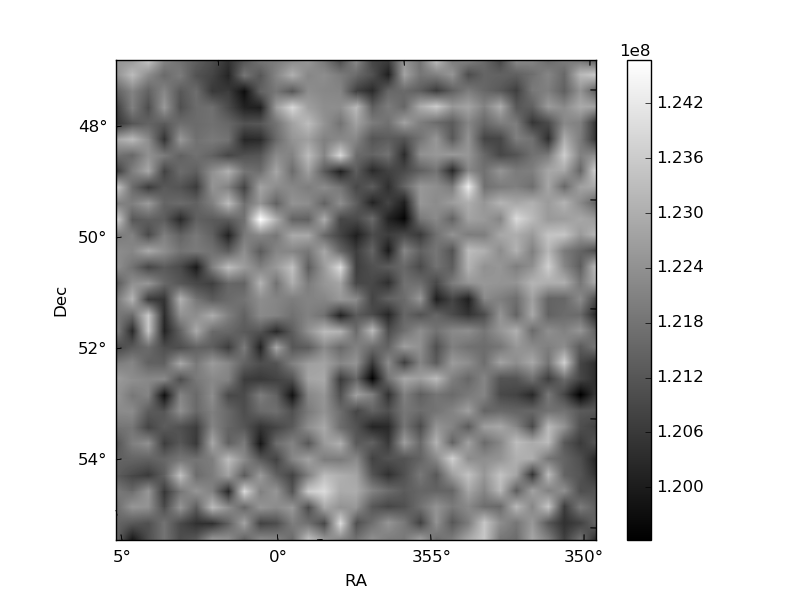
Histogram calculated using DETX and DETY for each event in the final _common_clean file
| Quadrant A | 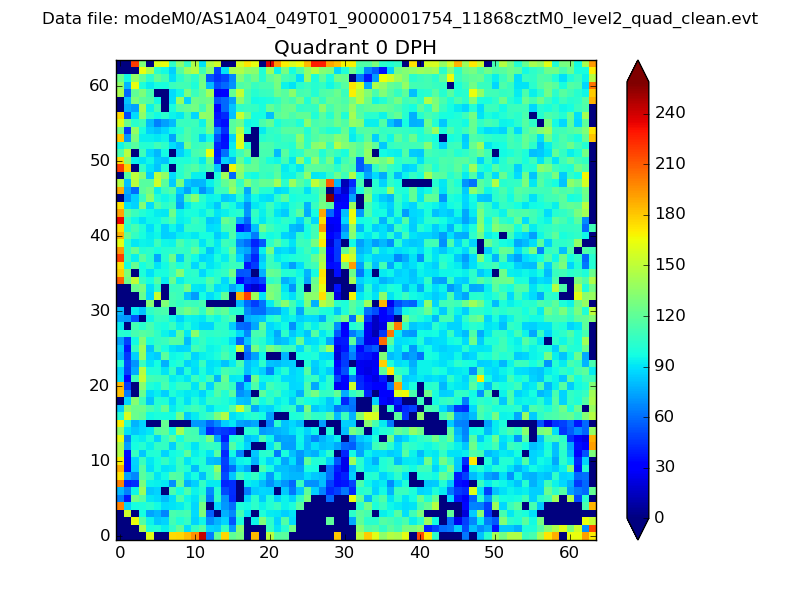 |
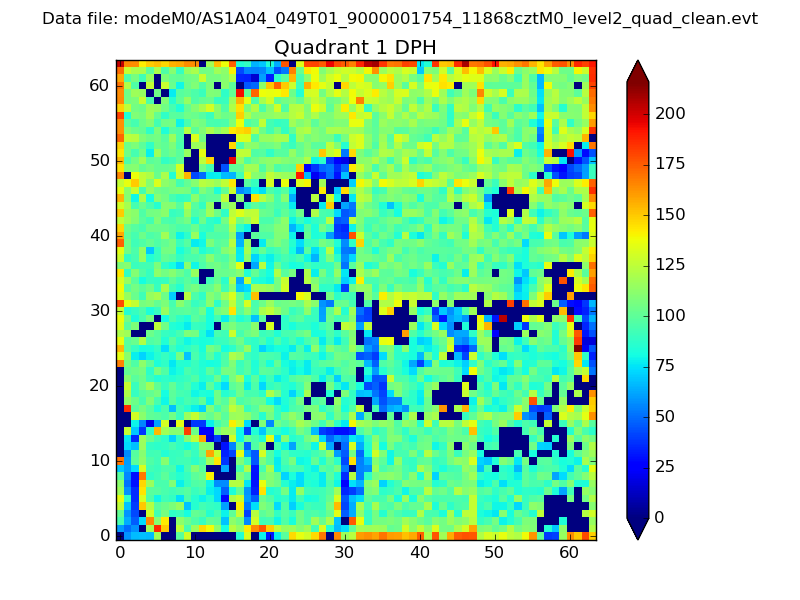 |
Quadrant B |
|---|---|---|---|
| Quadrant D | 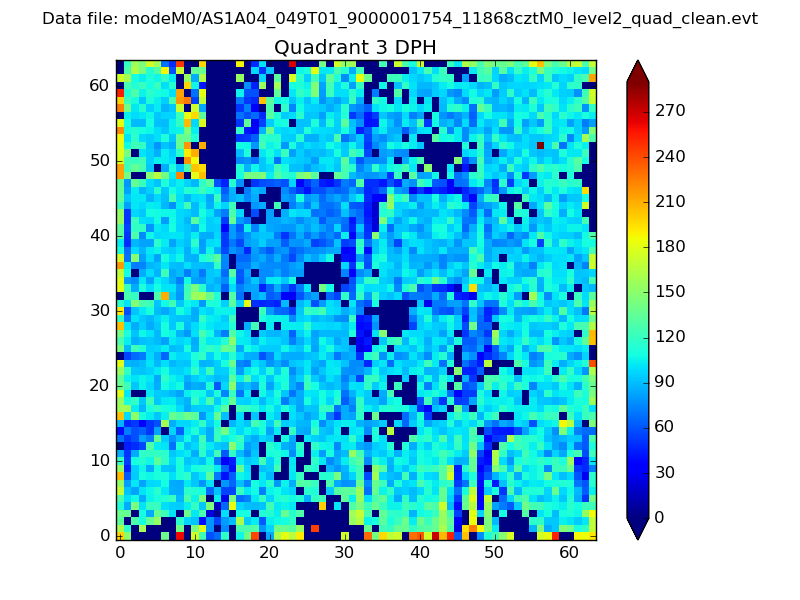 |
 |
Quadrant C |
| Plot type | Count rate plots | Images |
|---|---|---|
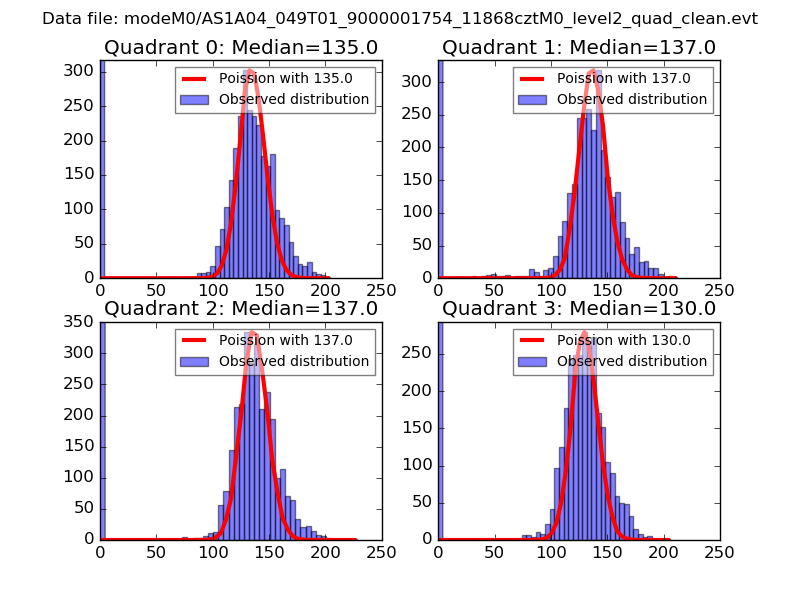
| Comparison with Poisson distribution Blue bars denote a histogram of data divided into 1 sec bins. Red curve is a Poisson curve with rate = median count rate of data. |
 |
 |
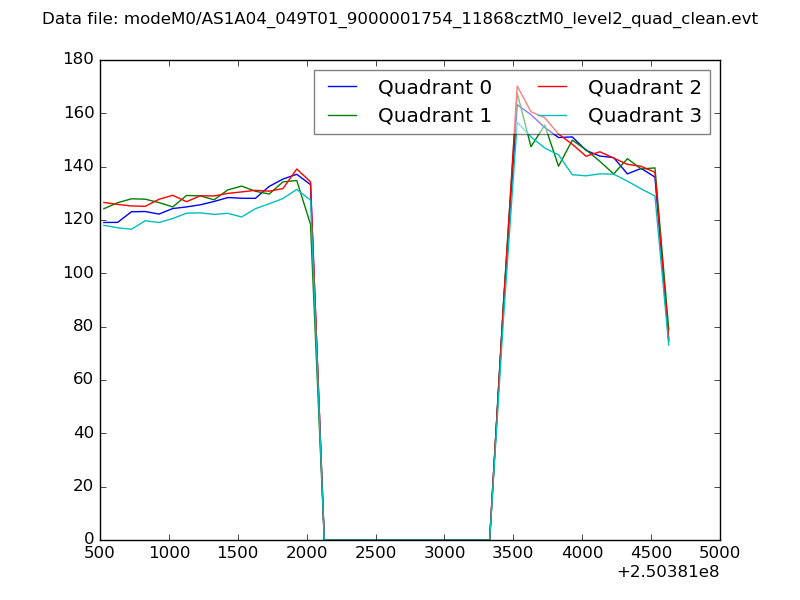
| Quadrant-wise count rates Data is divided into 100 sec bins |
 |
|
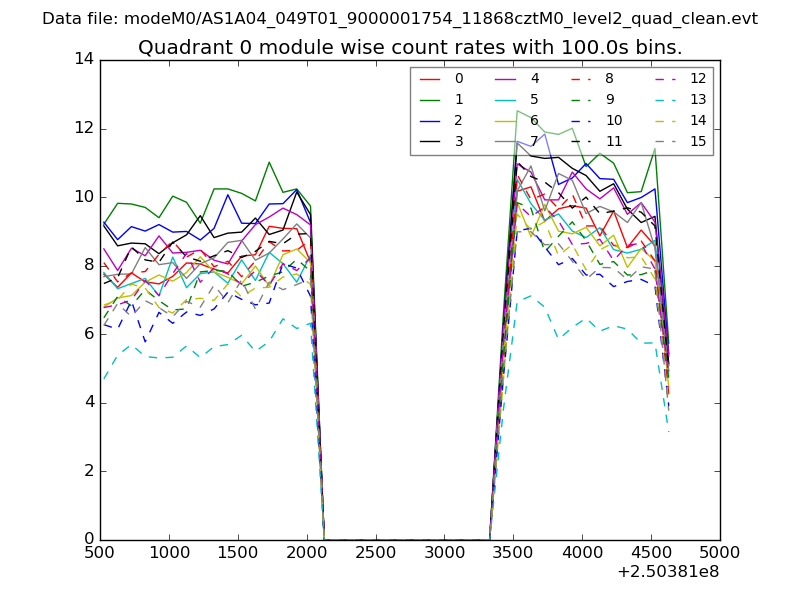
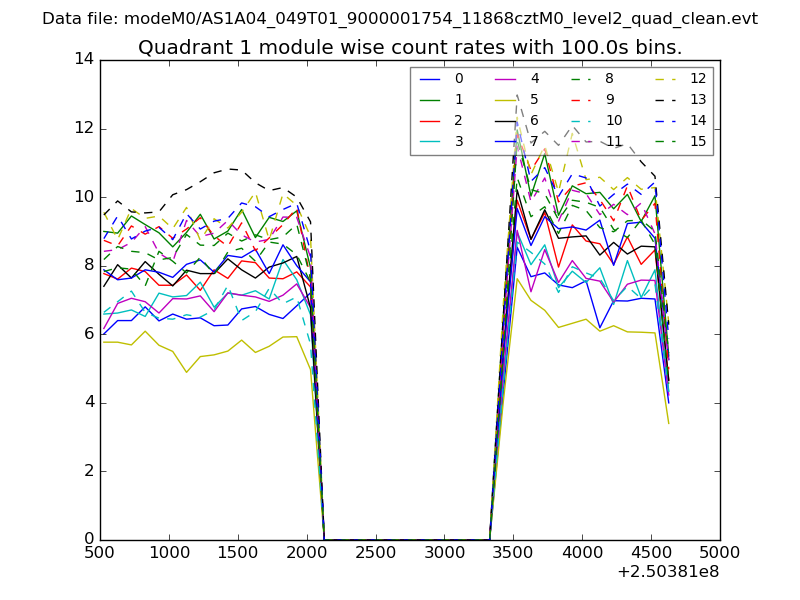
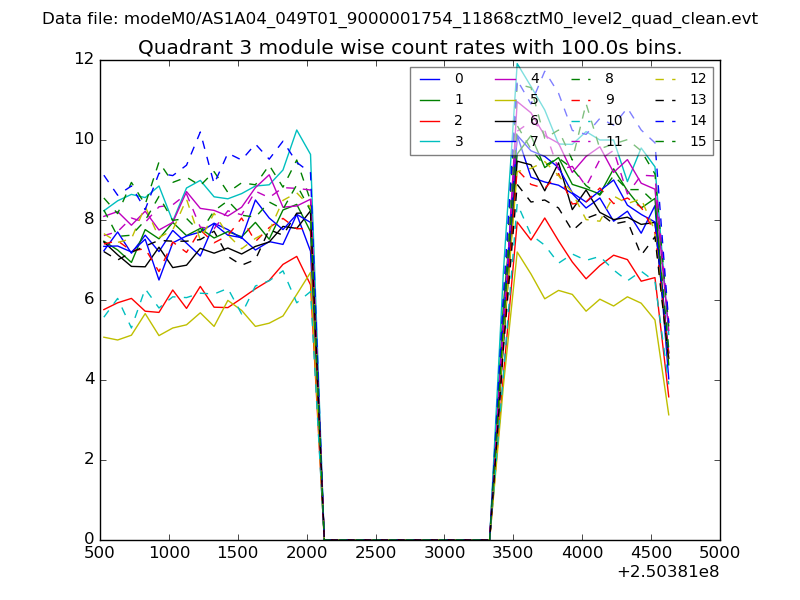
| Module-wise count rates for Quadrant A Data is divided into 100 sec bins |
 |
 |
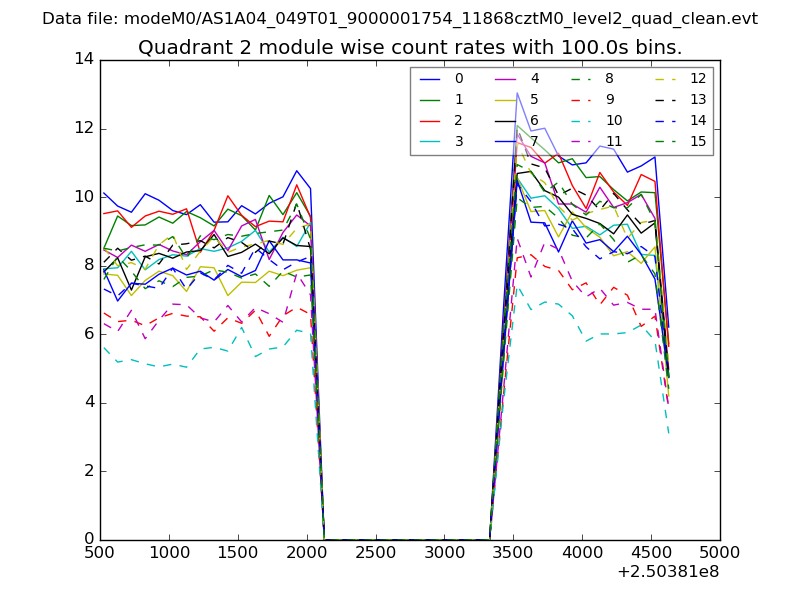
| Module-wise count rates for Quadrant B Data is divided into 100 sec bins |
 |
 |
| Module-wise count rates for Quadrant C Data is divided into 100 sec bins |
 |
 |
| Module-wise count rates for Quadrant D Data is divided into 100 sec bins |
 |
 |
| Parameter | Plot |
|---|---|
| CZT HV Monitor | 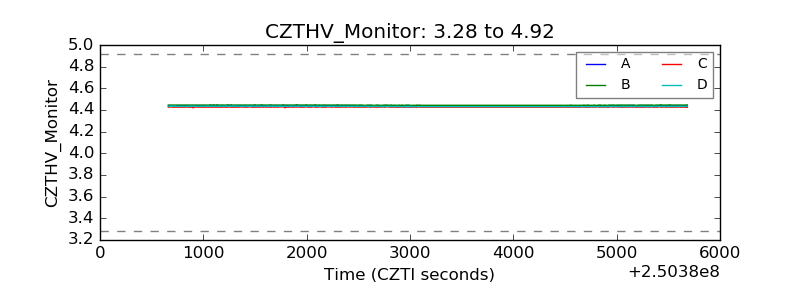 |
| D_VDD | 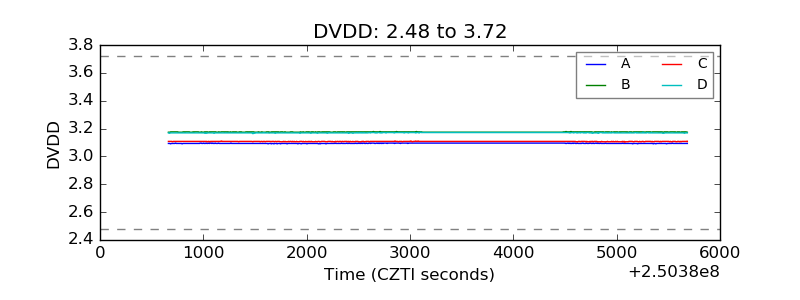 |
| Temperature 1 |  |
| Veto HV Monitor | 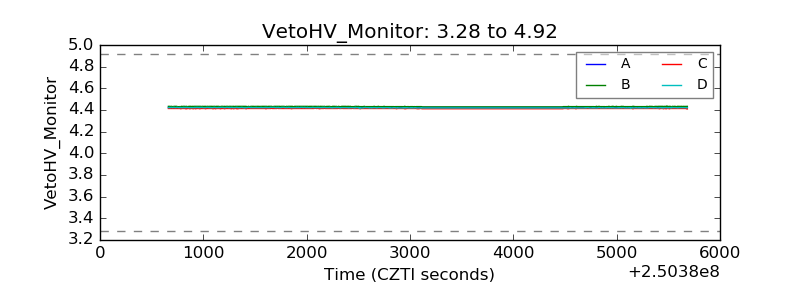 |
| Veto LLD |  |
| Alpha Counter | 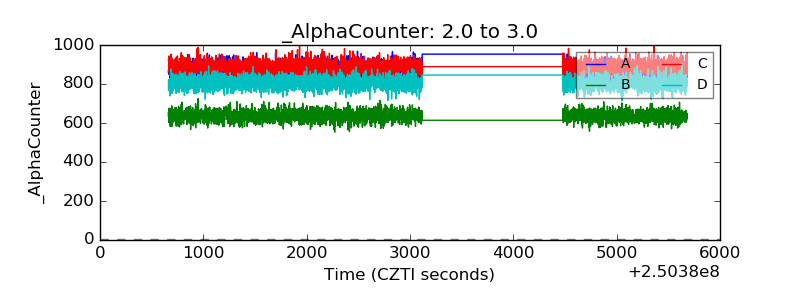 |
| _CPM_Rate | 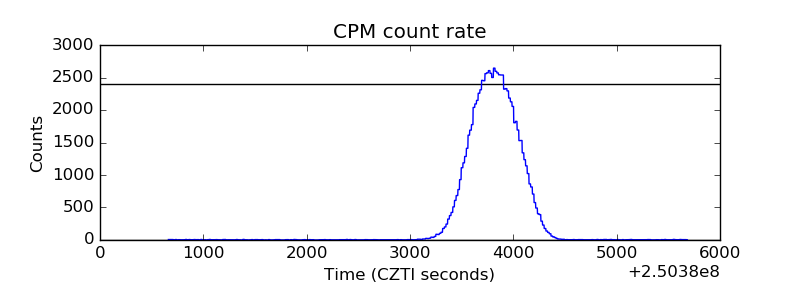 |
| CZT Counter | 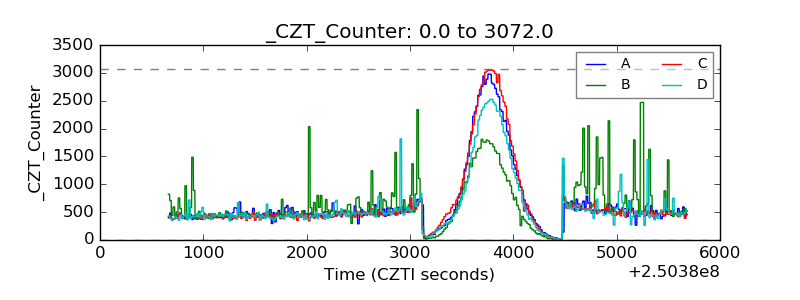 |
| +2.5 Volts monitor |  |
| +5 Volts monitor |  |
| _ROLL_ROT | 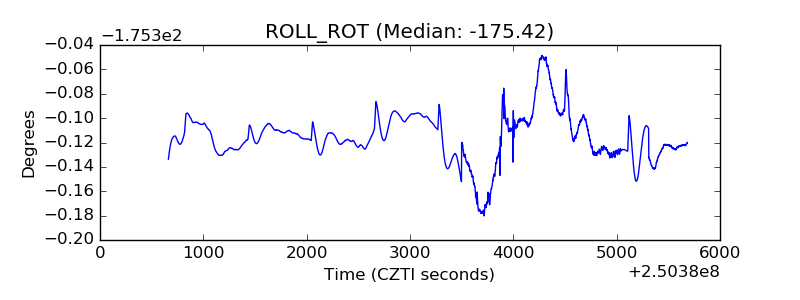 |
| _Roll_DEC | 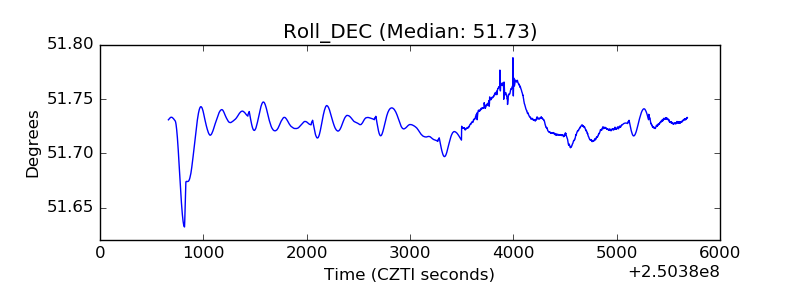 |
| _Roll_RA | 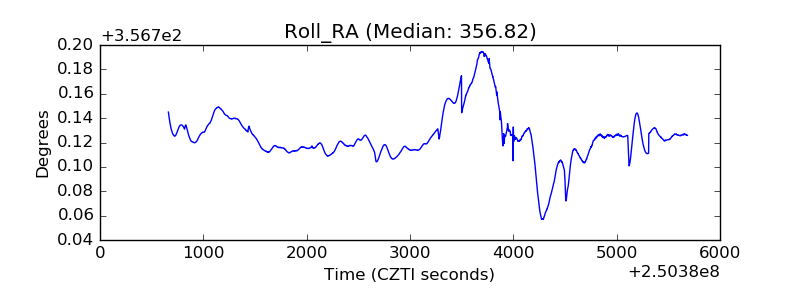 |
| Veto Counter | 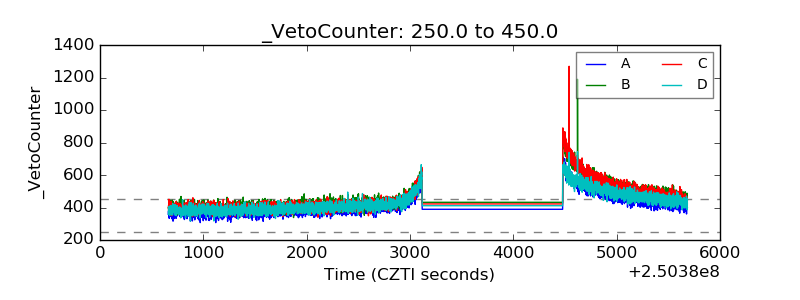 |