| Param | Original file | Final file |
|---|---|---|
| Filename | modeM0/AS1A04_049T01_9000001754_11871cztM0_level2.evt | modeM0/AS1A04_049T01_9000001754_11871cztM0_level2_quad_clean.evt |
| Size (bytes) | 529,715,520 | 81,642,240 |
| Size | 505.2 MB | 77.9 MB |
| Events in quadrant A | 3,559,857 | 503,917 |
| Events in quadrant B | 4,465,760 | 497,436 |
| Events in quadrant C | 3,192,216 | 504,155 |
| Events in quadrant D | 4,345,222 | 474,709 |
| Mode M0 | |||
|---|---|---|---|
| Quadrant | BADHDUFLAG | Total packets | Discarded packets |
| A | 0 | 15260 | 3 |
| B | 0 | 18066 | 2 |
| C | 0 | 14518 | 2 |
| D | 0 | 17673 | 2 |
| Mode SS | |||
|---|---|---|---|
| Quadrant | BADHDUFLAG | Total packets | Discarded packets |
| A | 0 | 146 | 0 |
| B | 0 | 146 | 0 |
| C | 0 | 146 | 0 |
| D | 0 | 146 | 0 |
| Mode M9 | |||
|---|---|---|---|
| Quadrant | BADHDUFLAG | Total packets | Discarded packets |
| A | 0 | 22 | 0 |
| B | 0 | 22 | 0 |
| C | 0 | 22 | 0 |
| D | 0 | 22 | 0 |
| Quadrant | Total seconds | Saturated seconds | Saturation percentage |
|---|---|---|---|
| A | 7059 | 140 | 1.983284% |
| B | 7059 | 361 | 5.114039% |
| C | 7059 | 61 | 0.864145% |
| D | 7059 | 265 | 3.754073% |
Noise dominated data is calculated using 1-second bins in cleaned event files. If a bin has >2000 counts, and if more than 50% of those come from <1% of pixels, then it is considered to be noise-dominated and hence unusable.
| Quadrant | # 1 sec bins | Bins with >0 counts | Bins with >2000 counts | High rate bins dominated by noise | Noise dominated (total time) | Noise dominated (detector-on time) | Marked lightcurve |
|---|---|---|---|---|---|---|---|
| A | 9250 | 7062 | 0 | 0 | 0.00% | 0.00% |  |
| B | 9250 | 7062 | 132 | 132 | 1.43% | 1.87% | 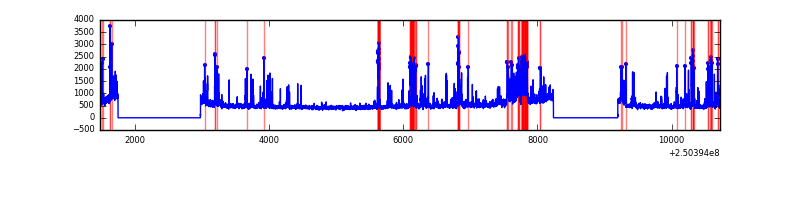 |
| C | 9250 | 7062 | 0 | 0 | 0.00% | 0.00% | 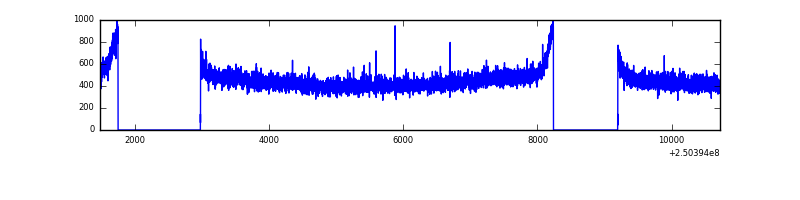 |
| D | 9250 | 7062 | 133 | 133 | 1.44% | 1.88% | 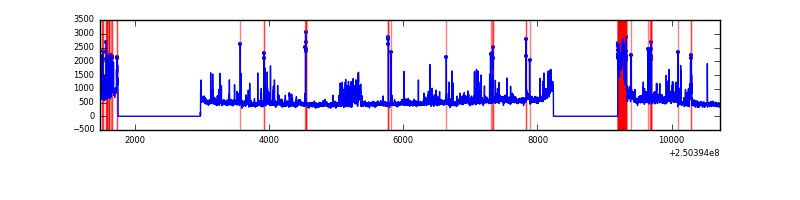 |
Top three noisy pixels from each quadrant. If the there are fewer than three noisy pixels in the level2.evt file, extra rows are filled as -1
| Pixel properties | Quadrant properties | ||||||
|---|---|---|---|---|---|---|---|
| Quadrant | DetID | PixID | Counts | Sigma | Mean | Median | Sigma |
| A | 1 | 162 | 130269 | 765.93 | 833 | 812 | 169.0 |
| A | 1 | 178 | 67358 | 393.72 | 833 | 812 | 169.0 |
| A | 1 | 161 | 59792 | 348.95 | 833 | 812 | 169.0 |
| B | 4 | 239 | 580880 | 3710.71 | 829 | 807 | 156.3 |
| B | 3 | 64 | 343390 | 2191.49 | 829 | 807 | 156.3 |
| B | 15 | 204 | 77977 | 493.65 | 829 | 807 | 156.3 |
| C | 13 | 61 | 6173 | 28.16 | 817 | 819 | 190.1 |
| C | 14 | 234 | 2444 | 8.55 | 817 | 819 | 190.1 |
| C | 7 | 247 | 2201 | 7.27 | 817 | 819 | 190.1 |
| D | 13 | 122 | 366124 | 1915.94 | 795 | 771 | 190.7 |
| D | 8 | 195 | 331211 | 1732.86 | 795 | 771 | 190.7 |
| D | 1 | 52 | 203475 | 1063.0 | 795 | 771 | 190.7 |
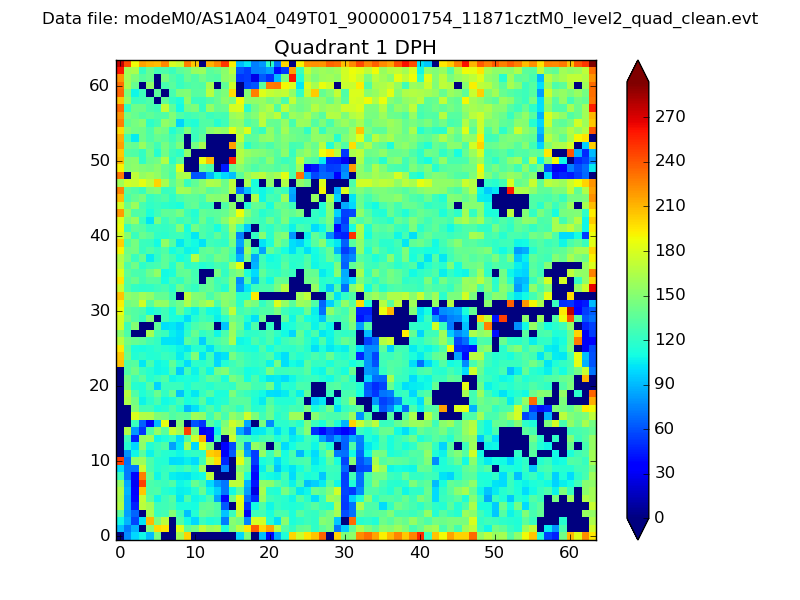
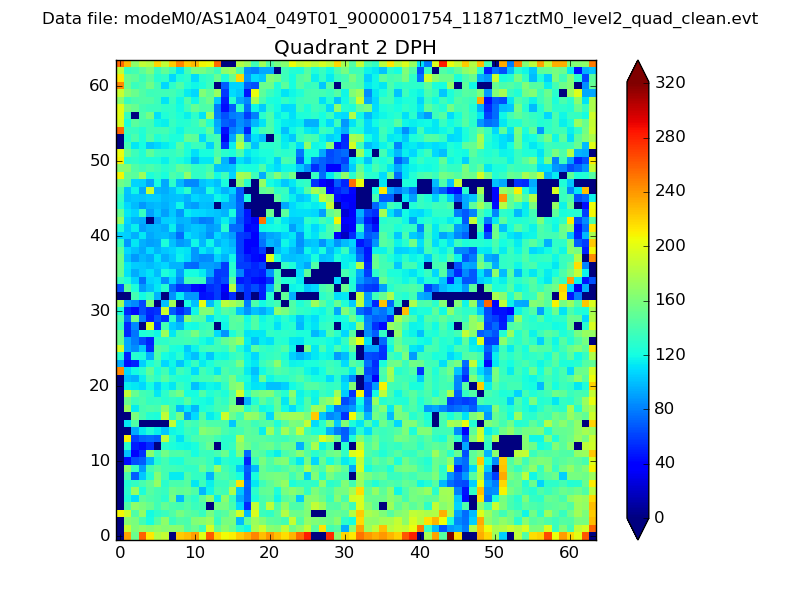
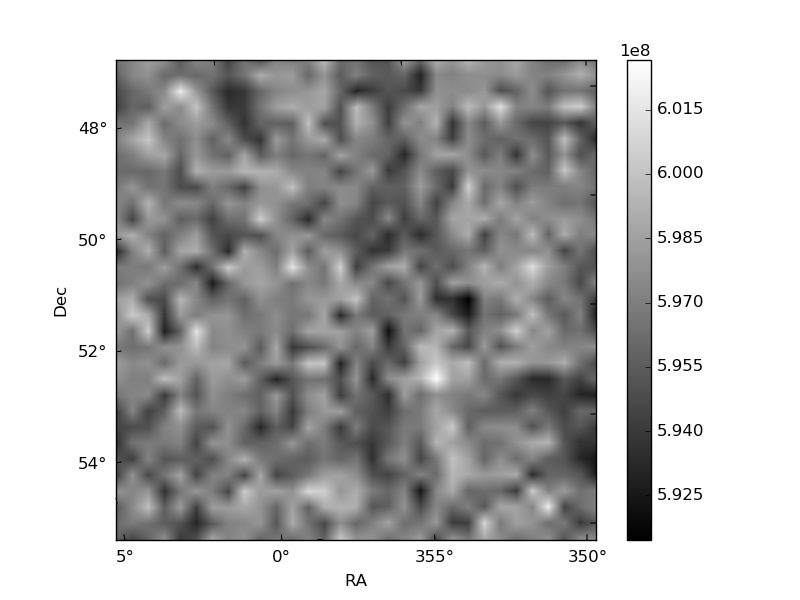
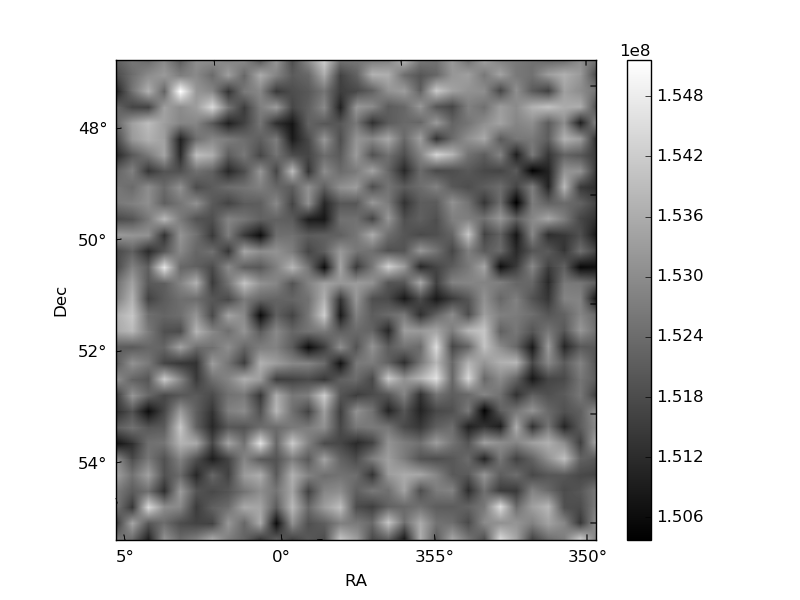
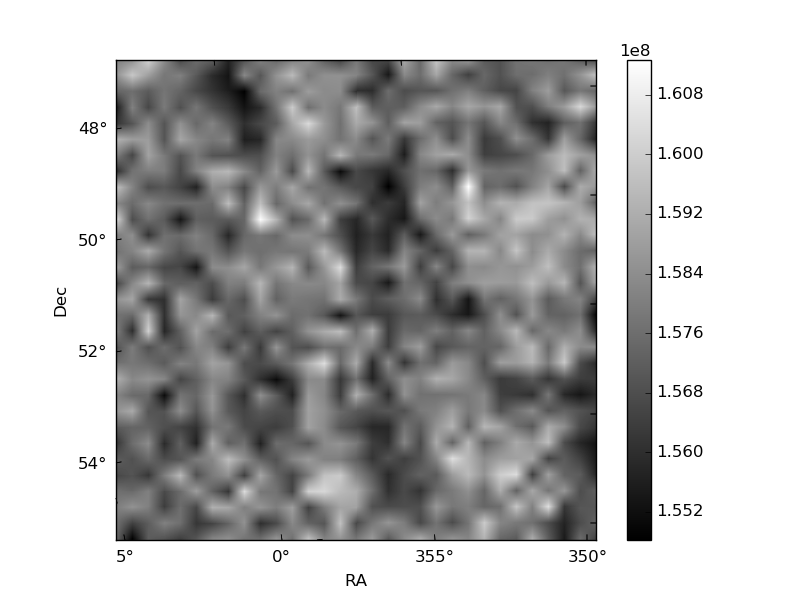
Histogram calculated using DETX and DETY for each event in the final _common_clean file
| Quadrant A | 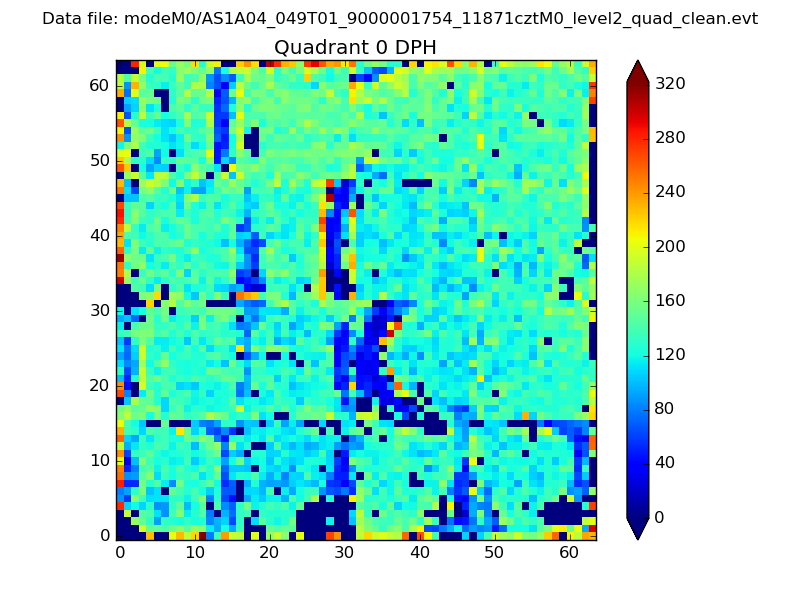 |
 |
Quadrant B |
|---|---|---|---|
| Quadrant D | 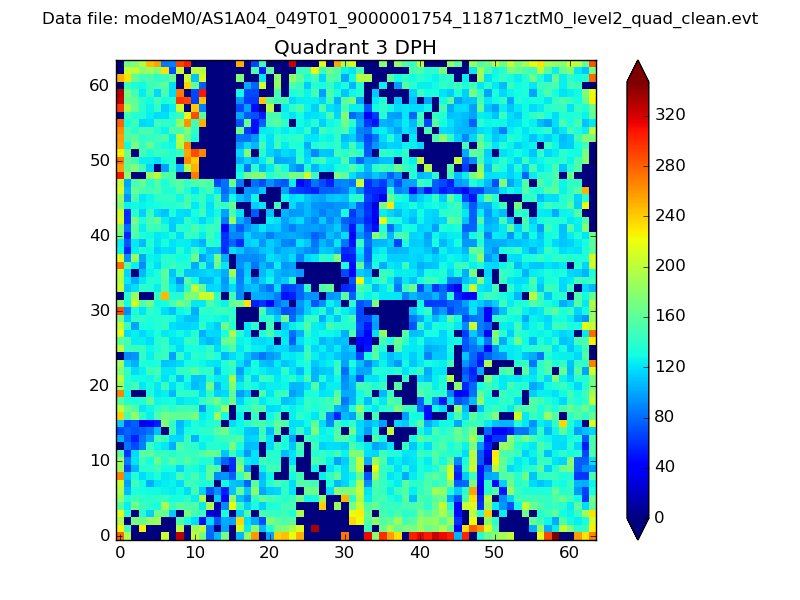 |
 |
Quadrant C |
| Plot type | Count rate plots | Images |
|---|---|---|
| Comparison with Poisson distribution Blue bars denote a histogram of data divided into 1 sec bins. Red curve is a Poisson curve with rate = median count rate of data. |
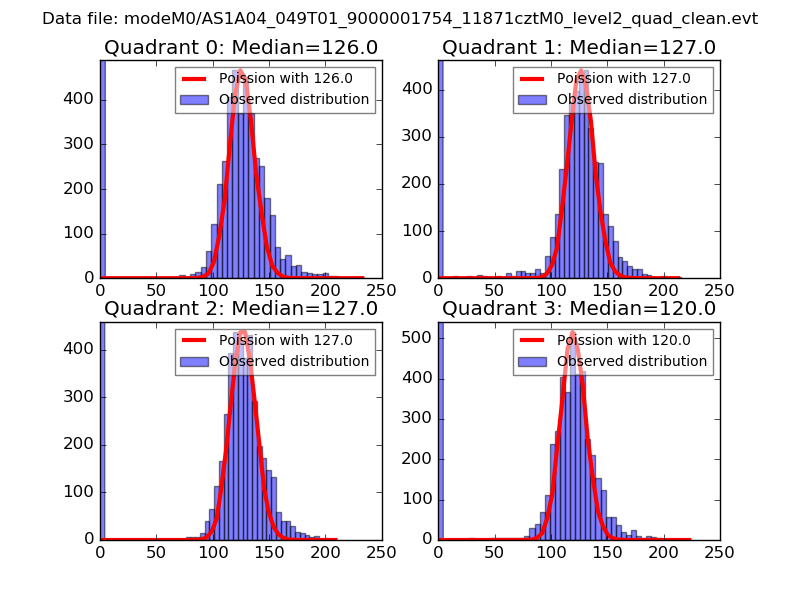 |
 |
| Quadrant-wise count rates Data is divided into 100 sec bins |
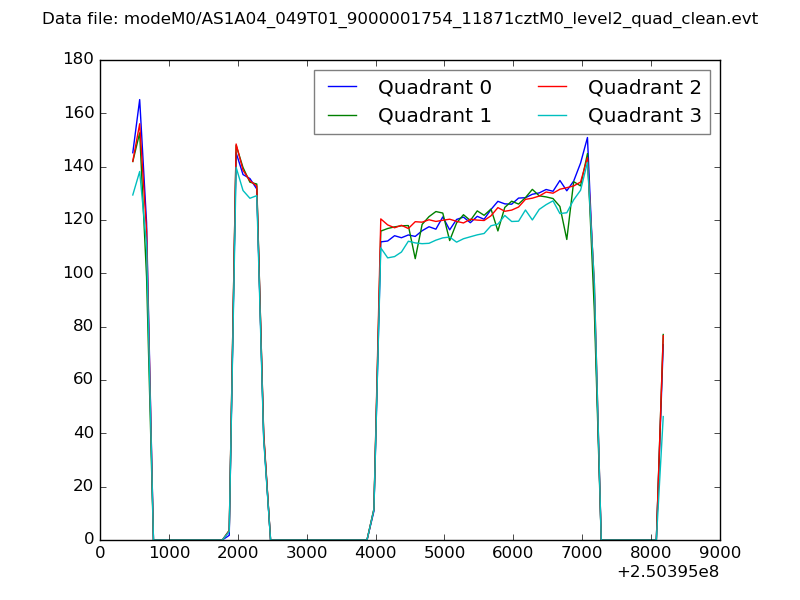 |
|
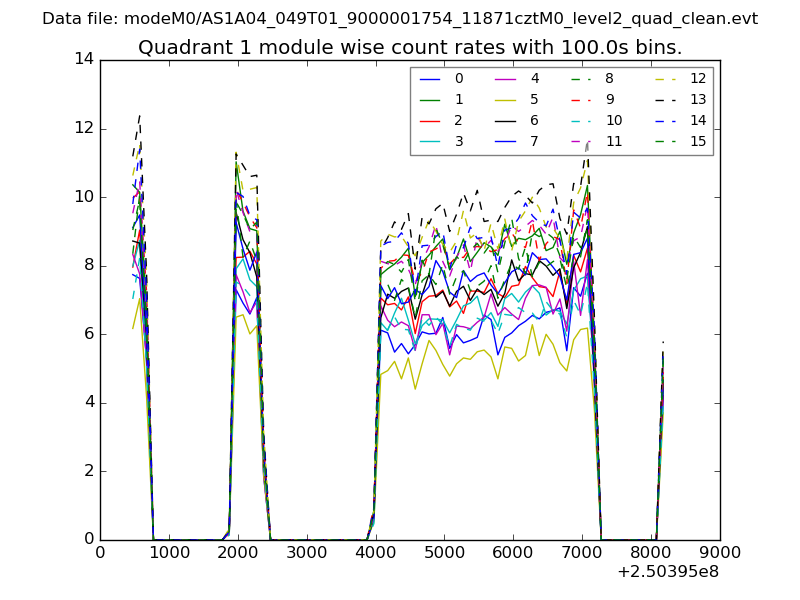
| Module-wise count rates for Quadrant A Data is divided into 100 sec bins |
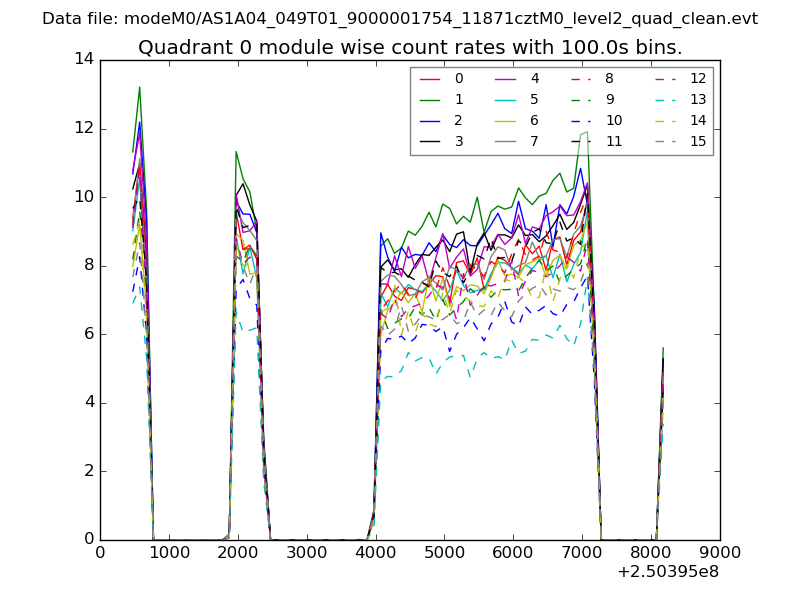 |
 |
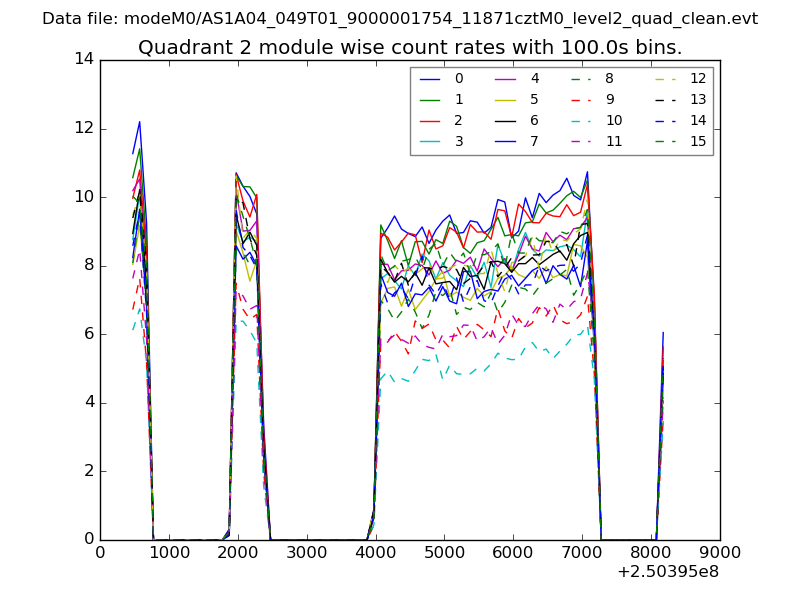
| Module-wise count rates for Quadrant B Data is divided into 100 sec bins |
 |
 |
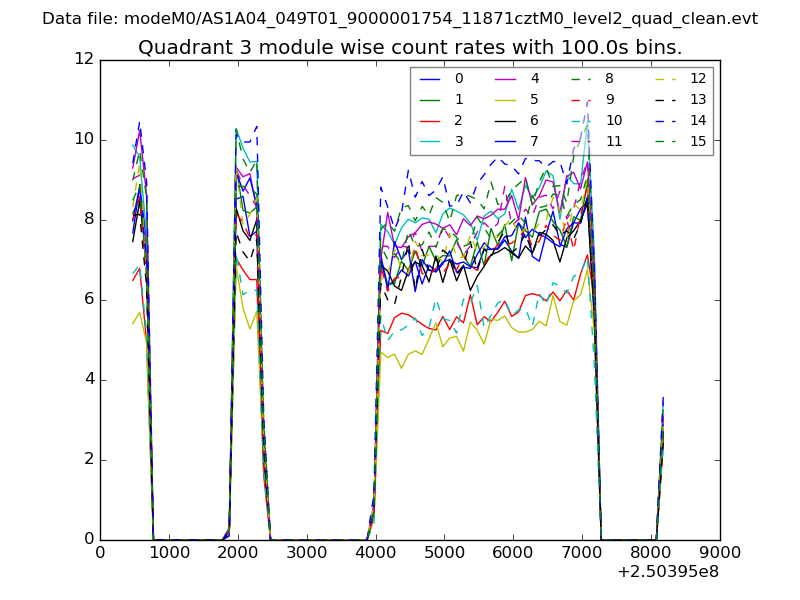
| Module-wise count rates for Quadrant C Data is divided into 100 sec bins |
 |
 |
| Module-wise count rates for Quadrant D Data is divided into 100 sec bins |
 |
 |
| Parameter | Plot |
|---|---|
| CZT HV Monitor | 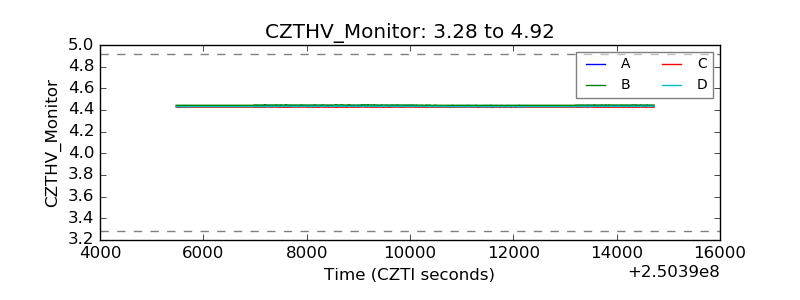 |
| D_VDD | 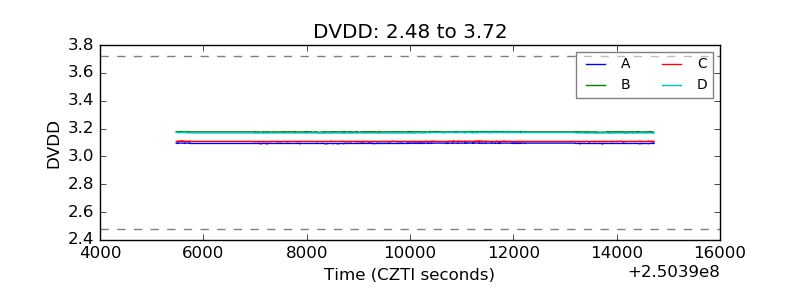 |
| Temperature 1 | 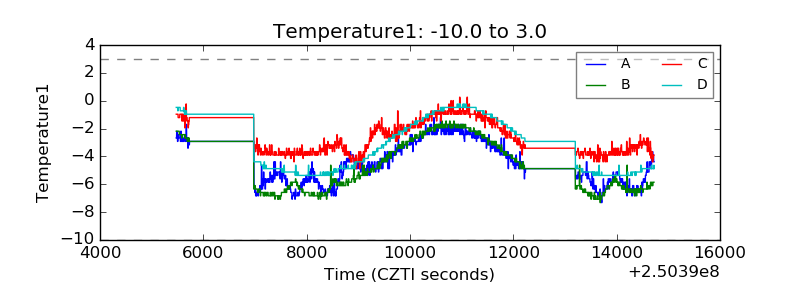 |
| Veto HV Monitor | 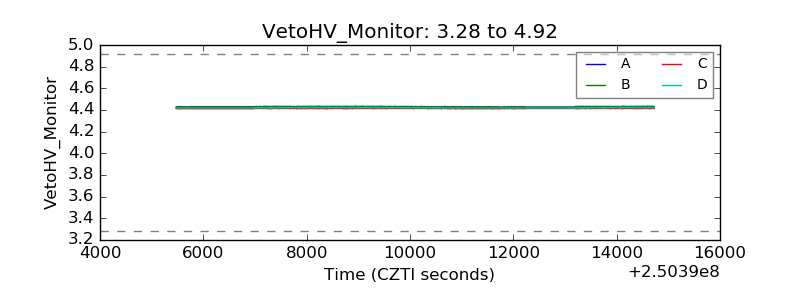 |
| Veto LLD | 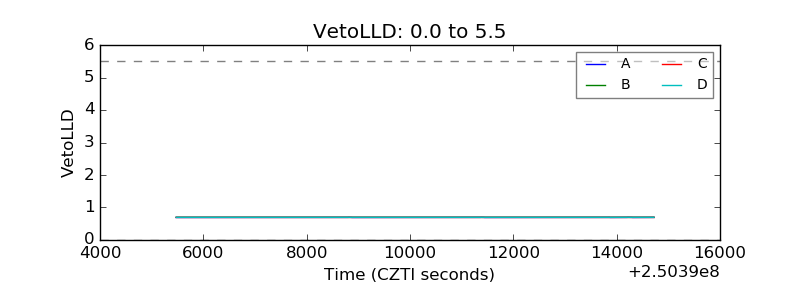 |
| Alpha Counter | 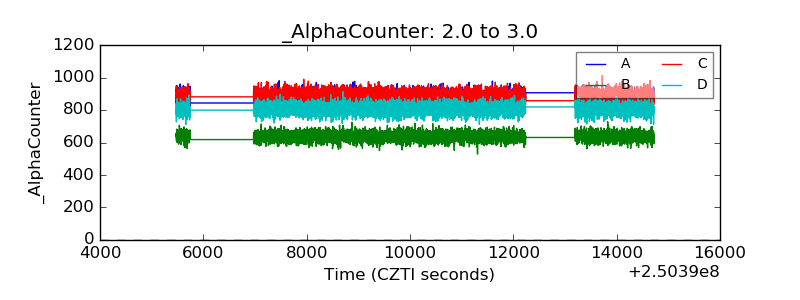 |
| _CPM_Rate | 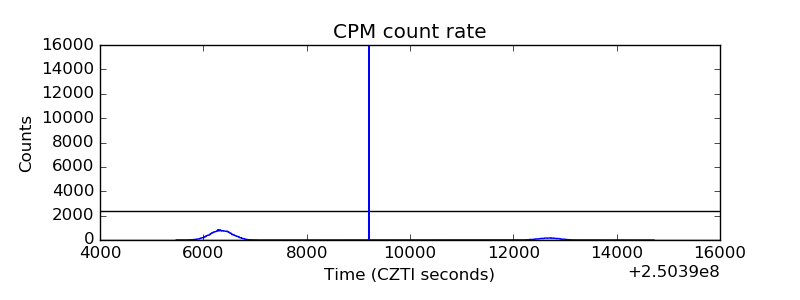 |
| CZT Counter | 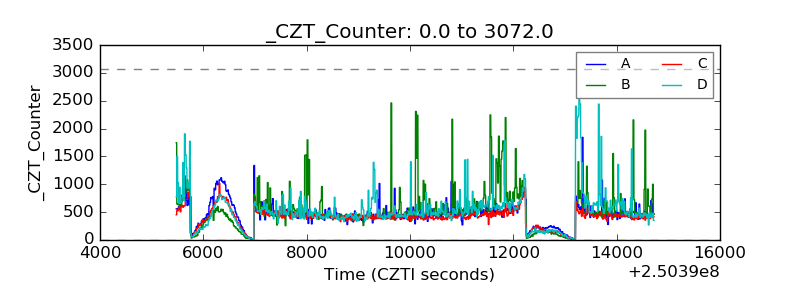 |
| +2.5 Volts monitor |  |
| +5 Volts monitor |  |
| _ROLL_ROT | 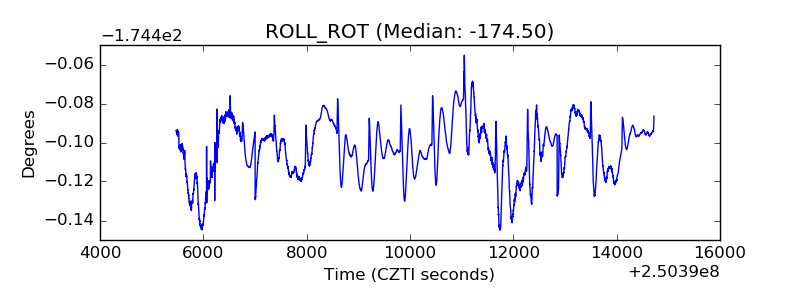 |
| _Roll_DEC | 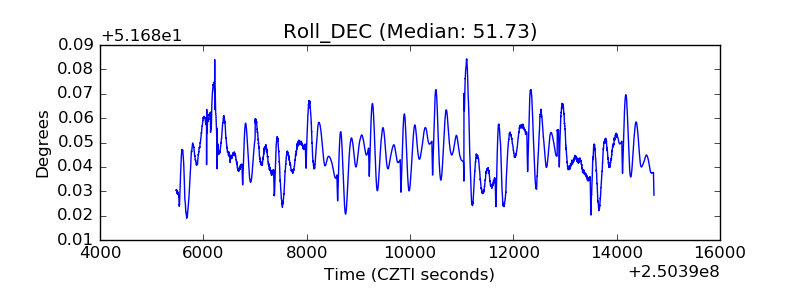 |
| _Roll_RA | 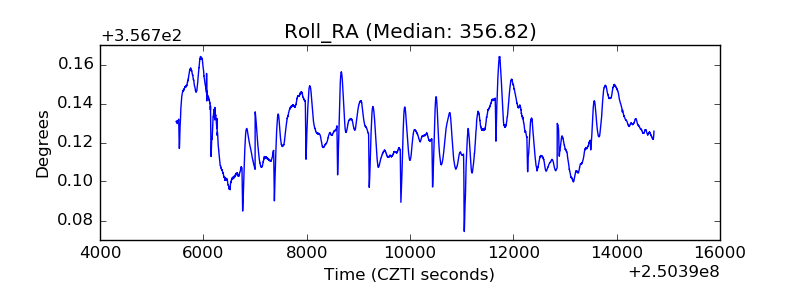 |
| Veto Counter | 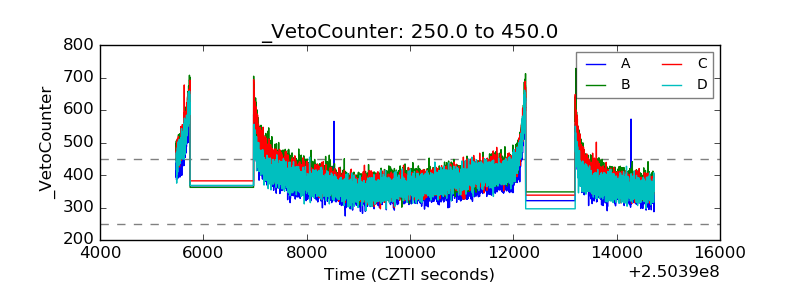 |