| Param | Original file | Final file |
|---|---|---|
| Filename | modeM0/AS1A04_049T01_9000001754_11872cztM0_level2.evt | modeM0/AS1A04_049T01_9000001754_11872cztM0_level2_quad_clean.evt |
| Size (bytes) | 525,438,720 | 79,945,920 |
| Size | 501.1 MB | 76.2 MB |
| Events in quadrant A | 3,576,104 | 486,613 |
| Events in quadrant B | 4,474,931 | 482,022 |
| Events in quadrant C | 3,151,907 | 490,176 |
| Events in quadrant D | 4,226,319 | 465,722 |
| Mode M0 | |||
|---|---|---|---|
| Quadrant | BADHDUFLAG | Total packets | Discarded packets |
| A | 0 | 15295 | 3 |
| B | 0 | 18054 | 2 |
| C | 0 | 14534 | 2 |
| D | 0 | 17354 | 2 |
| Mode SS | |||
|---|---|---|---|
| Quadrant | BADHDUFLAG | Total packets | Discarded packets |
| A | 0 | 146 | 0 |
| B | 0 | 146 | 0 |
| C | 0 | 146 | 0 |
| D | 0 | 146 | 0 |
| Mode M9 | |||
|---|---|---|---|
| Quadrant | BADHDUFLAG | Total packets | Discarded packets |
| A | 0 | 4 | 0 |
| B | 0 | 4 | 0 |
| C | 0 | 4 | 0 |
| D | 0 | 4 | 0 |
| Quadrant | Total seconds | Saturated seconds | Saturation percentage |
|---|---|---|---|
| A | 7118 | 155 | 2.177578% |
| B | 7118 | 364 | 5.113796% |
| C | 7118 | 83 | 1.166058% |
| D | 7118 | 200 | 2.809778% |
Noise dominated data is calculated using 1-second bins in cleaned event files. If a bin has >2000 counts, and if more than 50% of those come from <1% of pixels, then it is considered to be noise-dominated and hence unusable.
| Quadrant | # 1 sec bins | Bins with >0 counts | Bins with >2000 counts | High rate bins dominated by noise | Noise dominated (total time) | Noise dominated (detector-on time) | Marked lightcurve |
|---|---|---|---|---|---|---|---|
| A | 7554 | 7120 | 1 | 1 | 0.01% | 0.01% | 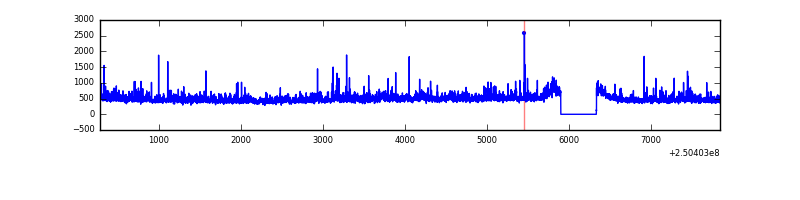 |
| B | 7554 | 7120 | 121 | 121 | 1.60% | 1.70% | 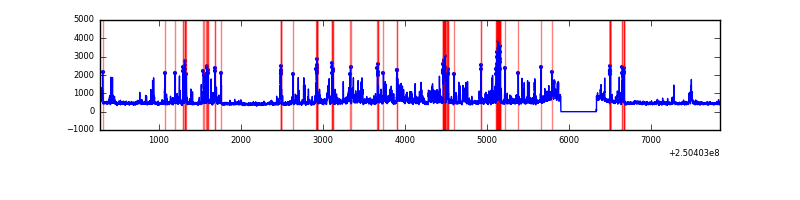 |
| C | 7554 | 7120 | 0 | 0 | 0.00% | 0.00% | 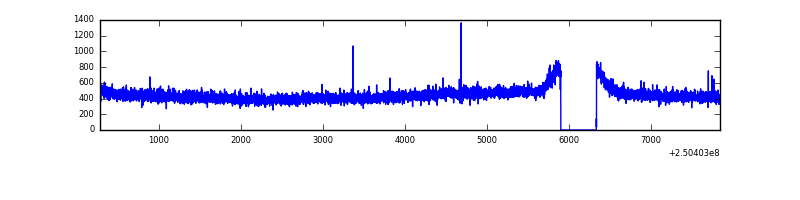 |
| D | 7554 | 7120 | 109 | 109 | 1.44% | 1.53% |  |
Top three noisy pixels from each quadrant. If the there are fewer than three noisy pixels in the level2.evt file, extra rows are filled as -1
| Pixel properties | Quadrant properties | ||||||
|---|---|---|---|---|---|---|---|
| Quadrant | DetID | PixID | Counts | Sigma | Mean | Median | Sigma |
| A | 1 | 162 | 140428 | 838.78 | 818 | 798 | 166.5 |
| A | 1 | 178 | 72917 | 433.23 | 818 | 798 | 166.5 |
| A | 1 | 161 | 63845 | 378.73 | 818 | 798 | 166.5 |
| B | 4 | 239 | 691023 | 4479.98 | 813 | 791 | 154.1 |
| B | 15 | 185 | 271695 | 1758.31 | 813 | 791 | 154.1 |
| B | 3 | 64 | 161313 | 1041.87 | 813 | 791 | 154.1 |
| C | 13 | 61 | 5945 | 27.54 | 805 | 807 | 186.6 |
| C | 8 | 128 | 4135 | 17.84 | 805 | 807 | 186.6 |
| C | 8 | 222 | 3852 | 16.32 | 805 | 807 | 186.6 |
| D | 8 | 195 | 356785 | 1886.58 | 789 | 764 | 188.7 |
| D | 1 | 52 | 318534 | 1683.88 | 789 | 764 | 188.7 |
| D | 13 | 122 | 212934 | 1124.3 | 789 | 764 | 188.7 |
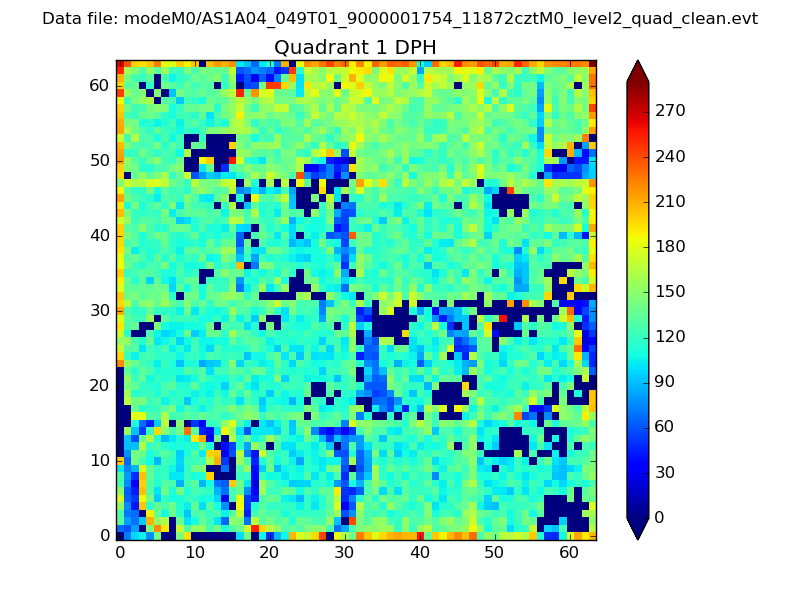
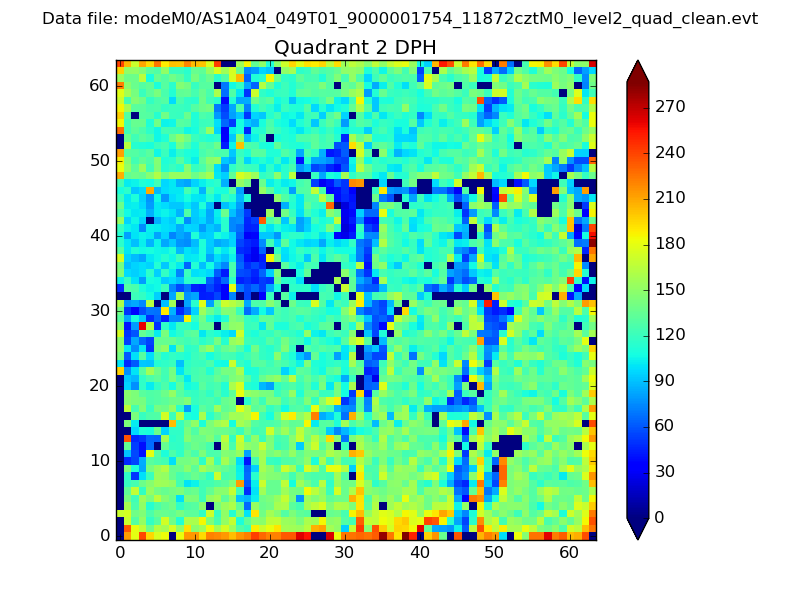
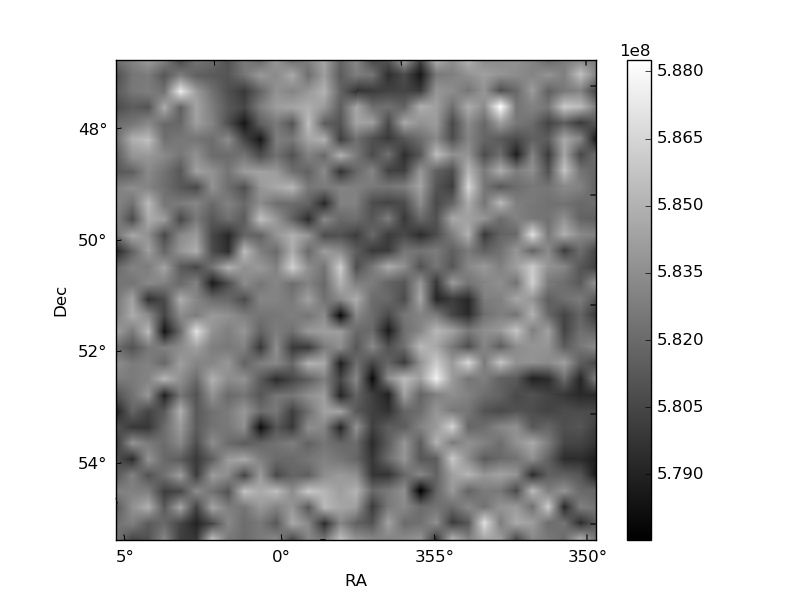
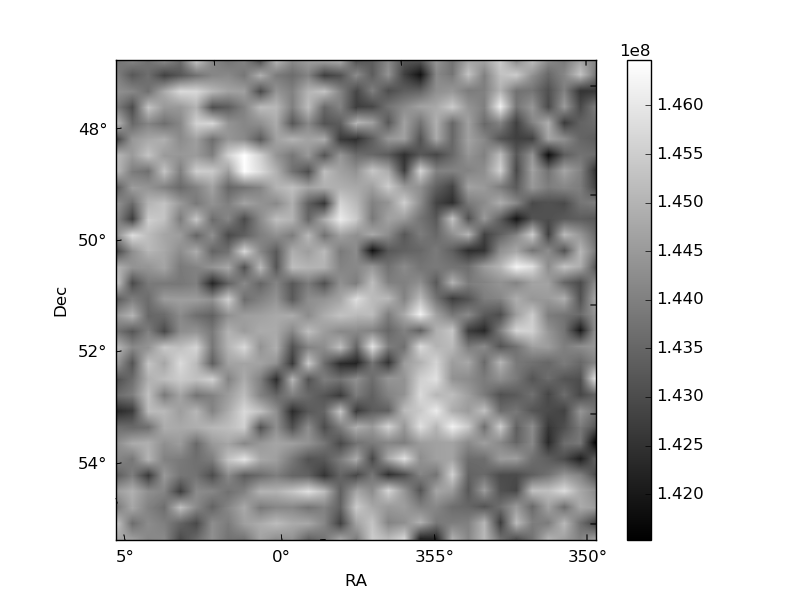
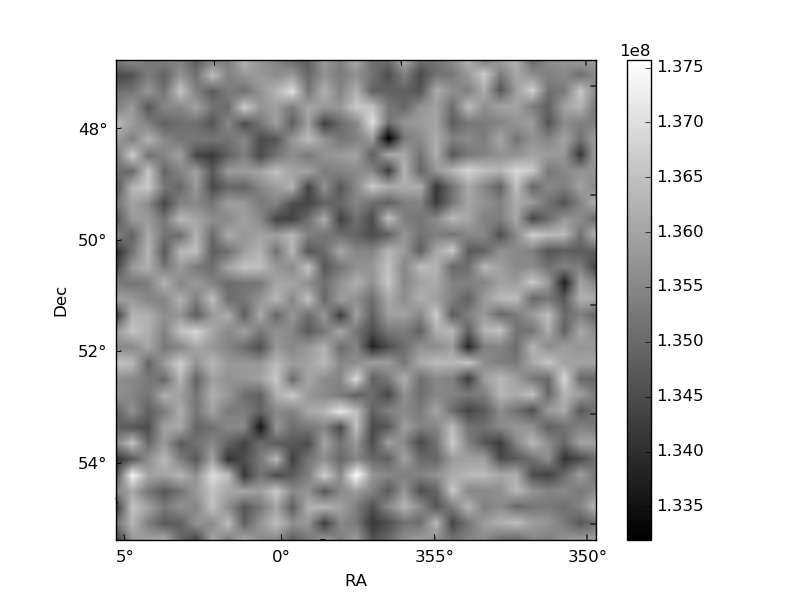
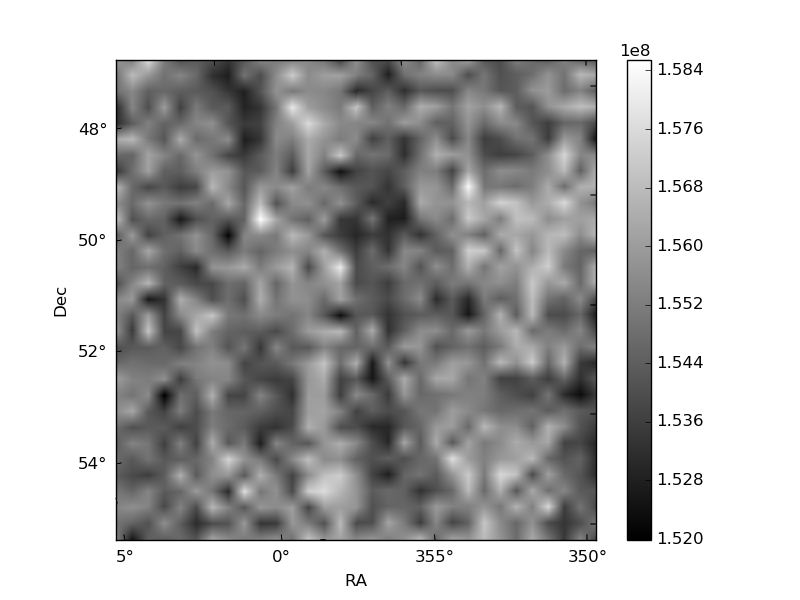
Histogram calculated using DETX and DETY for each event in the final _common_clean file
| Quadrant A | 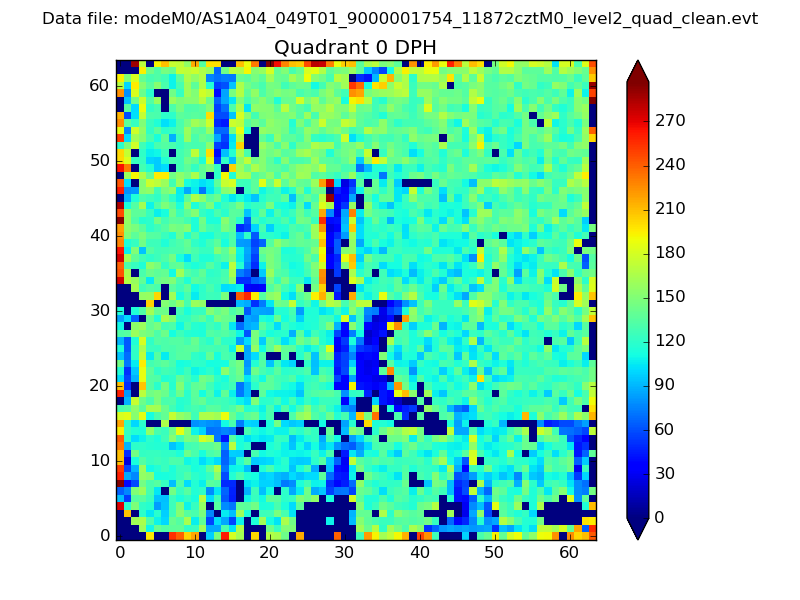 |
 |
Quadrant B |
|---|---|---|---|
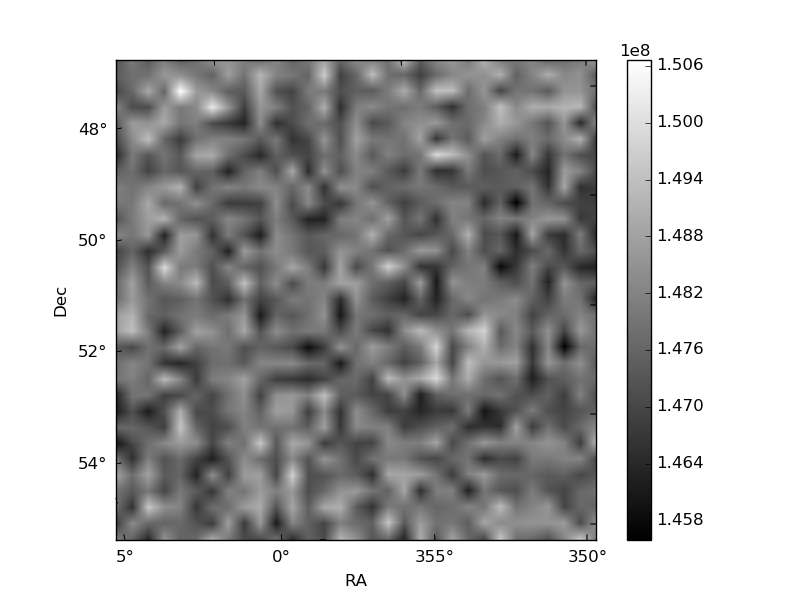
| Quadrant D | 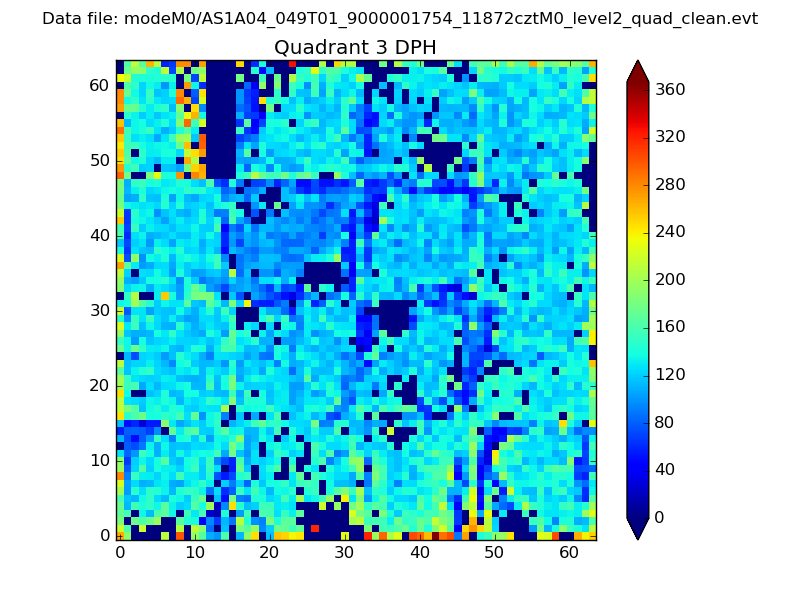 |
 |
Quadrant C |
| Plot type | Count rate plots | Images |
|---|---|---|
| Comparison with Poisson distribution Blue bars denote a histogram of data divided into 1 sec bins. Red curve is a Poisson curve with rate = median count rate of data. |
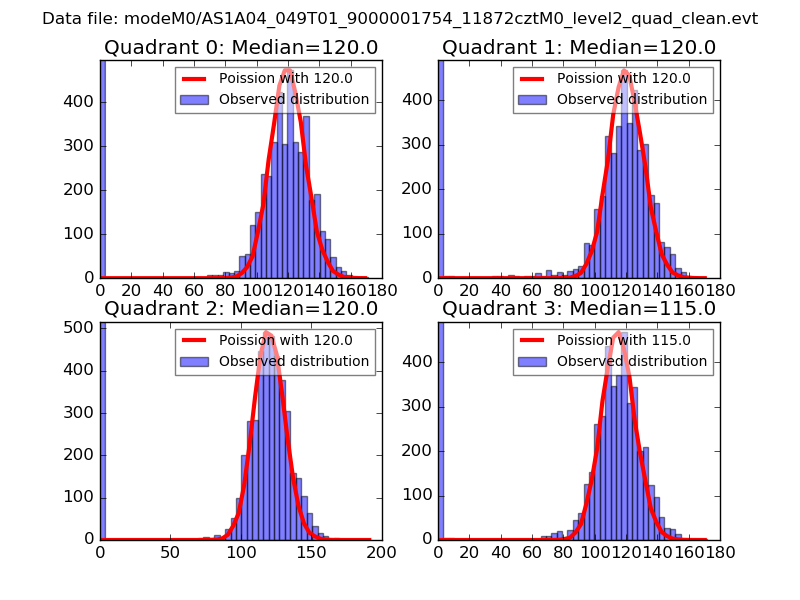 |
 |
| Quadrant-wise count rates Data is divided into 100 sec bins |
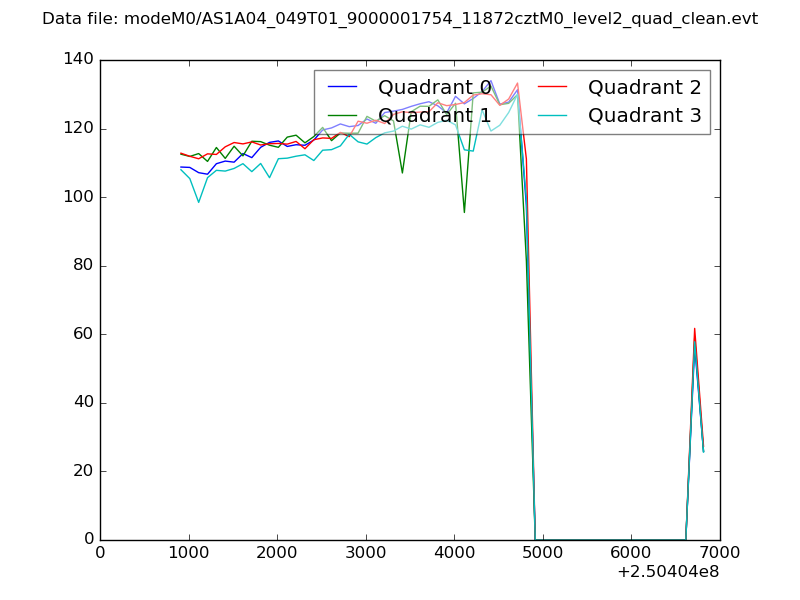 |
|
| Module-wise count rates for Quadrant A Data is divided into 100 sec bins |
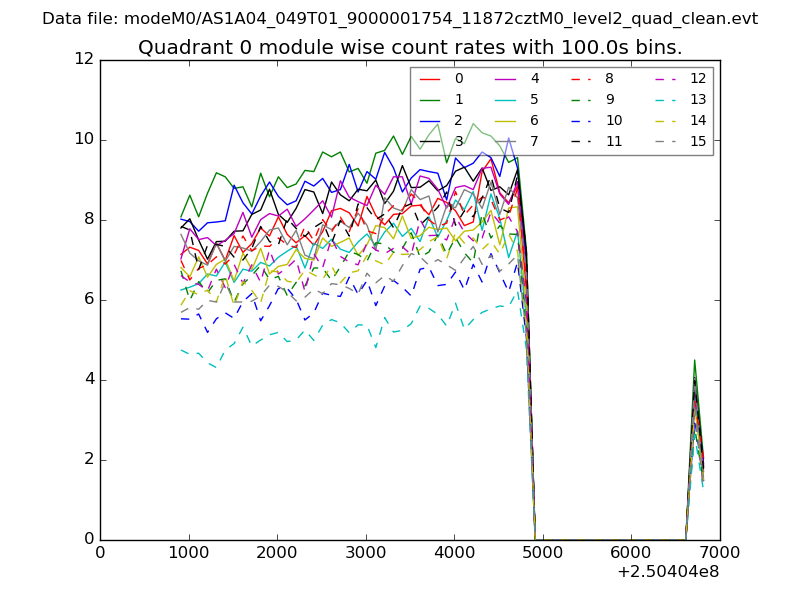 |
 |
| Module-wise count rates for Quadrant B Data is divided into 100 sec bins |
 |
 |
| Module-wise count rates for Quadrant C Data is divided into 100 sec bins |
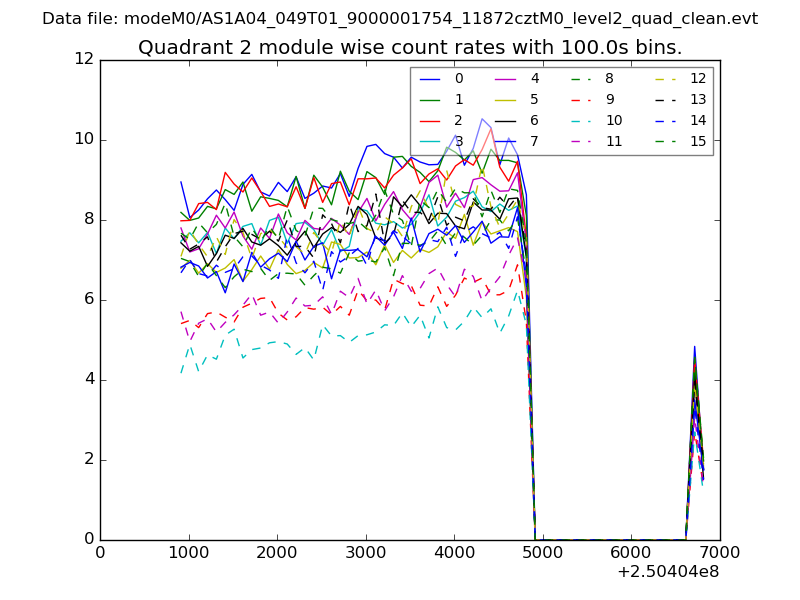 |
 |
| Module-wise count rates for Quadrant D Data is divided into 100 sec bins |
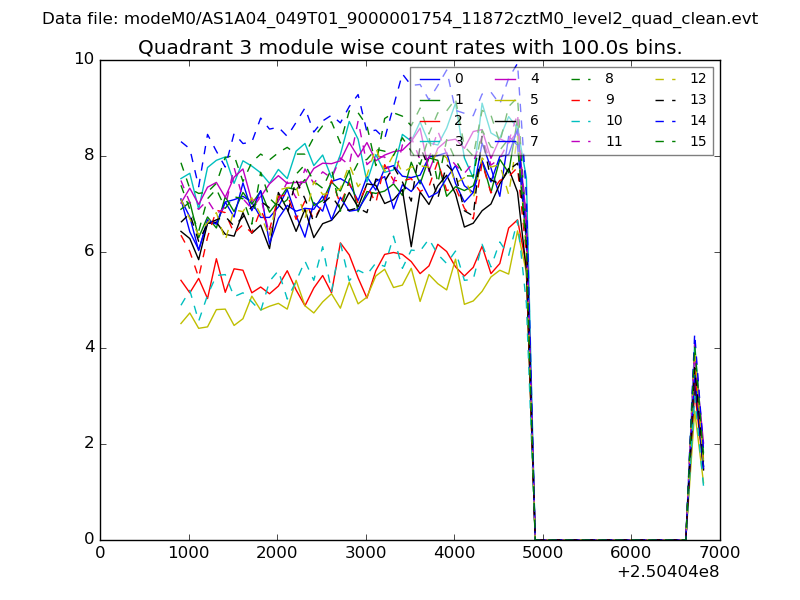 |
 |
| Parameter | Plot |
|---|---|
| CZT HV Monitor | 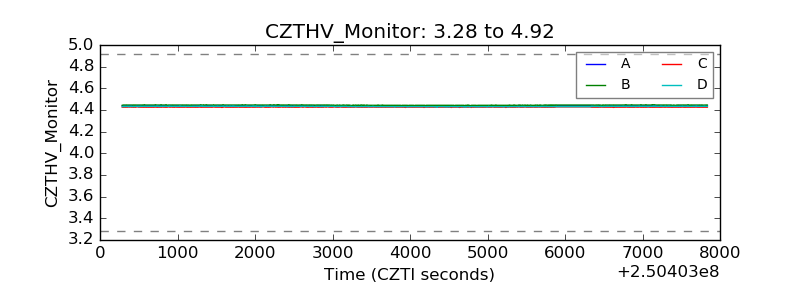 |
| D_VDD | 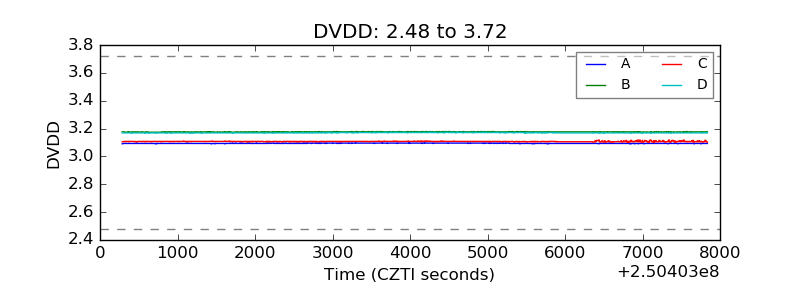 |
| Temperature 1 | 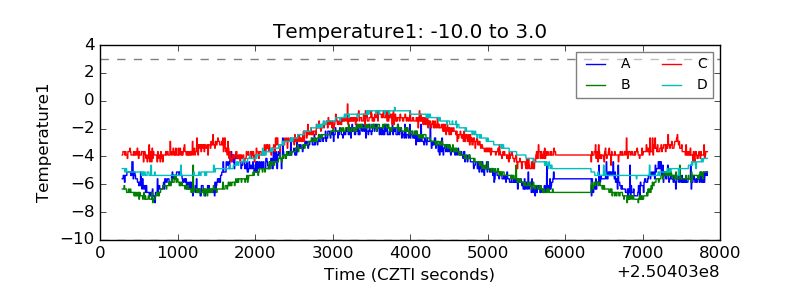 |
| Veto HV Monitor | 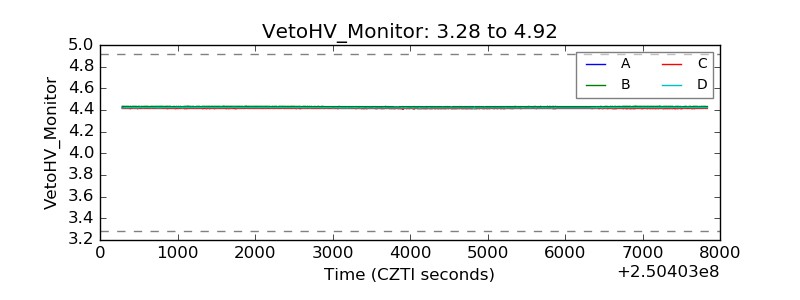 |
| Veto LLD | 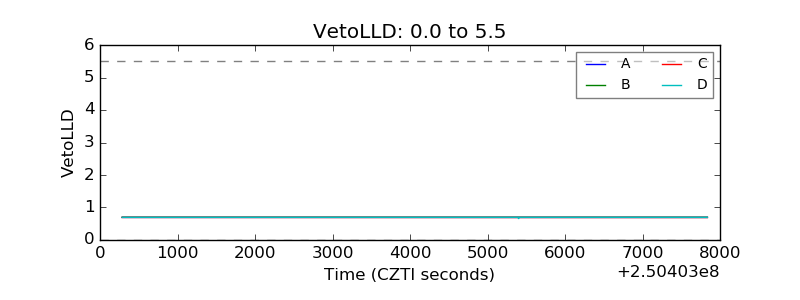 |
| Alpha Counter | 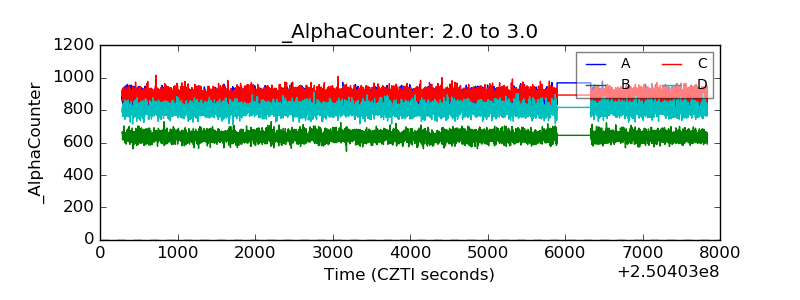 |
| _CPM_Rate | 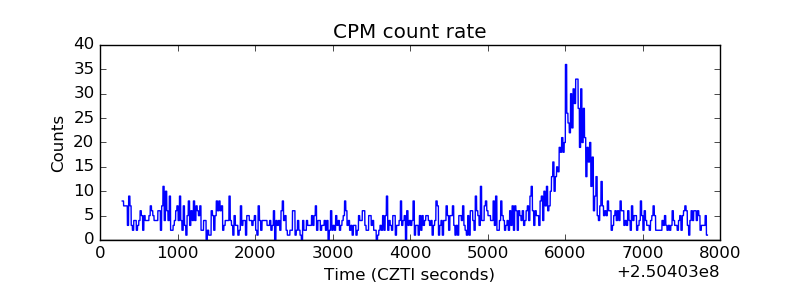 |
| CZT Counter | 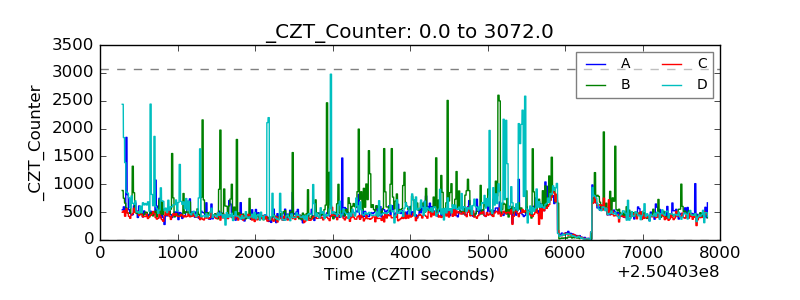 |
| +2.5 Volts monitor |  |
| +5 Volts monitor |  |
| _ROLL_ROT | 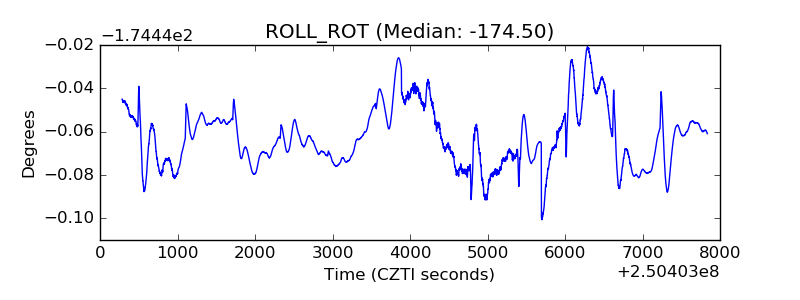 |
| _Roll_DEC | 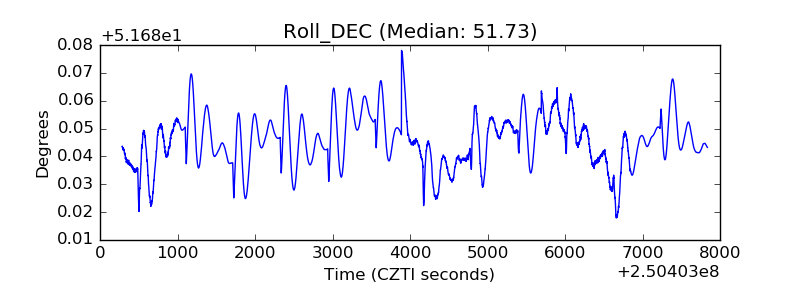 |
| _Roll_RA | 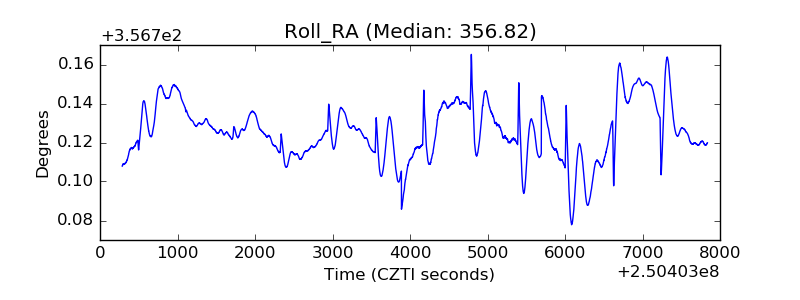 |
| Veto Counter | 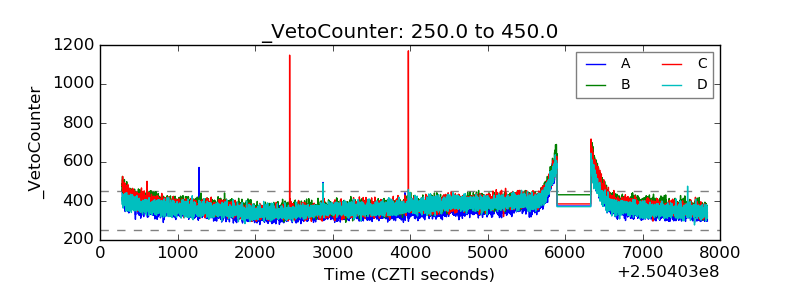 |