| Param | Original file | Final file |
|---|---|---|
| Filename | modeM0/AS1A04_049T01_9000001754_11873cztM0_level2.evt | modeM0/AS1A04_049T01_9000001754_11873cztM0_level2_quad_clean.evt |
| Size (bytes) | 209,093,760 | 29,862,720 |
| Size | 199.4 MB | 28.5 MB |
| Events in quadrant A | 1,475,102 | 172,906 |
| Events in quadrant B | 1,712,167 | 174,539 |
| Events in quadrant C | 1,343,215 | 178,414 |
| Events in quadrant D | 1,599,570 | 167,796 |
| Mode M0 | |||
|---|---|---|---|
| Quadrant | BADHDUFLAG | Total packets | Discarded packets |
| A | 0 | 6412 | 1 |
| B | 0 | 7087 | 1 |
| C | 0 | 6171 | 1 |
| D | 0 | 6665 | 1 |
| Mode SS | |||
|---|---|---|---|
| Quadrant | BADHDUFLAG | Total packets | Discarded packets |
| A | 0 | 62 | 0 |
| B | 0 | 62 | 0 |
| C | 0 | 62 | 0 |
| D | 0 | 62 | 0 |
| Mode M9 | |||
|---|---|---|---|
| Quadrant | BADHDUFLAG | Total packets | Discarded packets |
| A | 0 | 4 | 0 |
| B | 0 | 4 | 0 |
| C | 0 | 4 | 0 |
| D | 0 | 4 | 0 |
| Quadrant | Total seconds | Saturated seconds | Saturation percentage |
|---|---|---|---|
| A | 2941 | 148 | 5.032302% |
| B | 2941 | 221 | 7.514451% |
| C | 2941 | 81 | 2.754165% |
| D | 2941 | 105 | 3.570214% |
Noise dominated data is calculated using 1-second bins in cleaned event files. If a bin has >2000 counts, and if more than 50% of those come from <1% of pixels, then it is considered to be noise-dominated and hence unusable.
| Quadrant | # 1 sec bins | Bins with >0 counts | Bins with >2000 counts | High rate bins dominated by noise | Noise dominated (total time) | Noise dominated (detector-on time) | Marked lightcurve |
|---|---|---|---|---|---|---|---|
| A | 3377 | 2943 | 2 | 2 | 0.06% | 0.07% | 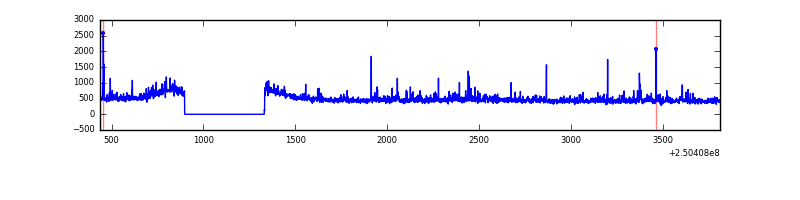 |
| B | 3377 | 2943 | 29 | 29 | 0.86% | 0.99% | 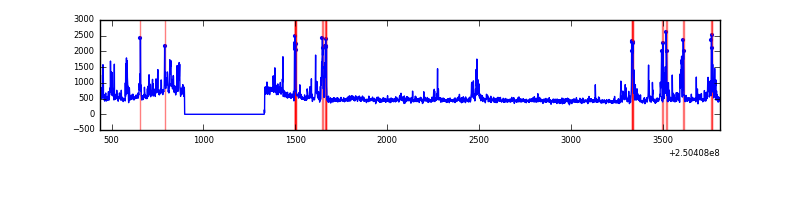 |
| C | 3377 | 2943 | 0 | 0 | 0.00% | 0.00% | 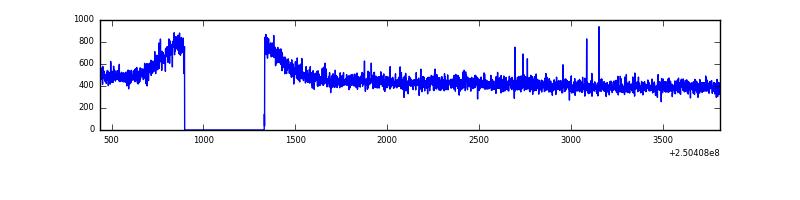 |
| D | 3377 | 2943 | 23 | 23 | 0.68% | 0.78% | 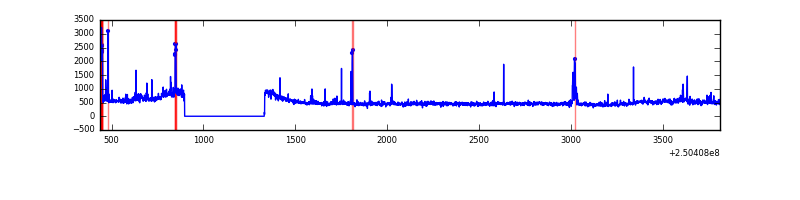 |
Top three noisy pixels from each quadrant. If the there are fewer than three noisy pixels in the level2.evt file, extra rows are filled as -1
| Pixel properties | Quadrant properties | ||||||
|---|---|---|---|---|---|---|---|
| Quadrant | DetID | PixID | Counts | Sigma | Mean | Median | Sigma |
| A | 1 | 162 | 54423 | 753.2 | 346 | 338 | 71.8 |
| A | 1 | 178 | 26209 | 360.29 | 346 | 338 | 71.8 |
| A | 1 | 161 | 23233 | 318.84 | 346 | 338 | 71.8 |
| B | 4 | 239 | 260270 | 3805.14 | 345 | 336 | 68.3 |
| B | 3 | 64 | 44752 | 650.2 | 345 | 336 | 68.3 |
| B | 0 | 214 | 17782 | 255.39 | 345 | 336 | 68.3 |
| C | 8 | 128 | 5235 | 60.92 | 341 | 341 | 80.3 |
| C | 8 | 112 | 2819 | 30.85 | 341 | 341 | 80.3 |
| C | 13 | 61 | 2540 | 27.38 | 341 | 341 | 80.3 |
| D | 8 | 195 | 140095 | 1696.24 | 335 | 322 | 82.4 |
| D | 1 | 52 | 85587 | 1034.75 | 335 | 322 | 82.4 |
| D | 12 | 233 | 45507 | 548.35 | 335 | 322 | 82.4 |
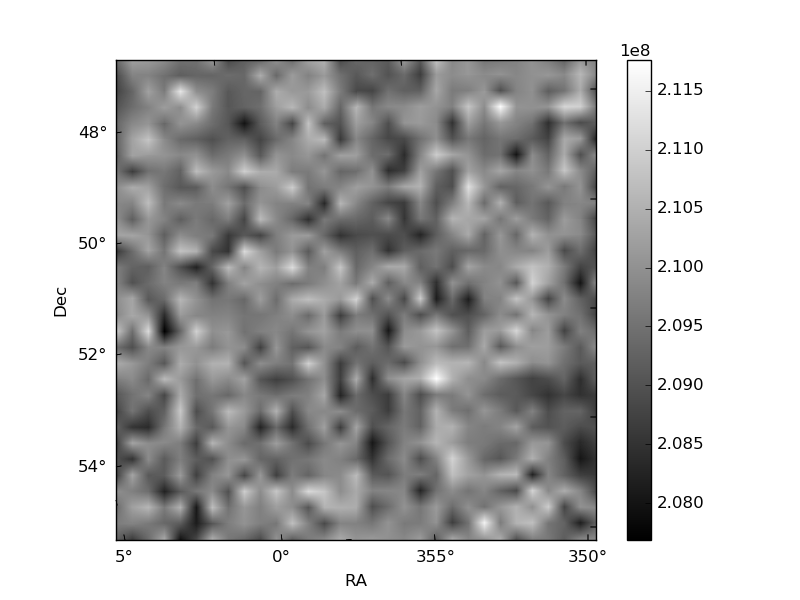
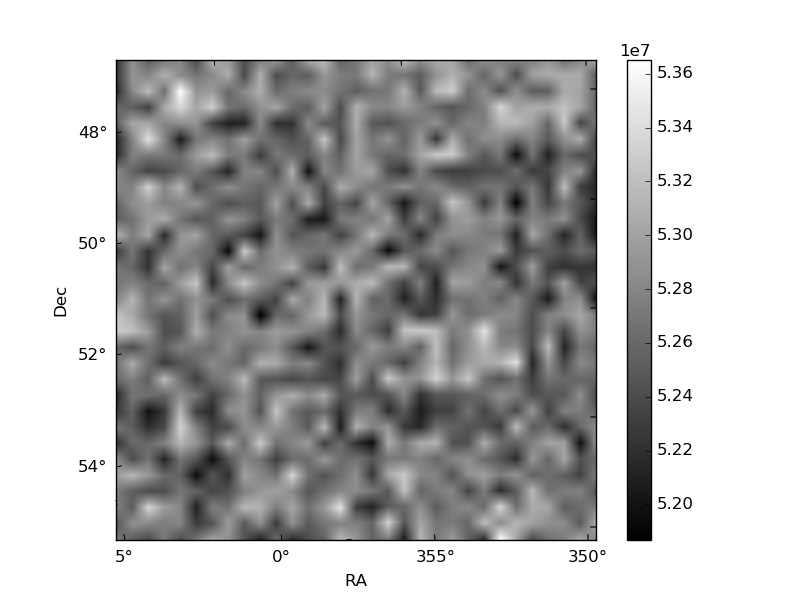
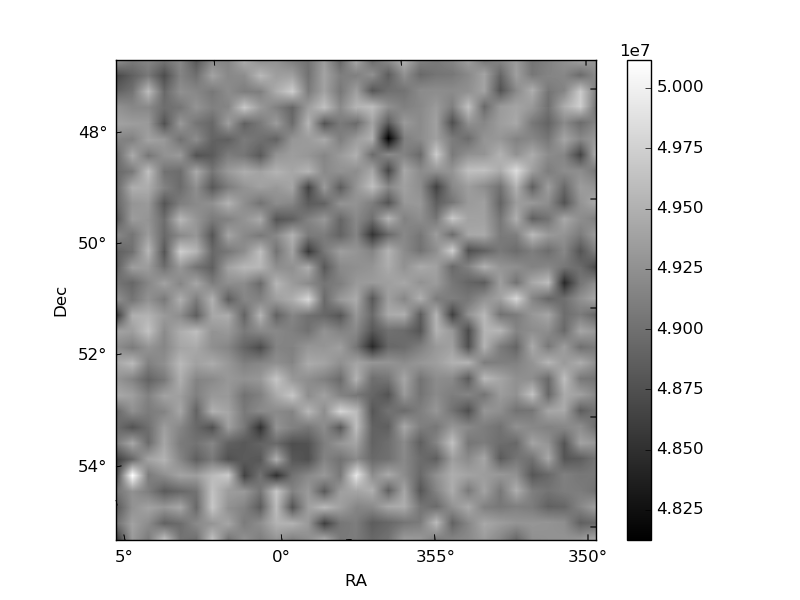
Histogram calculated using DETX and DETY for each event in the final _common_clean file
| Quadrant A | 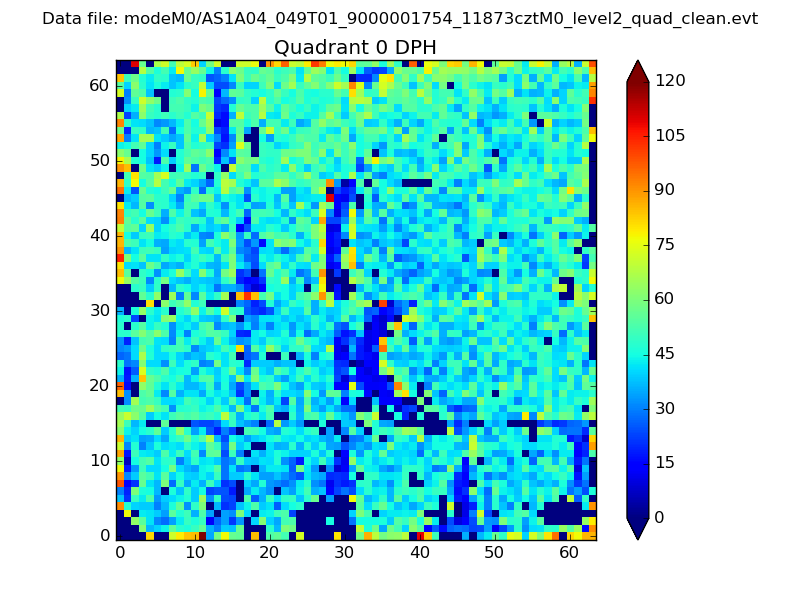 |
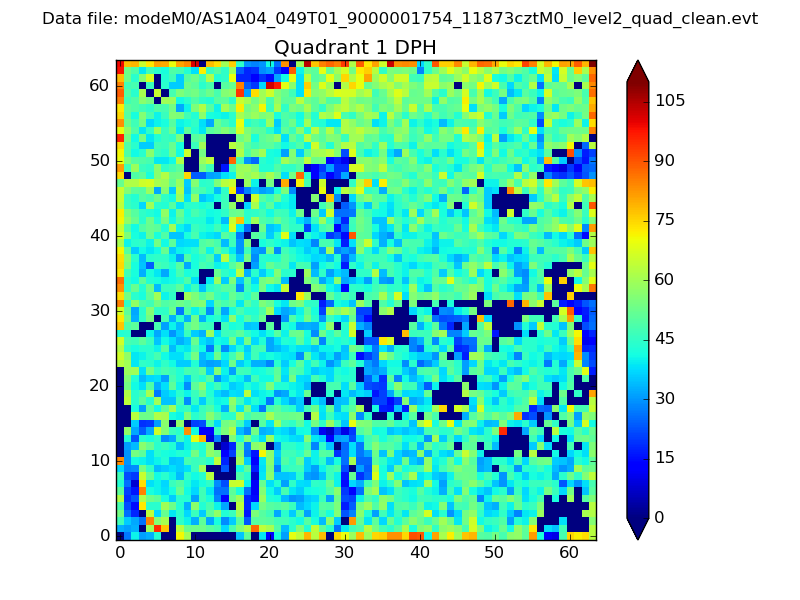 |
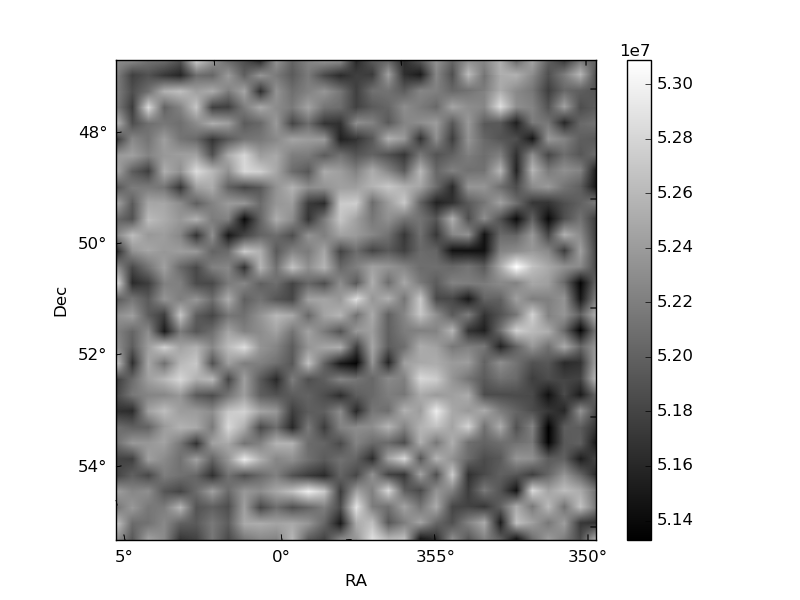
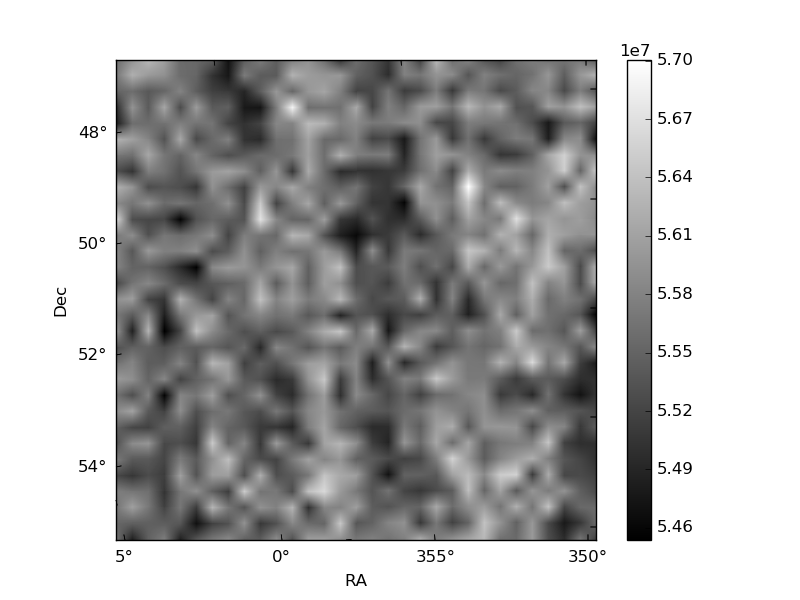
Quadrant B |
|---|---|---|---|
| Quadrant D | 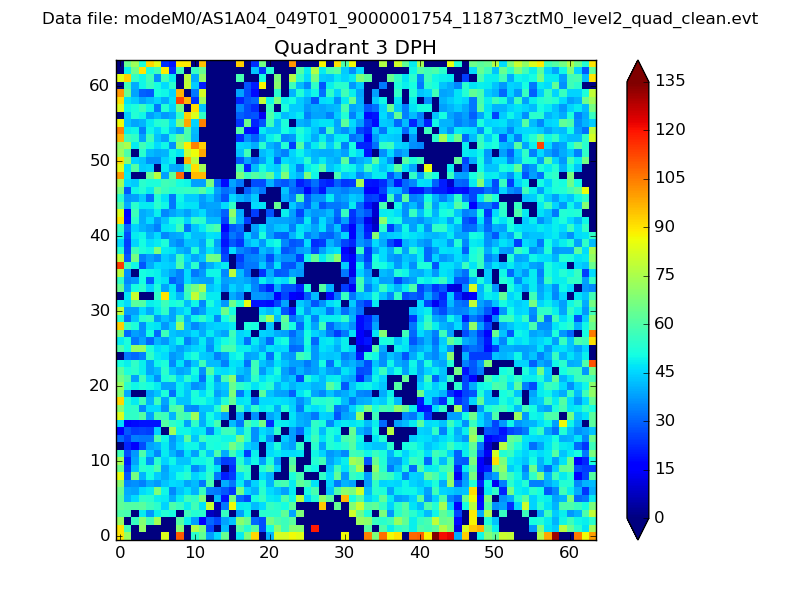 |
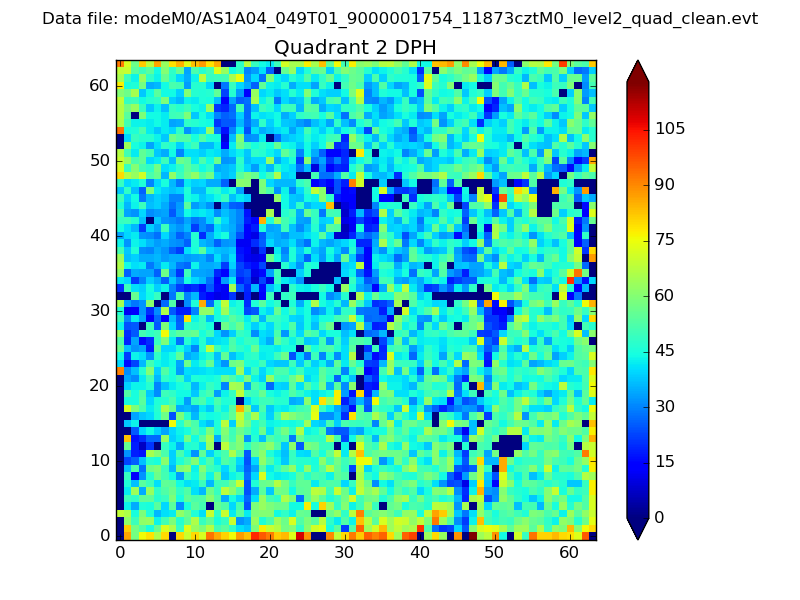 |
Quadrant C |
| Plot type | Count rate plots | Images |
|---|---|---|
| Comparison with Poisson distribution Blue bars denote a histogram of data divided into 1 sec bins. Red curve is a Poisson curve with rate = median count rate of data. |
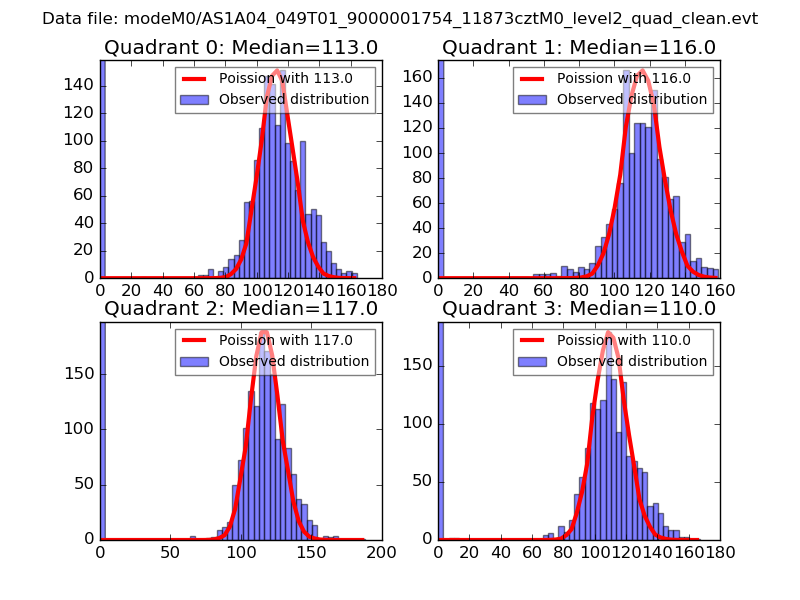 |
 |
| Quadrant-wise count rates Data is divided into 100 sec bins |
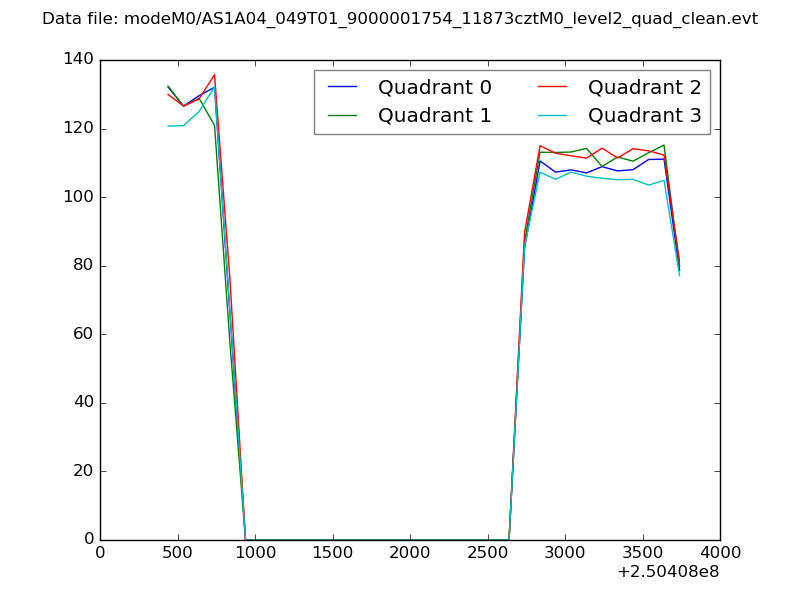 |
|
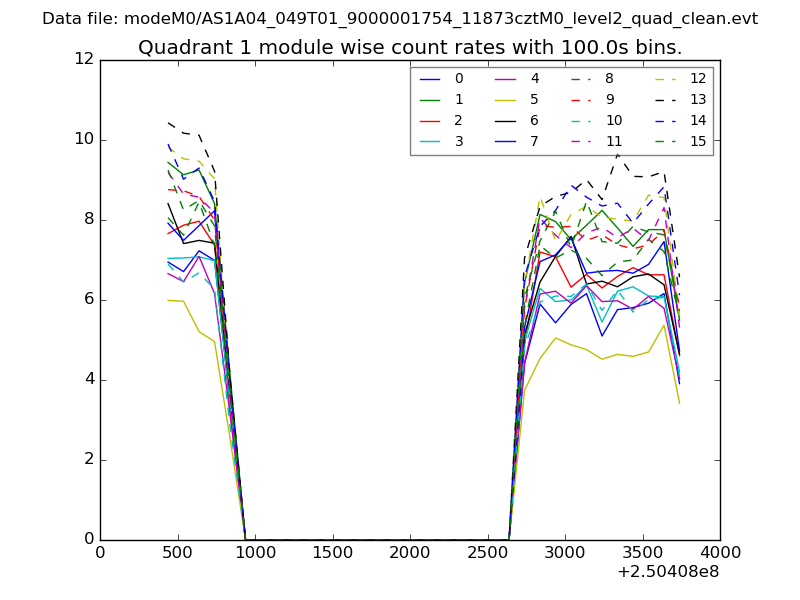
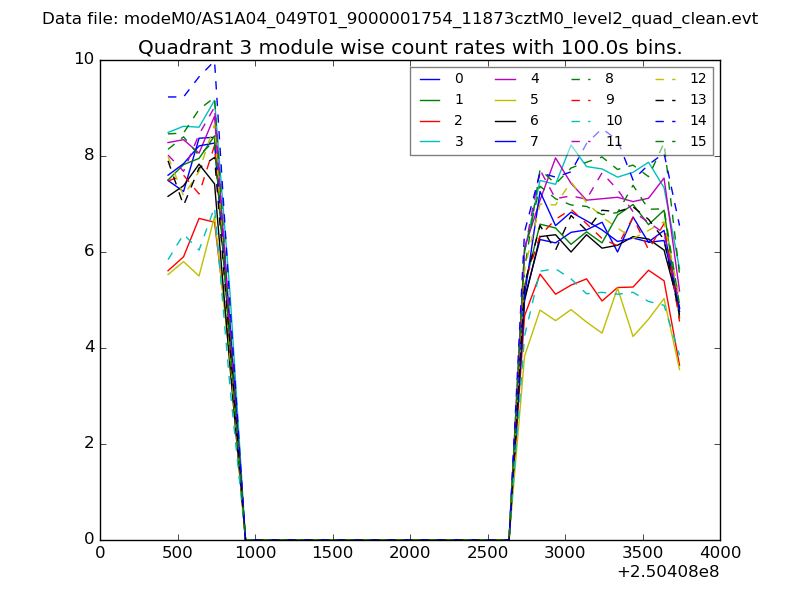
| Module-wise count rates for Quadrant A Data is divided into 100 sec bins |
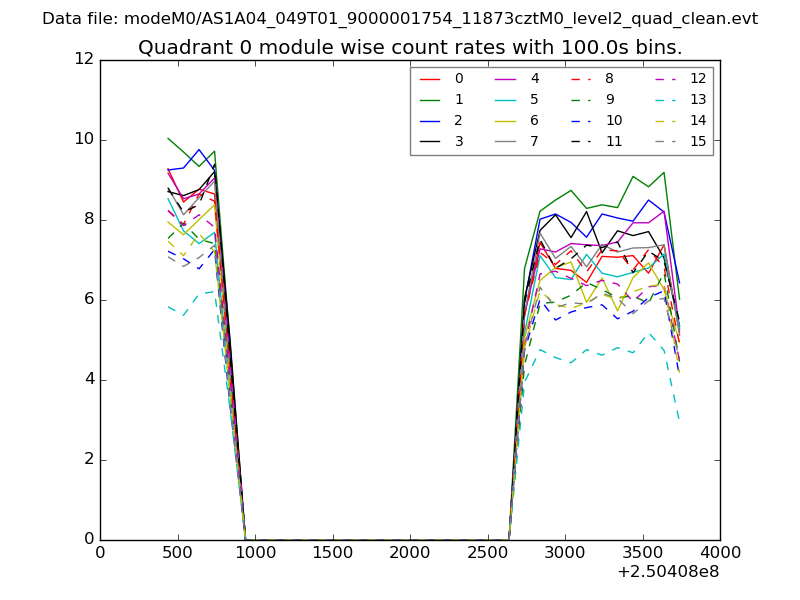 |
 |
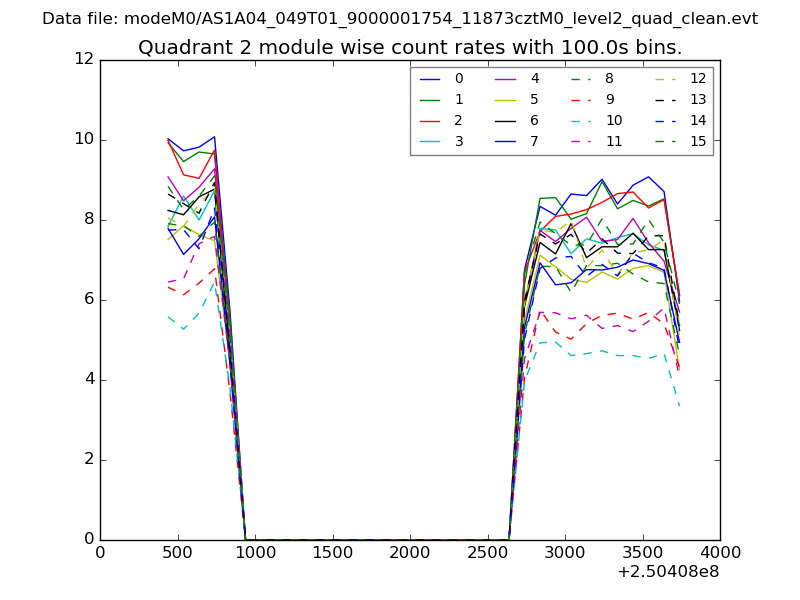
| Module-wise count rates for Quadrant B Data is divided into 100 sec bins |
 |
 |
| Module-wise count rates for Quadrant C Data is divided into 100 sec bins |
 |
 |
| Module-wise count rates for Quadrant D Data is divided into 100 sec bins |
 |
 |
| Parameter | Plot |
|---|---|
| CZT HV Monitor | 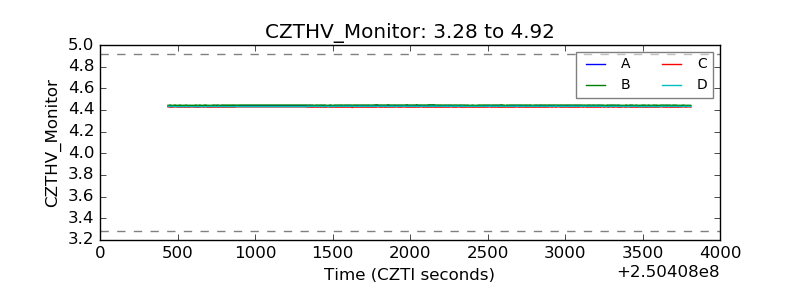 |
| D_VDD | 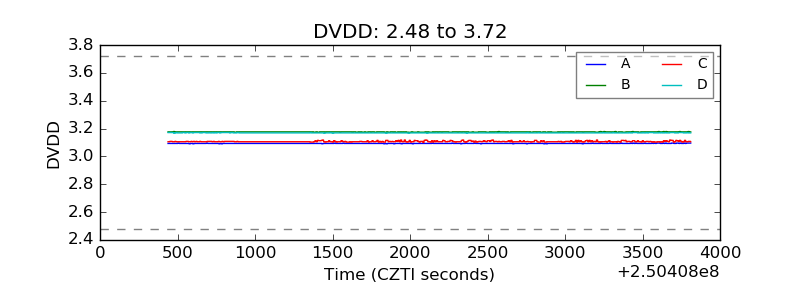 |
| Temperature 1 | 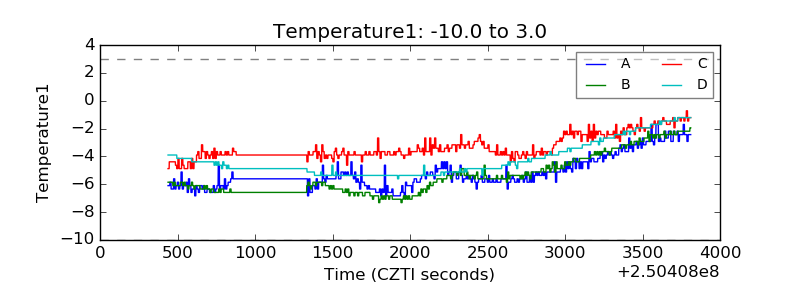 |
| Veto HV Monitor |  |
| Veto LLD | 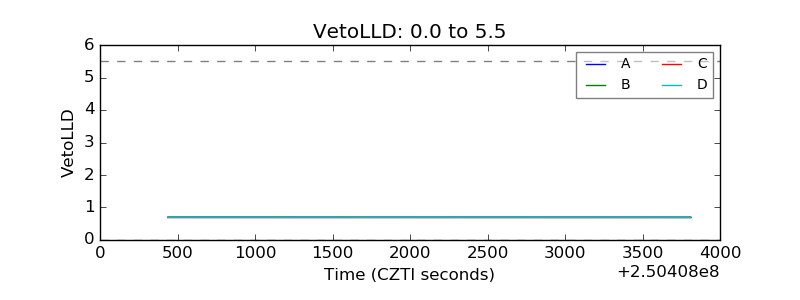 |
| Alpha Counter | 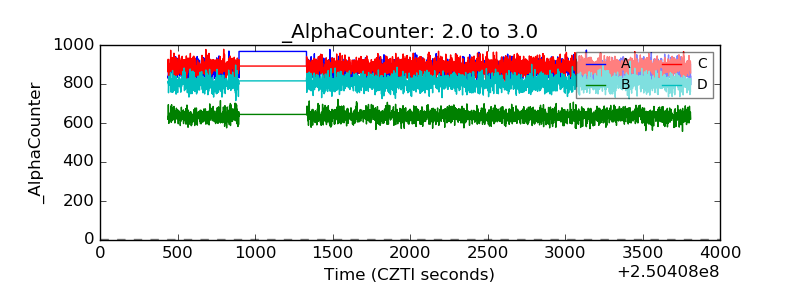 |
| _CPM_Rate | 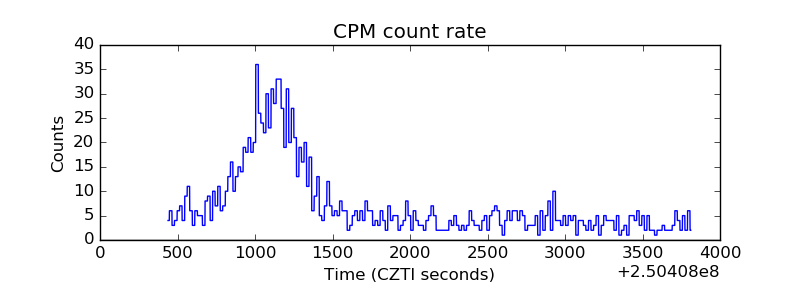 |
| CZT Counter | 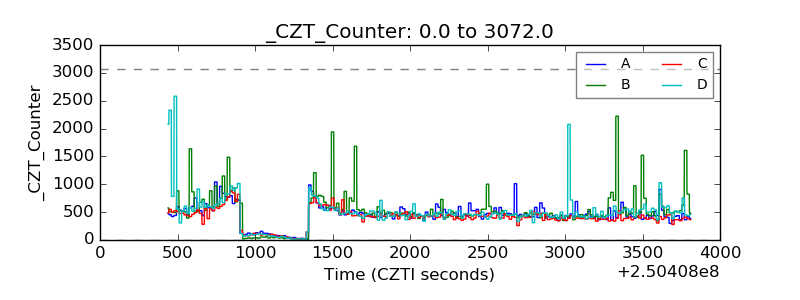 |
| +2.5 Volts monitor |  |
| +5 Volts monitor | 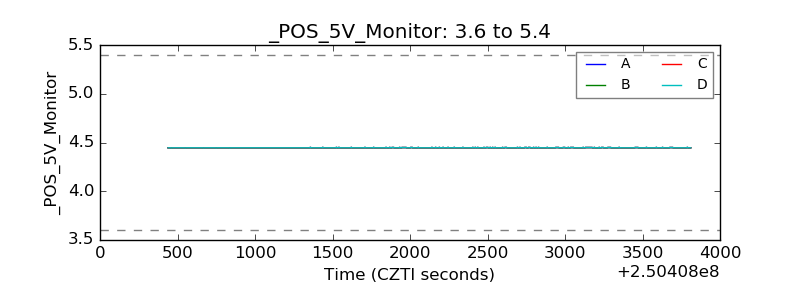 |
| _ROLL_ROT | 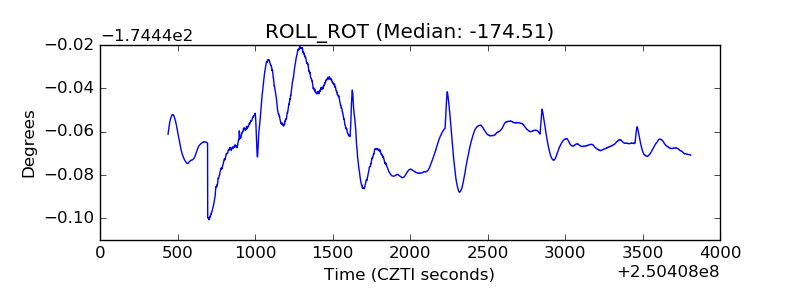 |
| _Roll_DEC | 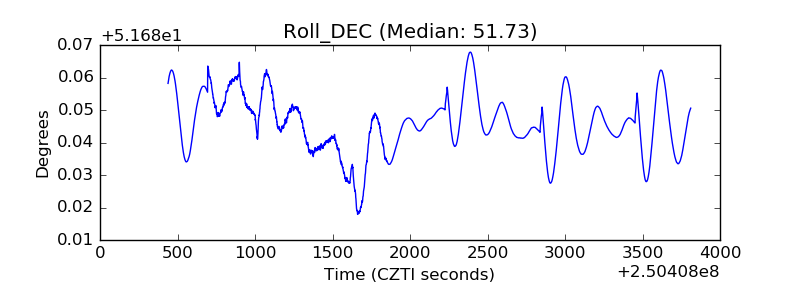 |
| _Roll_RA | 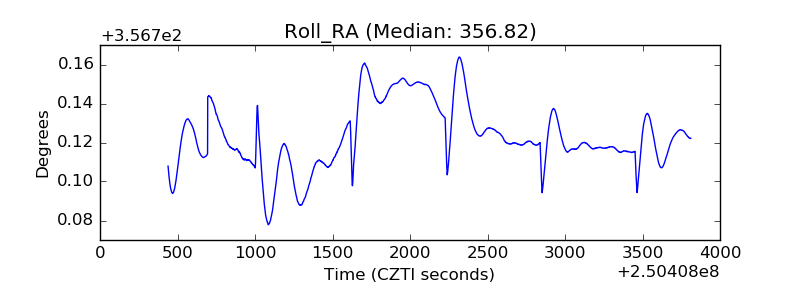 |
| Veto Counter | 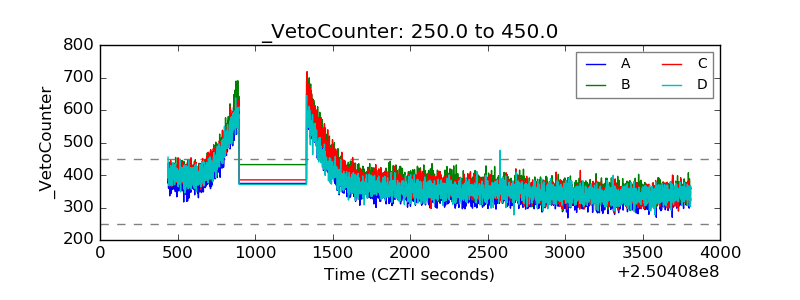 |