| Param | Original file | Final file |
|---|---|---|
| Filename | modeM0/AS1G08_048T01_9000001752cztM0_level2.fits | modeM0/AS1G08_048T01_9000001752cztM0_level2_quad_clean.evt |
| Size (bytes) | 226,195,200 | 182,289,600 |
| Size | 215.7 MB | 173.8 MB |
| Events in quadrant A | 1,362,478 | 1,027,241 |
| Events in quadrant B | 1,300,664 | 988,347 |
| Events in quadrant C | 1,359,680 | 957,945 |
| Events in quadrant D | 1,160,968 | 879,453 |
| Mode M0 | |||
|---|---|---|---|
| Quadrant | BADHDUFLAG | Total packets | Discarded packets |
| A | 0 | 51985 | 0 |
| B | 0 | 61239 | 0 |
| C | 0 | 49268 | 0 |
| D | 0 | 56833 | 0 |
| Mode SS | |||
|---|---|---|---|
| Quadrant | BADHDUFLAG | Total packets | Discarded packets |
| A | 0 | 494 | 0 |
| B | 0 | 494 | 0 |
| C | 0 | 494 | 0 |
| D | 0 | 494 | 0 |
| Mode M9 | |||
|---|---|---|---|
| Quadrant | BADHDUFLAG | Total packets | Discarded packets |
| A | 0 | 50 | 0 |
| B | 0 | 50 | 0 |
| C | 0 | 50 | 0 |
| D | 0 | 50 | 0 |
| Quadrant | Total seconds | Saturated seconds | Saturation percentage |
|---|---|---|---|
| A | 24221 | 235 | 0.970232% |
| B | 24221 | 1281 | 5.288799% |
| C | 24221 | 84 | 0.346806% |
| D | 24221 | 403 | 1.663845% |
Noise dominated data is calculated using 1-second bins in cleaned event files. If a bin has >2000 counts, and if more than 50% of those come from <1% of pixels, then it is considered to be noise-dominated and hence unusable.
| Quadrant | # 1 sec bins | Bins with >0 counts | Bins with >2000 counts | High rate bins dominated by noise | Noise dominated (total time) | Noise dominated (detector-on time) | Marked lightcurve |
|---|---|---|---|---|---|---|---|
| A | 29261 | 24220 | 0 | 0 | 0.00% | 0.00% |  |
| B | 29261 | 24188 | 0 | 0 | 0.00% | 0.00% |  |
| C | 29261 | 24221 | 0 | 0 | 0.00% | 0.00% |  |
| D | 29261 | 24220 | 0 | 0 | 0.00% | 0.00% |  |
Top three noisy pixels from each quadrant. If the there are fewer than three noisy pixels in the level2.evt file, extra rows are filled as -1
| Pixel properties | Quadrant properties | ||||||
|---|---|---|---|---|---|---|---|
| Quadrant | DetID | PixID | Counts | Sigma | Mean | Median | Sigma |
| A | 0 | 29 | 1273 | 10.28 | 354 | 331 | 91.6 |
| A | 7 | 110 | 1191 | 9.39 | 354 | 331 | 91.6 |
| A | 9 | 19 | 1013 | 7.45 | 354 | 331 | 91.6 |
| B | 2 | 9 | 1134 | 11.35 | 342 | 325 | 71.3 |
| B | 12 | 226 | 875 | 7.71 | 342 | 325 | 71.3 |
| B | 5 | 232 | 851 | 7.38 | 342 | 325 | 71.3 |
| C | 1 | 80 | 1014 | 7.11 | 359 | 333 | 95.8 |
| C | 1 | 81 | 972 | 6.67 | 359 | 333 | 95.8 |
| C | 12 | 241 | 917 | 6.1 | 359 | 333 | 95.8 |
| D | 6 | 231 | 877 | 6.26 | 330 | 298 | 92.5 |
| D | 3 | 14 | 846 | 5.92 | 330 | 298 | 92.5 |
| D | 3 | 31 | 837 | 5.83 | 330 | 298 | 92.5 |
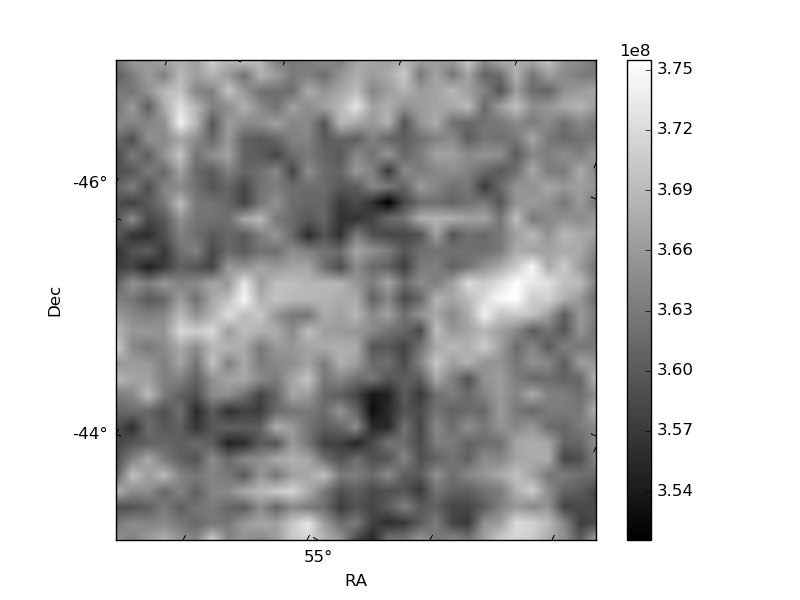
Histogram calculated using DETX and DETY for each event in the final _common_clean file
| Quadrant A |  |
 |
Quadrant B |
|---|---|---|---|
| Quadrant D |  |
 |
Quadrant C |
| Plot type | Count rate plots | Images |
|---|---|---|
| Comparison with Poisson distribution Blue bars denote a histogram of data divided into 1 sec bins. Red curve is a Poisson curve with rate = median count rate of data. |
 |
 |
| Quadrant-wise count rates Data is divided into 100 sec bins |
 |
|
| Module-wise count rates for Quadrant A Data is divided into 100 sec bins |
 |
 |
| Module-wise count rates for Quadrant B Data is divided into 100 sec bins |
 |
 |
| Module-wise count rates for Quadrant C Data is divided into 100 sec bins |
 |
 |
| Module-wise count rates for Quadrant D Data is divided into 100 sec bins |
 |
 |
| Parameter | Plot |
|---|---|
| CZT HV Monitor |  |
| D_VDD |  |
| Temperature 1 |  |
| Veto HV Monitor |  |
| Veto LLD |  |
| Alpha Counter |  |
| _CPM_Rate |  |
| CZT Counter |  |
| +2.5 Volts monitor |  |
| +5 Volts monitor |  |
| _ROLL_ROT |  |
| _Roll_DEC |  |
| _Roll_RA |  |
| Veto Counter |  |