| Param | Original file | Final file |
|---|---|---|
| Filename | modeM0/AS1G08_048T01_9000001752_11863cztM0_level2.evt | modeM0/AS1G08_048T01_9000001752_11863cztM0_level2_quad_clean.evt |
| Size (bytes) | 514,889,280 | 99,403,200 |
| Size | 491.0 MB | 94.8 MB |
| Events in quadrant A | 3,528,426 | 643,112 |
| Events in quadrant B | 4,331,720 | 635,485 |
| Events in quadrant C | 3,121,516 | 633,146 |
| Events in quadrant D | 4,133,495 | 607,694 |
| Mode M0 | |||
|---|---|---|---|
| Quadrant | BADHDUFLAG | Total packets | Discarded packets |
| A | 0 | 15122 | 3 |
| B | 0 | 17455 | 2 |
| C | 0 | 14300 | 2 |
| D | 0 | 16718 | 2 |
| Mode SS | |||
|---|---|---|---|
| Quadrant | BADHDUFLAG | Total packets | Discarded packets |
| A | 0 | 144 | 0 |
| B | 0 | 144 | 0 |
| C | 0 | 144 | 0 |
| D | 0 | 144 | 0 |
| Mode M9 | |||
|---|---|---|---|
| Quadrant | BADHDUFLAG | Total packets | Discarded packets |
| A | 0 | 8 | 0 |
| B | 0 | 8 | 0 |
| C | 0 | 8 | 0 |
| D | 0 | 8 | 0 |
| Quadrant | Total seconds | Saturated seconds | Saturation percentage |
|---|---|---|---|
| A | 7046 | 74 | 1.050241% |
| B | 7046 | 266 | 3.775192% |
| C | 7046 | 24 | 0.340619% |
| D | 7046 | 72 | 1.021856% |
Noise dominated data is calculated using 1-second bins in cleaned event files. If a bin has >2000 counts, and if more than 50% of those come from <1% of pixels, then it is considered to be noise-dominated and hence unusable.
| Quadrant | # 1 sec bins | Bins with >0 counts | Bins with >2000 counts | High rate bins dominated by noise | Noise dominated (total time) | Noise dominated (detector-on time) | Marked lightcurve |
|---|---|---|---|---|---|---|---|
| A | 7897 | 7048 | 0 | 0 | 0.00% | 0.00% | 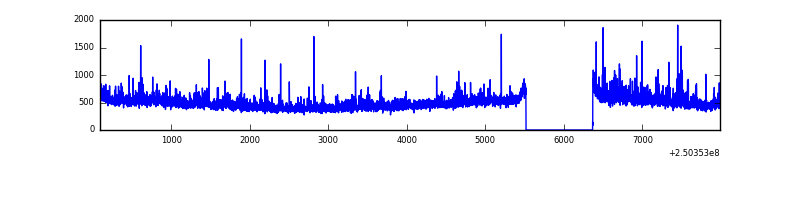 |
| B | 7896 | 7047 | 157 | 157 | 1.99% | 2.23% | 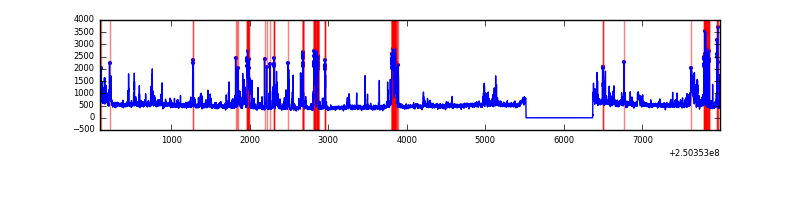 |
| C | 7896 | 7047 | 0 | 0 | 0.00% | 0.00% | 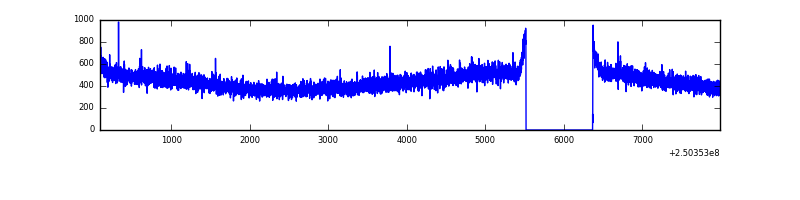 |
| D | 7896 | 7047 | 37 | 37 | 0.47% | 0.53% | 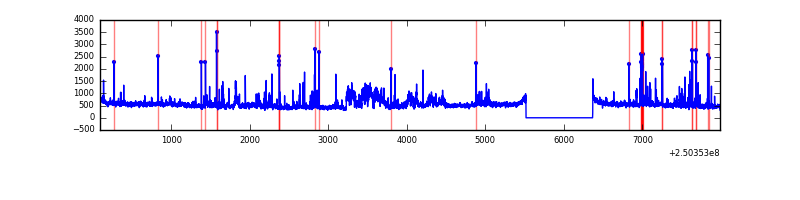 |
Top three noisy pixels from each quadrant. If the there are fewer than three noisy pixels in the level2.evt file, extra rows are filled as -1
| Pixel properties | Quadrant properties | ||||||
|---|---|---|---|---|---|---|---|
| Quadrant | DetID | PixID | Counts | Sigma | Mean | Median | Sigma |
| A | 1 | 162 | 121098 | 704.49 | 833 | 815 | 170.7 |
| A | 1 | 178 | 59320 | 342.66 | 833 | 815 | 170.7 |
| A | 1 | 161 | 52420 | 302.25 | 833 | 815 | 170.7 |
| B | 4 | 239 | 873454 | 5487.73 | 825 | 807 | 159.0 |
| B | 15 | 204 | 82021 | 510.72 | 825 | 807 | 159.0 |
| B | 4 | 173 | 42511 | 262.26 | 825 | 807 | 159.0 |
| C | 13 | 61 | 6009 | 27.94 | 800 | 803 | 186.3 |
| C | 12 | 4 | 1947 | 6.14 | 800 | 803 | 186.3 |
| C | 3 | 202 | 1938 | 6.09 | 800 | 803 | 186.3 |
| D | 1 | 52 | 446158 | 2331.81 | 792 | 770 | 191.0 |
| D | 8 | 195 | 389594 | 2035.67 | 792 | 770 | 191.0 |
| D | 13 | 104 | 75540 | 391.46 | 792 | 770 | 191.0 |
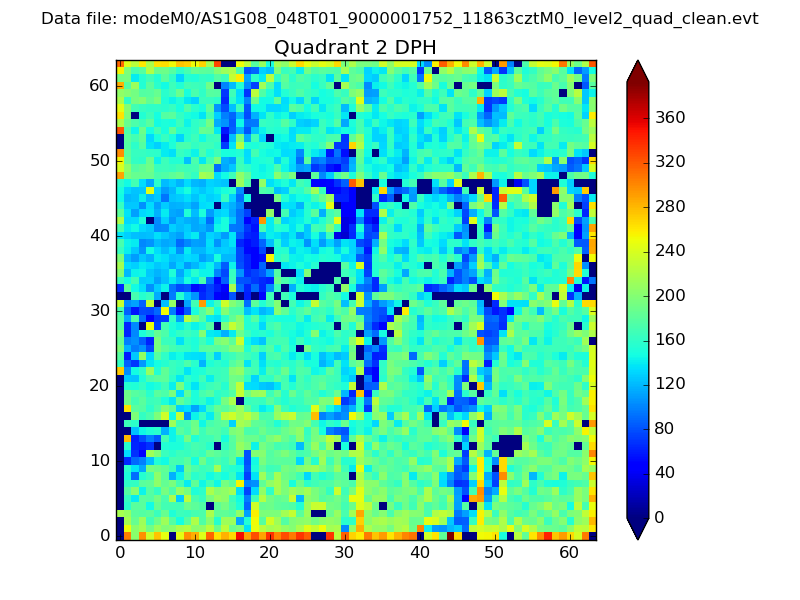
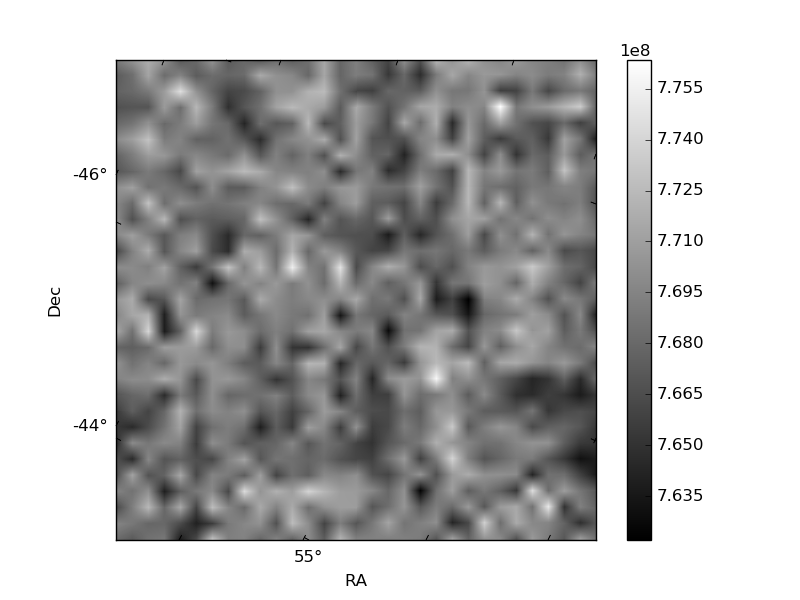
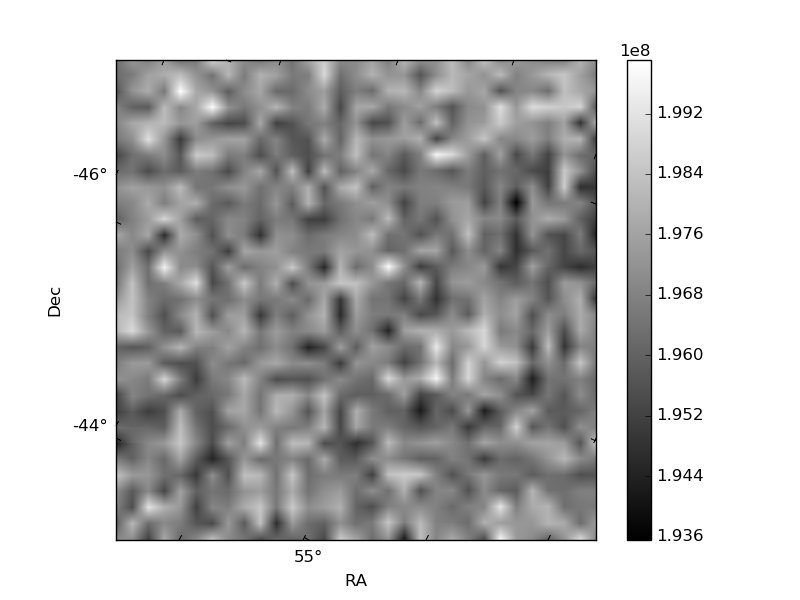
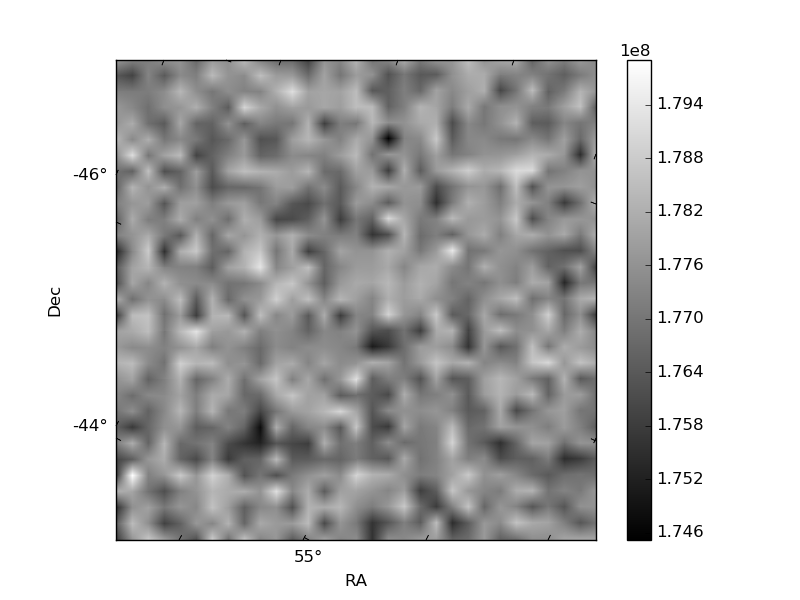
Histogram calculated using DETX and DETY for each event in the final _common_clean file
| Quadrant A | 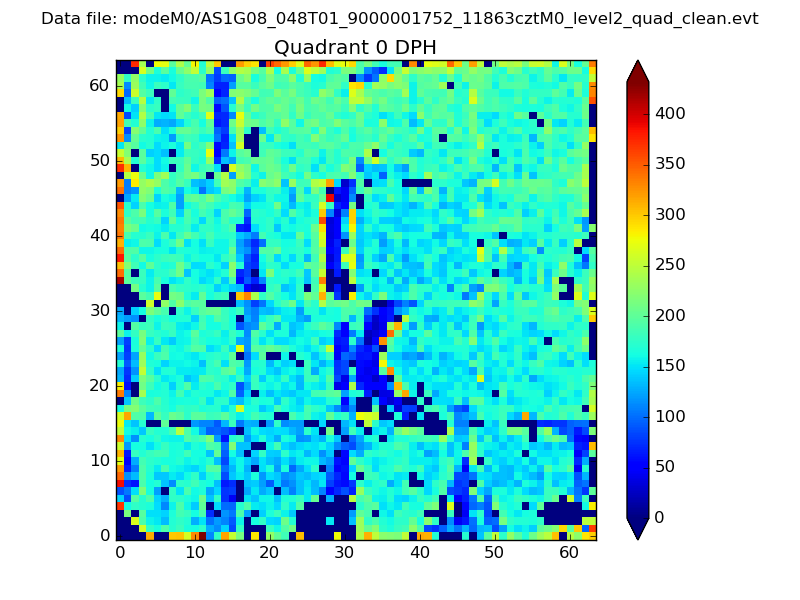 |
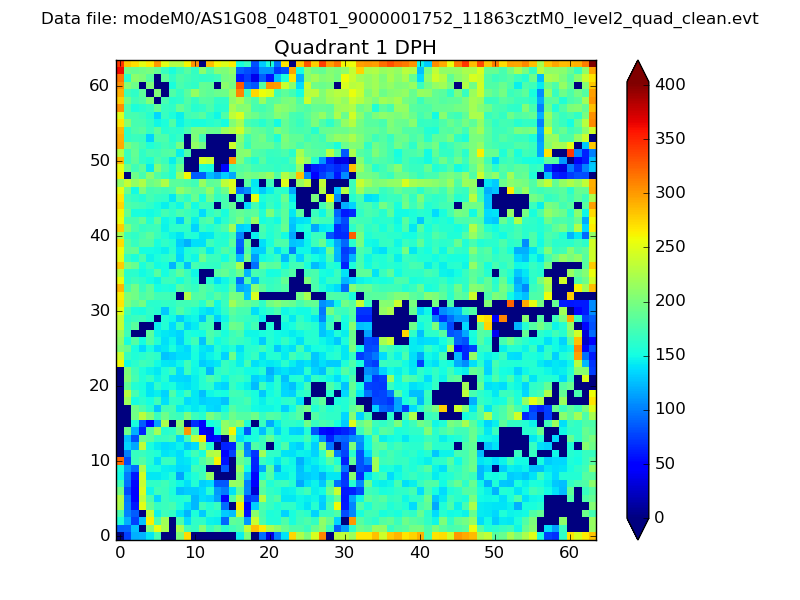 |
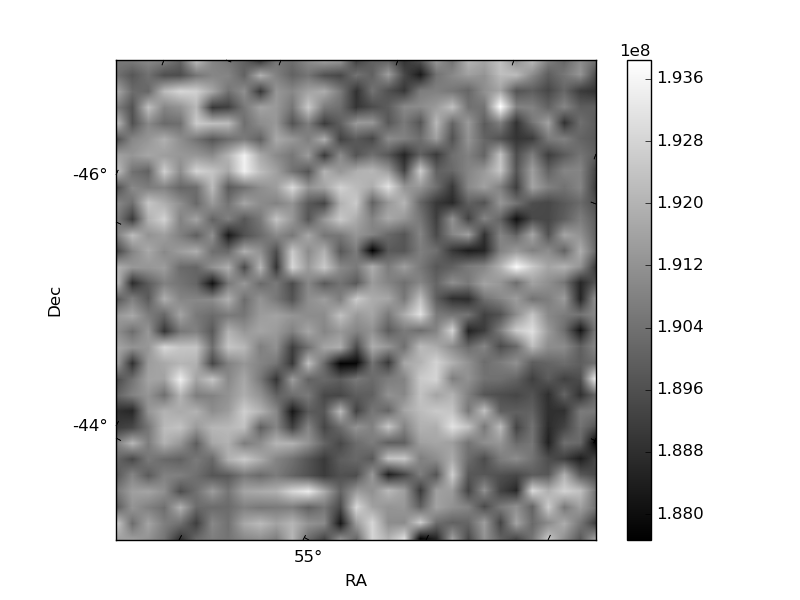
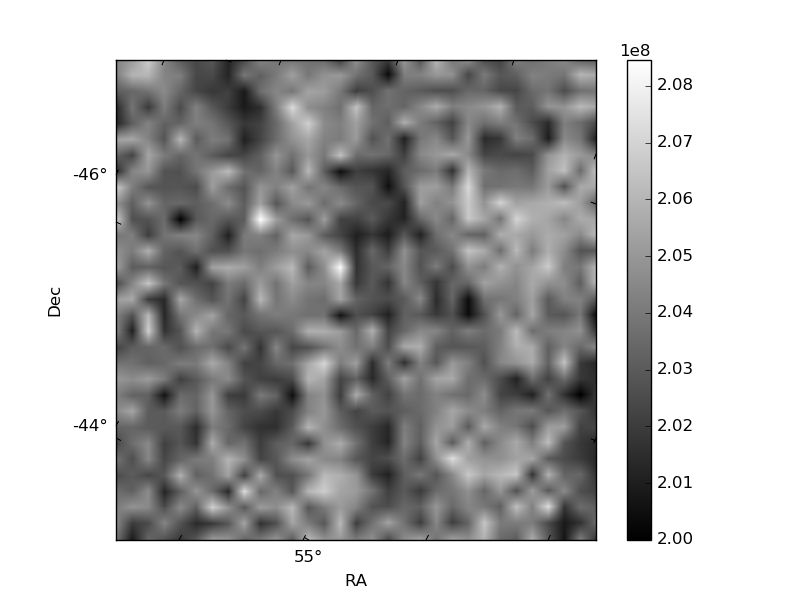
Quadrant B |
|---|---|---|---|
| Quadrant D | 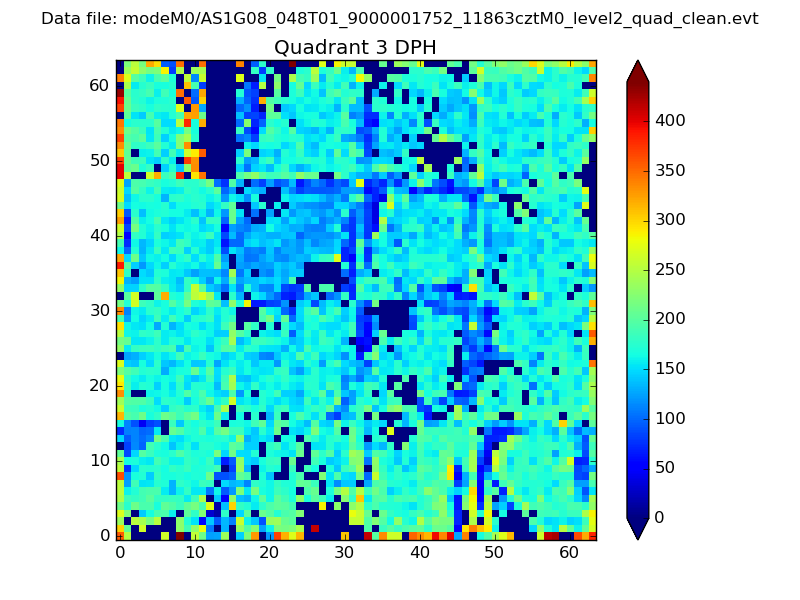 |
 |
Quadrant C |
| Plot type | Count rate plots | Images |
|---|---|---|
| Comparison with Poisson distribution Blue bars denote a histogram of data divided into 1 sec bins. Red curve is a Poisson curve with rate = median count rate of data. |
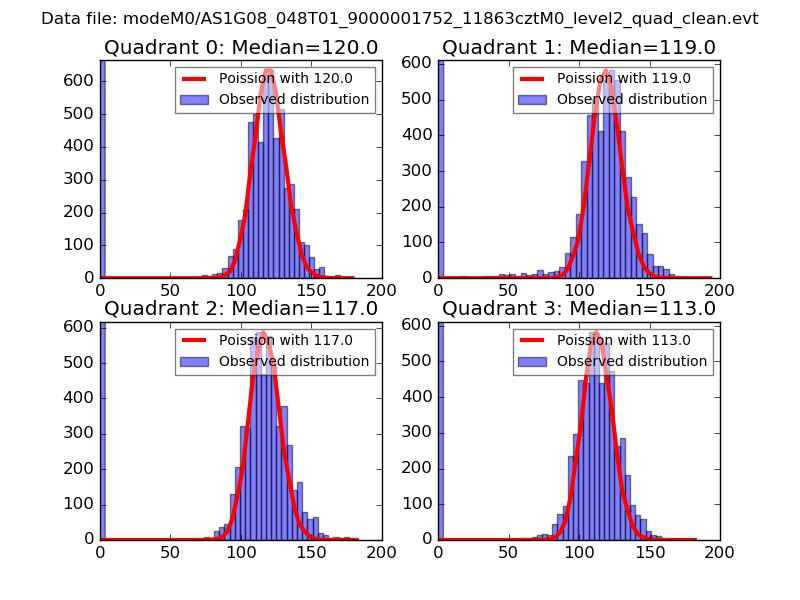 |
 |
| Quadrant-wise count rates Data is divided into 100 sec bins |
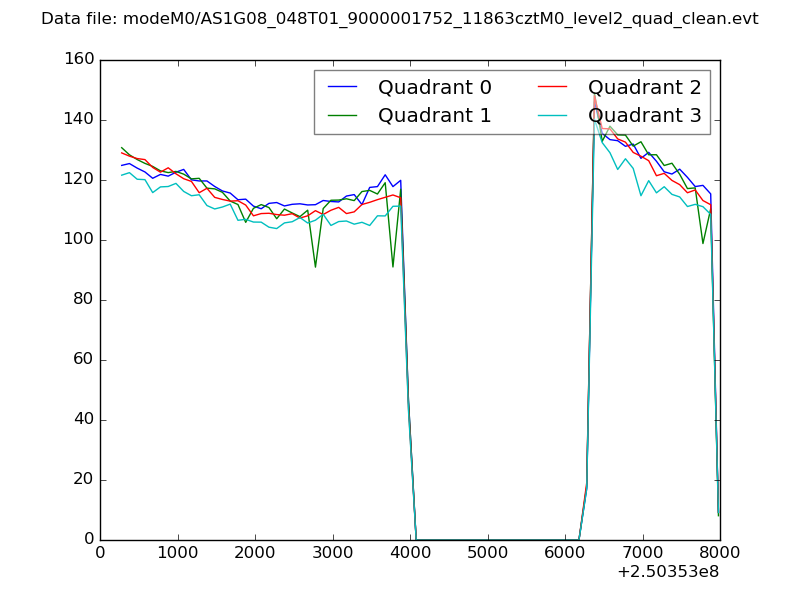 |
|
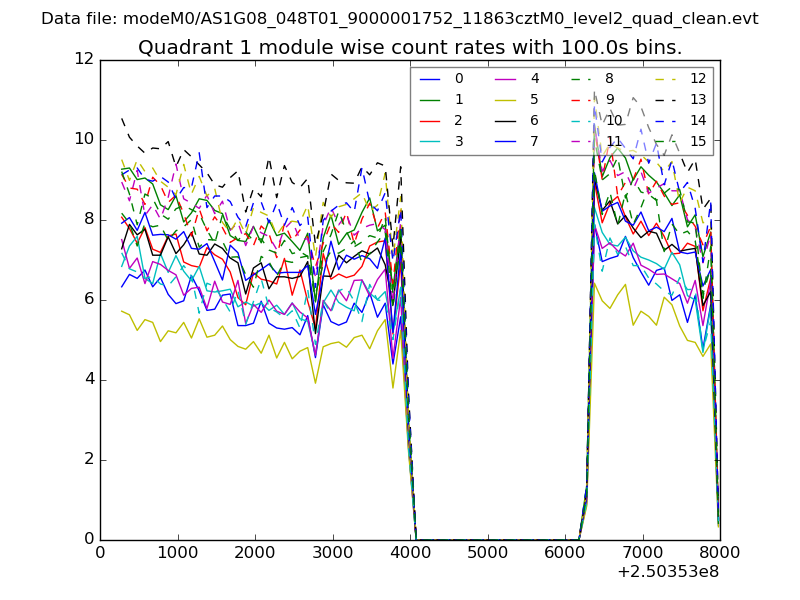
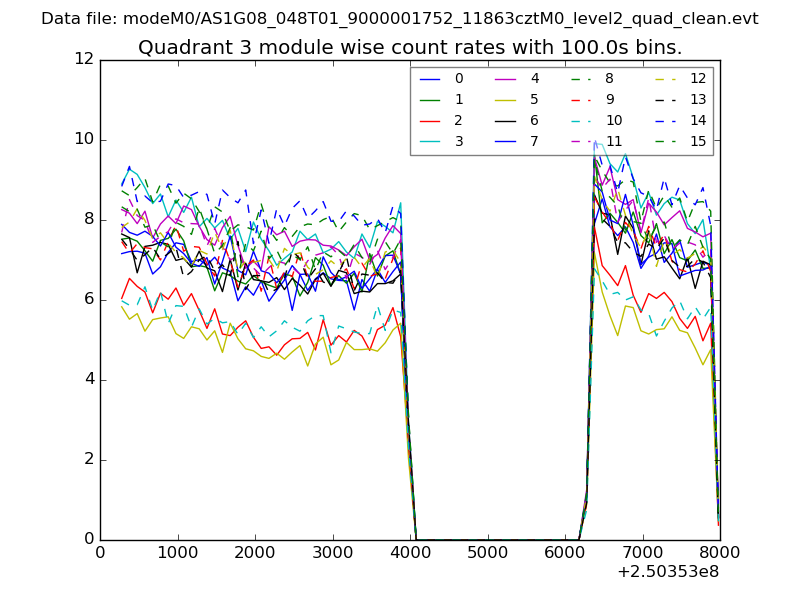
| Module-wise count rates for Quadrant A Data is divided into 100 sec bins |
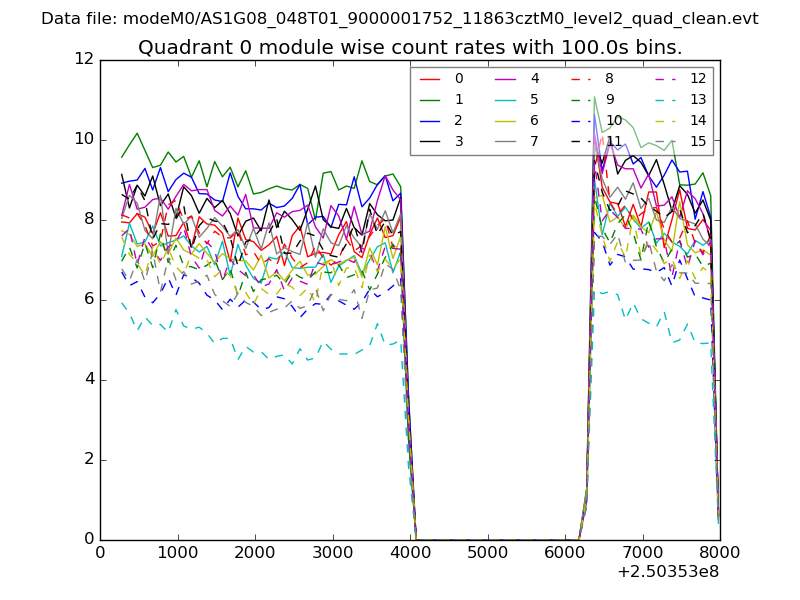 |
 |
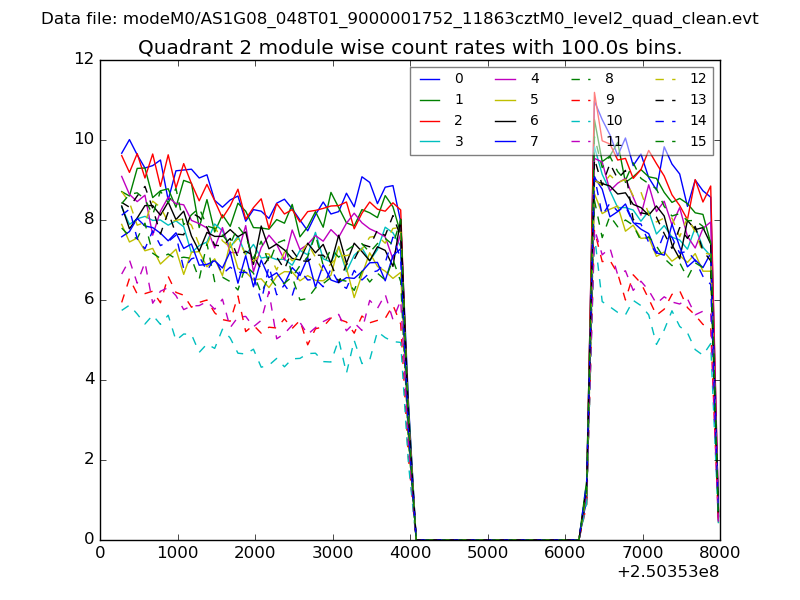
| Module-wise count rates for Quadrant B Data is divided into 100 sec bins |
 |
 |
| Module-wise count rates for Quadrant C Data is divided into 100 sec bins |
 |
 |
| Module-wise count rates for Quadrant D Data is divided into 100 sec bins |
 |
 |
| Parameter | Plot |
|---|---|
| CZT HV Monitor | 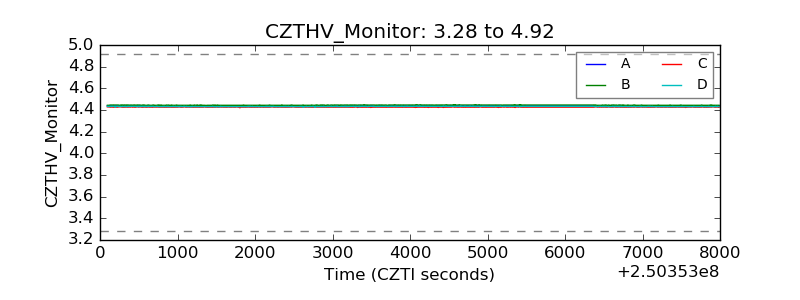 |
| D_VDD | 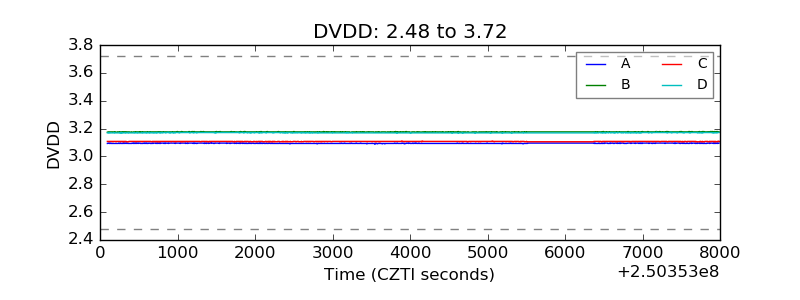 |
| Temperature 1 | 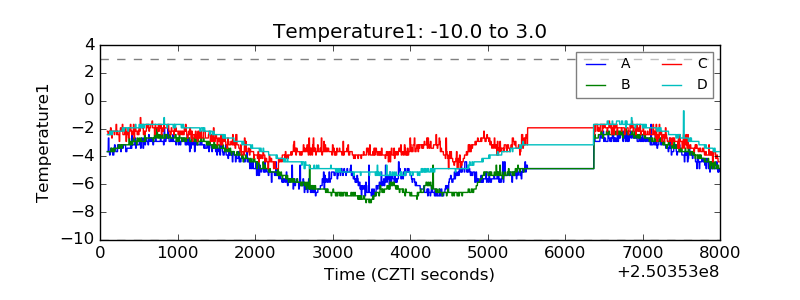 |
| Veto HV Monitor | 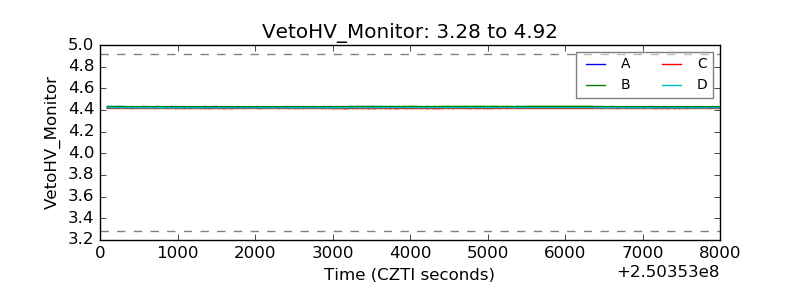 |
| Veto LLD | 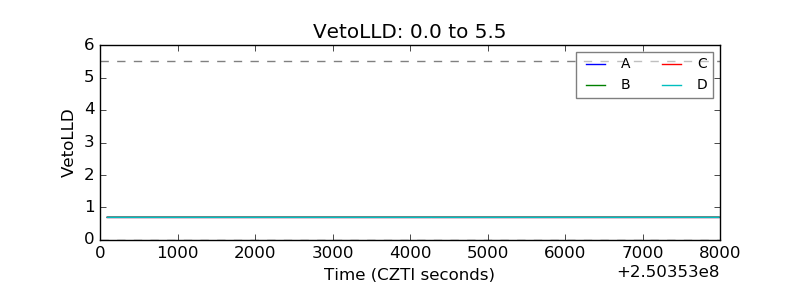 |
| Alpha Counter | 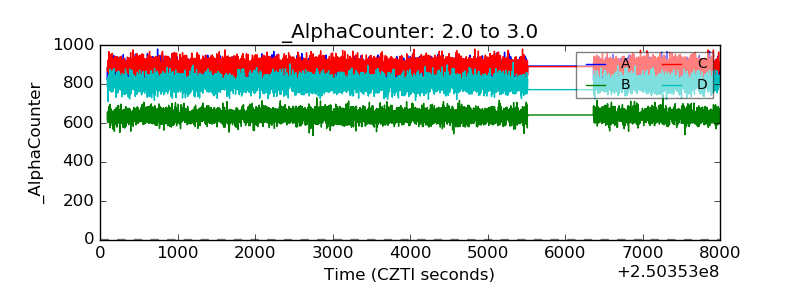 |
| _CPM_Rate | 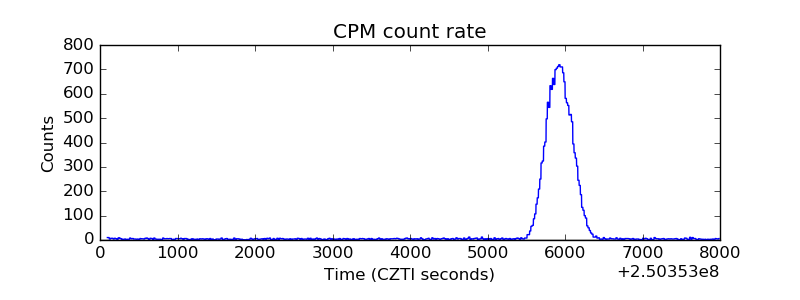 |
| CZT Counter | 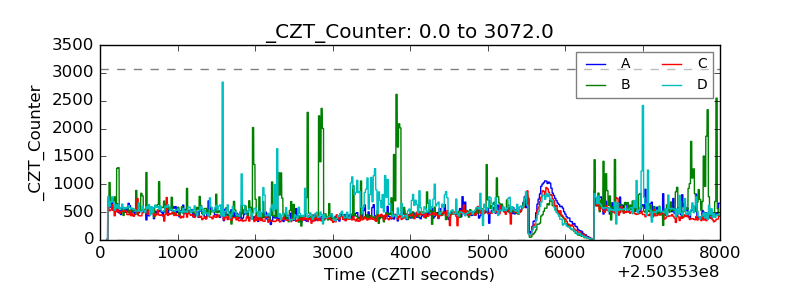 |
| +2.5 Volts monitor |  |
| +5 Volts monitor |  |
| _ROLL_ROT | 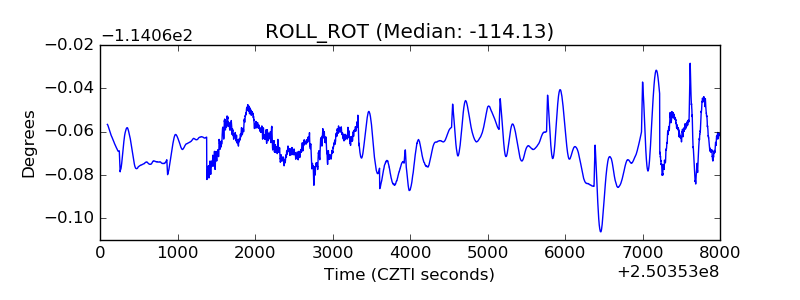 |
| _Roll_DEC | 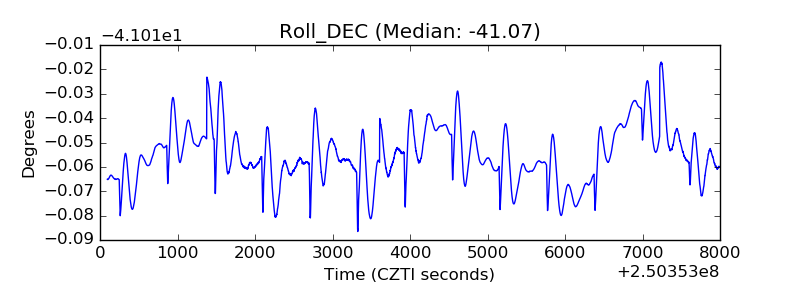 |
| _Roll_RA | 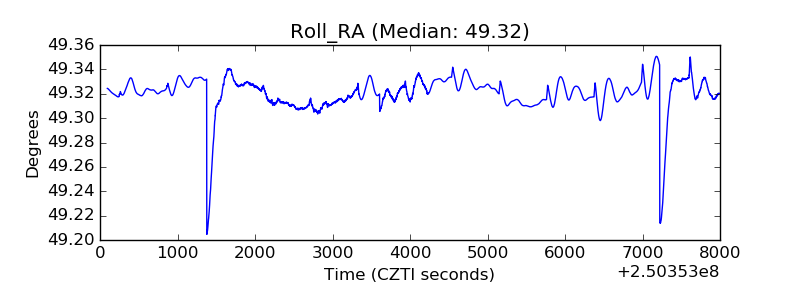 |
| Veto Counter | 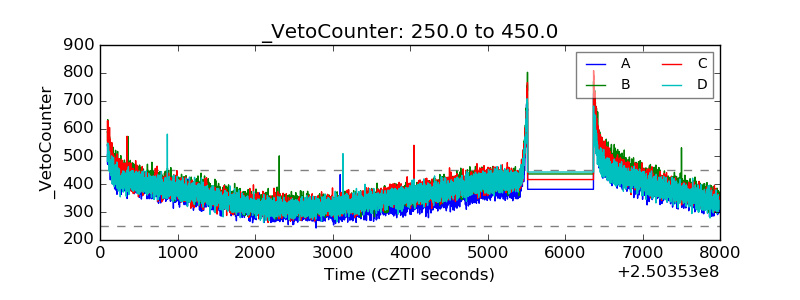 |