| Param | Original file | Final file |
|---|---|---|
| Filename | modeM0/AS1G08_048T01_9000001752_11864cztM0_level2.evt | modeM0/AS1G08_048T01_9000001752_11864cztM0_level2_quad_clean.evt |
| Size (bytes) | 490,700,160 | 91,111,680 |
| Size | 468.0 MB | 86.9 MB |
| Events in quadrant A | 3,379,877 | 591,855 |
| Events in quadrant B | 4,438,569 | 579,352 |
| Events in quadrant C | 2,878,735 | 579,252 |
| Events in quadrant D | 3,717,711 | 550,664 |
| Mode M0 | |||
|---|---|---|---|
| Quadrant | BADHDUFLAG | Total packets | Discarded packets |
| A | 0 | 14484 | 2 |
| B | 0 | 17548 | 1 |
| C | 0 | 13306 | 1 |
| D | 0 | 15362 | 1 |
| Mode SS | |||
|---|---|---|---|
| Quadrant | BADHDUFLAG | Total packets | Discarded packets |
| A | 0 | 134 | 0 |
| B | 0 | 134 | 0 |
| C | 0 | 134 | 0 |
| D | 0 | 134 | 0 |
| Mode M9 | |||
|---|---|---|---|
| Quadrant | BADHDUFLAG | Total packets | Discarded packets |
| A | 0 | 10 | 0 |
| B | 0 | 10 | 0 |
| C | 0 | 10 | 0 |
| D | 0 | 10 | 0 |
| Quadrant | Total seconds | Saturated seconds | Saturation percentage |
|---|---|---|---|
| A | 6565 | 53 | 0.807312% |
| B | 6565 | 457 | 6.961158% |
| C | 6565 | 14 | 0.213252% |
| D | 6565 | 127 | 1.934501% |
Noise dominated data is calculated using 1-second bins in cleaned event files. If a bin has >2000 counts, and if more than 50% of those come from <1% of pixels, then it is considered to be noise-dominated and hence unusable.
| Quadrant | # 1 sec bins | Bins with >0 counts | Bins with >2000 counts | High rate bins dominated by noise | Noise dominated (total time) | Noise dominated (detector-on time) | Marked lightcurve |
|---|---|---|---|---|---|---|---|
| A | 7591 | 6567 | 0 | 0 | 0.00% | 0.00% | 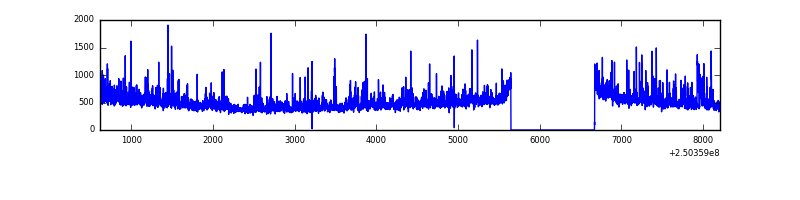 |
| B | 7591 | 6567 | 311 | 311 | 4.10% | 4.74% | 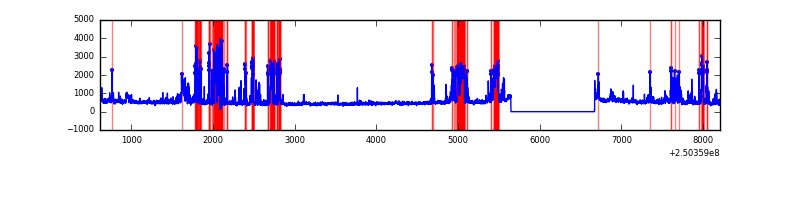 |
| C | 7591 | 6567 | 0 | 0 | 0.00% | 0.00% | 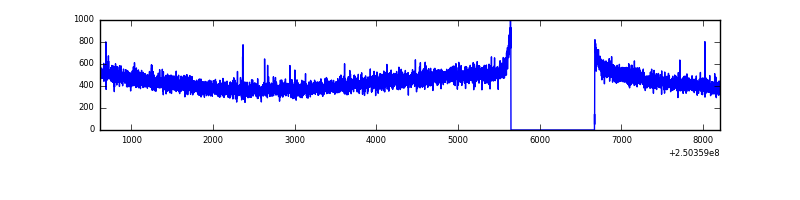 |
| D | 7591 | 6567 | 135 | 135 | 1.78% | 2.06% | 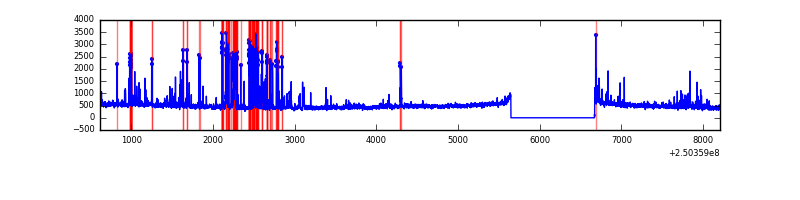 |
Top three noisy pixels from each quadrant. If the there are fewer than three noisy pixels in the level2.evt file, extra rows are filled as -1
| Pixel properties | Quadrant properties | ||||||
|---|---|---|---|---|---|---|---|
| Quadrant | DetID | PixID | Counts | Sigma | Mean | Median | Sigma |
| A | 1 | 162 | 136319 | 863.12 | 768 | 751 | 157.1 |
| A | 1 | 178 | 68568 | 431.77 | 768 | 751 | 157.1 |
| A | 1 | 161 | 60240 | 378.75 | 768 | 751 | 157.1 |
| B | 4 | 239 | 1263553 | 8688.29 | 755 | 737 | 145.3 |
| B | 15 | 204 | 72405 | 493.08 | 755 | 737 | 145.3 |
| B | 15 | 185 | 37965 | 256.13 | 755 | 737 | 145.3 |
| C | 13 | 61 | 5435 | 27.43 | 737 | 739 | 171.2 |
| C | 8 | 222 | 2282 | 9.01 | 737 | 739 | 171.2 |
| C | 14 | 234 | 1842 | 6.44 | 737 | 739 | 171.2 |
| D | 1 | 52 | 538304 | 3070.99 | 727 | 706 | 175.1 |
| D | 8 | 195 | 248175 | 1413.65 | 727 | 706 | 175.1 |
| D | 13 | 104 | 44844 | 252.14 | 727 | 706 | 175.1 |
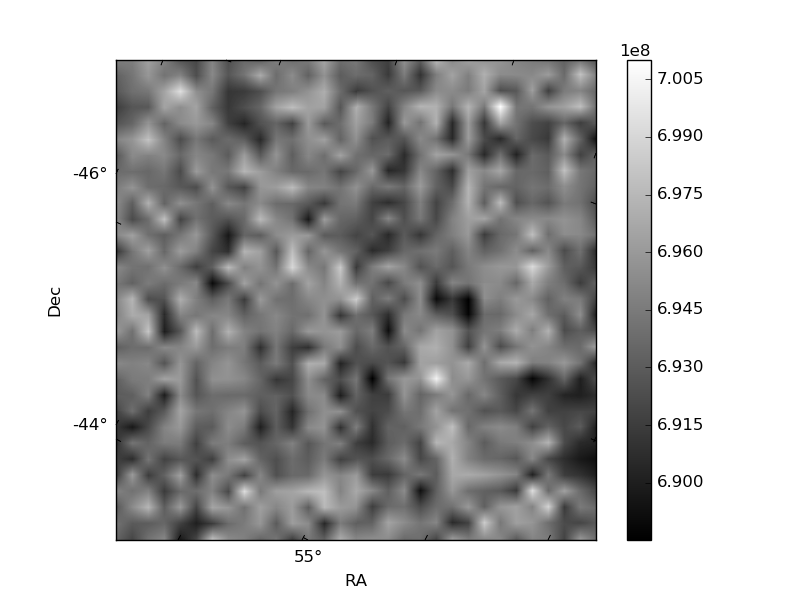
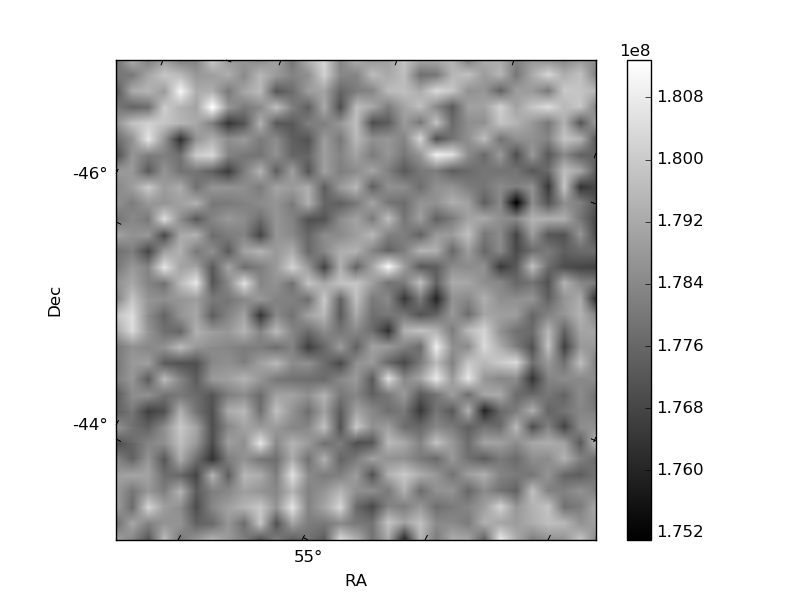
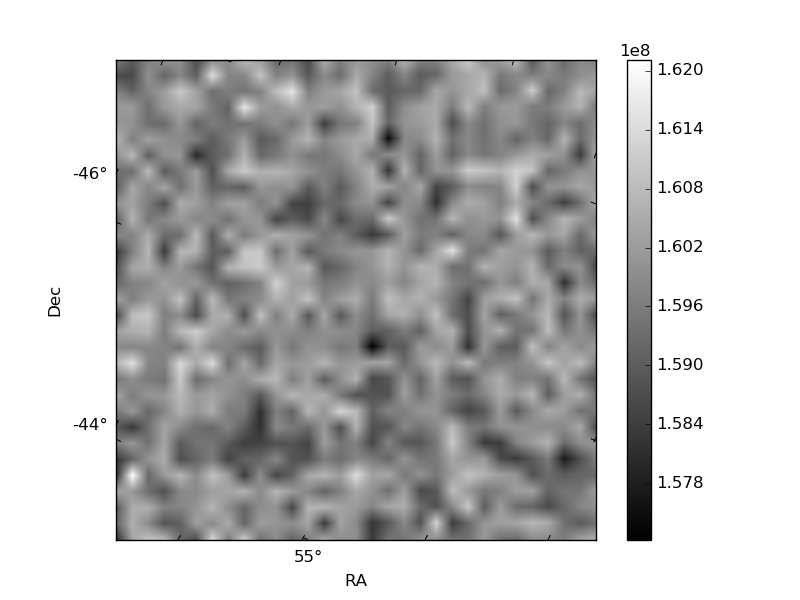
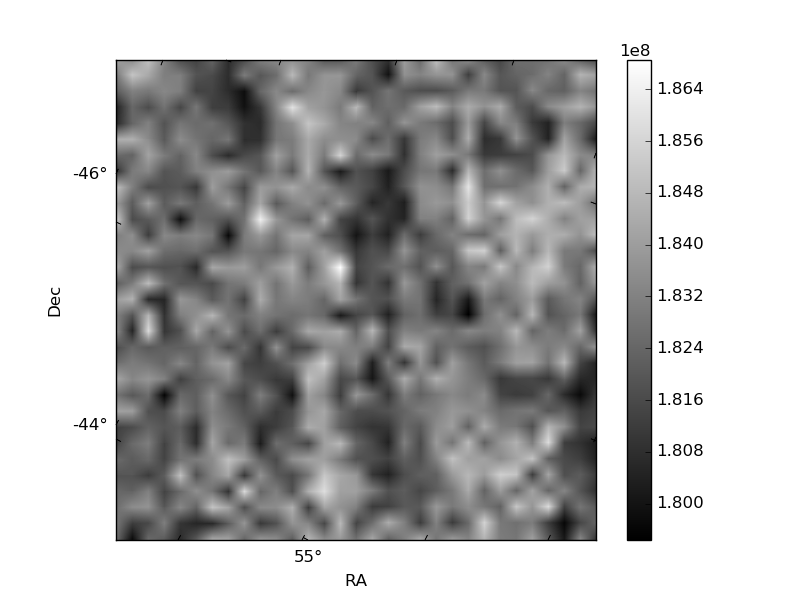
Histogram calculated using DETX and DETY for each event in the final _common_clean file
| Quadrant A |  |
 |
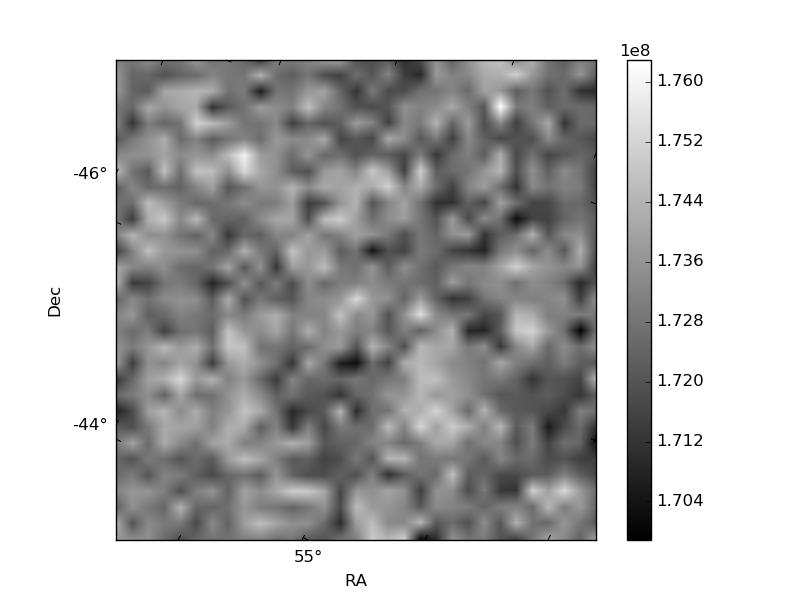
Quadrant B |
|---|---|---|---|
| Quadrant D |  |
 |
Quadrant C |
| Plot type | Count rate plots | Images |
|---|---|---|
| Comparison with Poisson distribution Blue bars denote a histogram of data divided into 1 sec bins. Red curve is a Poisson curve with rate = median count rate of data. |
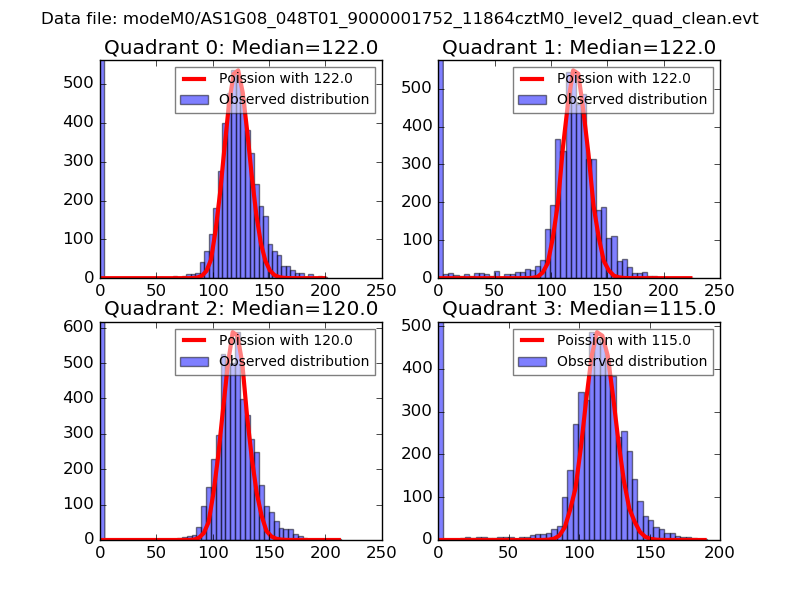 |
 |
| Quadrant-wise count rates Data is divided into 100 sec bins |
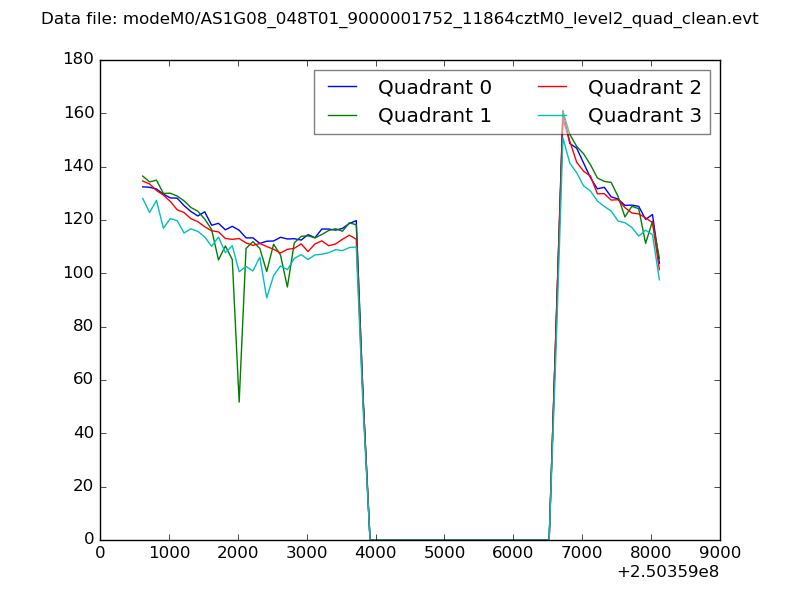 |
|
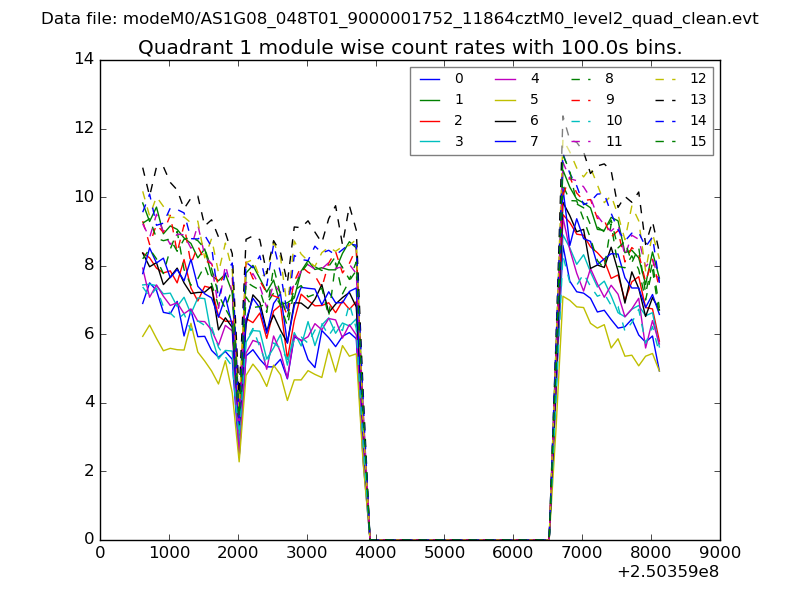
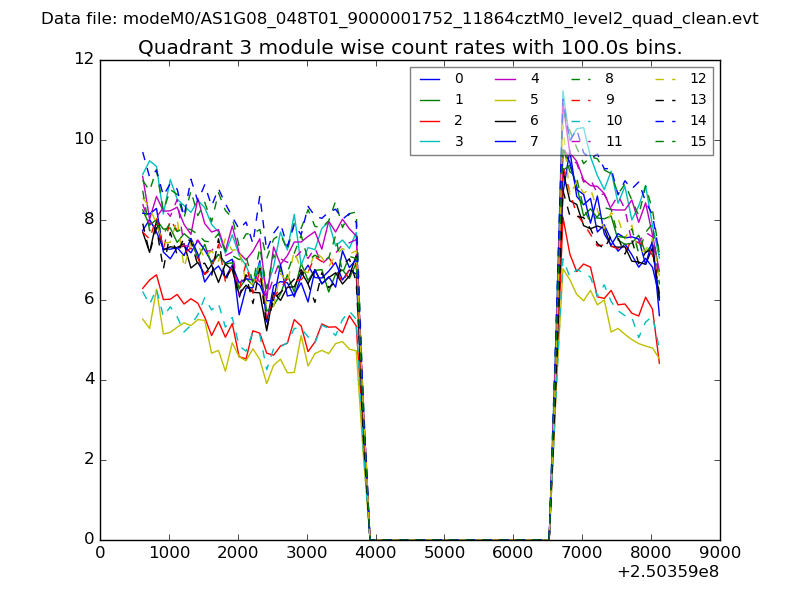
| Module-wise count rates for Quadrant A Data is divided into 100 sec bins |
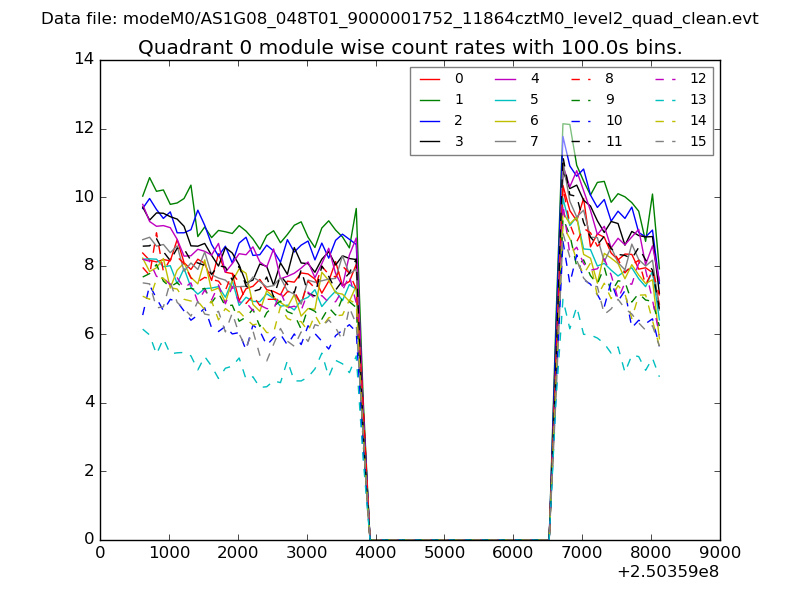 |
 |
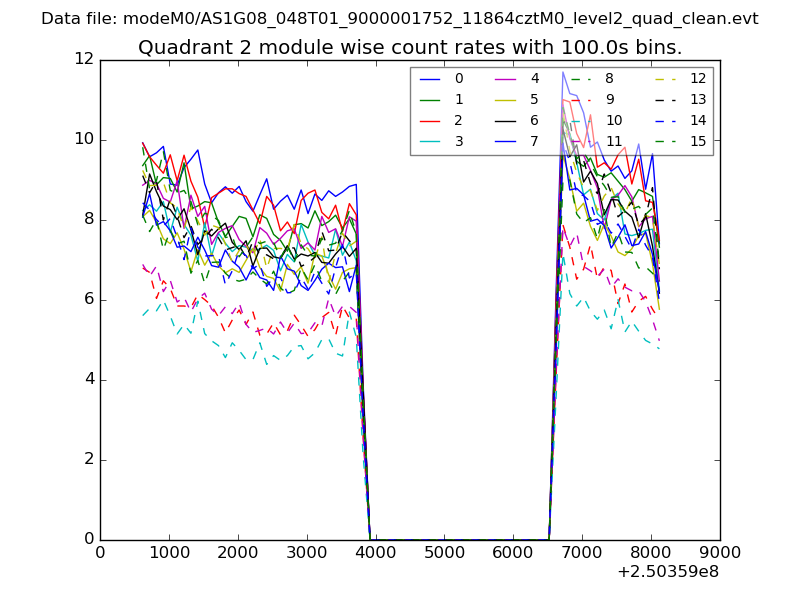
| Module-wise count rates for Quadrant B Data is divided into 100 sec bins |
 |
 |
| Module-wise count rates for Quadrant C Data is divided into 100 sec bins |
 |
 |
| Module-wise count rates for Quadrant D Data is divided into 100 sec bins |
 |
 |
| Parameter | Plot |
|---|---|
| CZT HV Monitor | 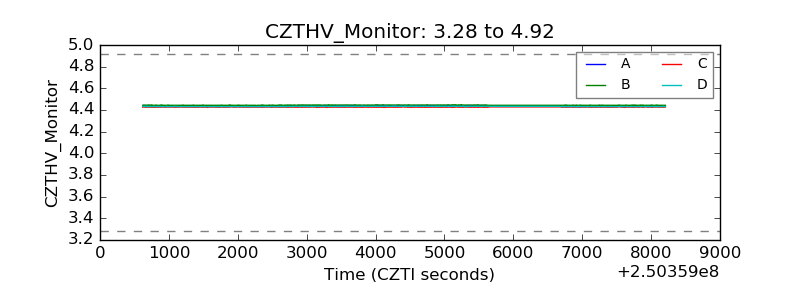 |
| D_VDD | 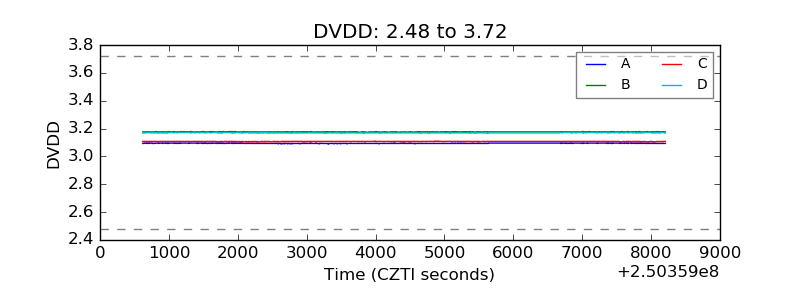 |
| Temperature 1 | 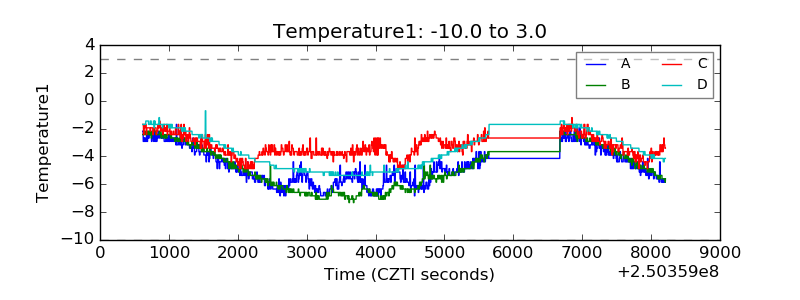 |
| Veto HV Monitor | 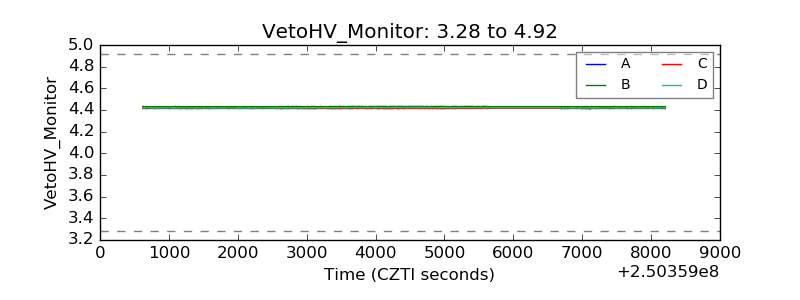 |
| Veto LLD | 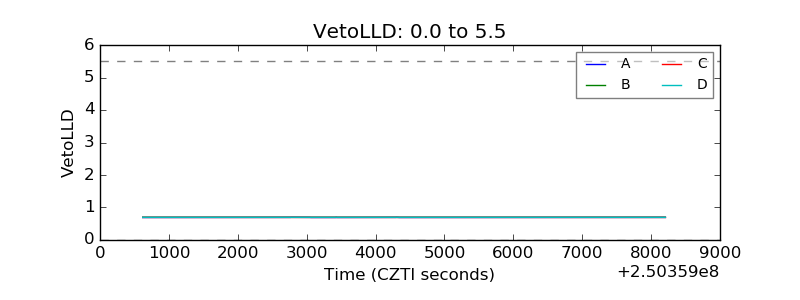 |
| Alpha Counter | 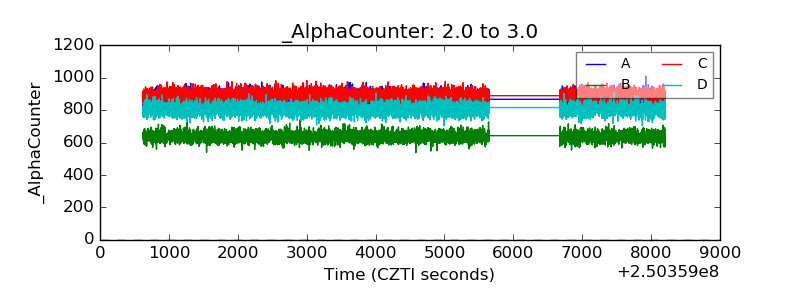 |
| _CPM_Rate | 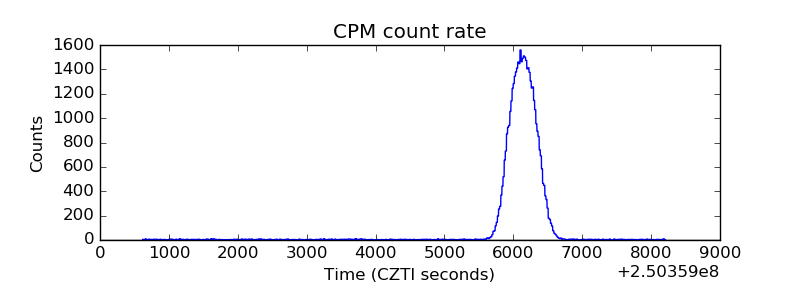 |
| CZT Counter |  |
| +2.5 Volts monitor |  |
| +5 Volts monitor |  |
| _ROLL_ROT | 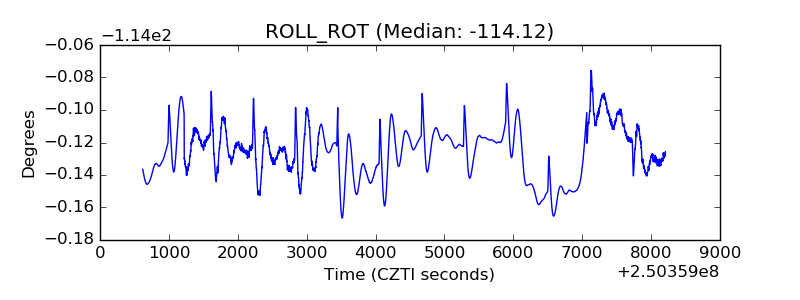 |
| _Roll_DEC | 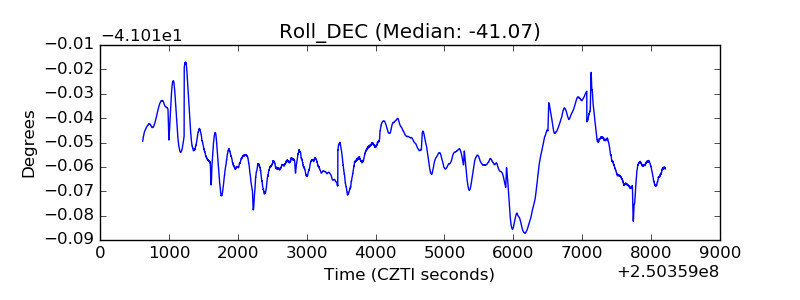 |
| _Roll_RA | 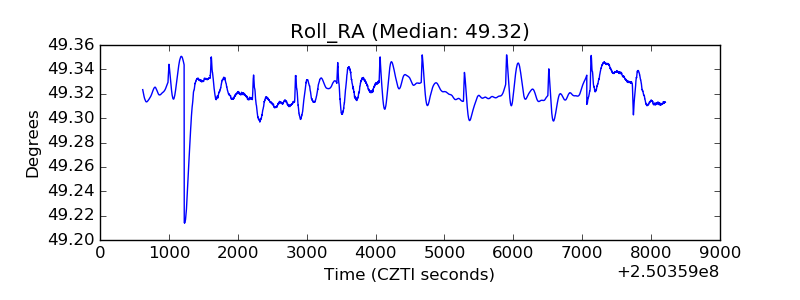 |
| Veto Counter | 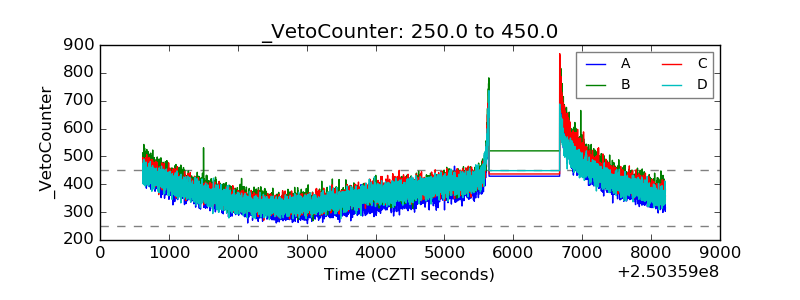 |