| Param | Original file | Final file |
|---|---|---|
| Filename | modeM0/AS1G08_048T01_9000001752_11866cztM0_level2.evt | modeM0/AS1G08_048T01_9000001752_11866cztM0_level2_quad_clean.evt |
| Size (bytes) | 475,536,960 | 89,899,200 |
| Size | 453.5 MB | 85.7 MB |
| Events in quadrant A | 3,362,680 | 583,445 |
| Events in quadrant B | 4,394,772 | 561,763 |
| Events in quadrant C | 2,939,647 | 573,687 |
| Events in quadrant D | 3,260,340 | 547,296 |
| Mode M0 | |||
|---|---|---|---|
| Quadrant | BADHDUFLAG | Total packets | Discarded packets |
| A | 0 | 14324 | 3 |
| B | 0 | 17376 | 2 |
| C | 0 | 13333 | 2 |
| D | 0 | 14142 | 2 |
| Mode SS | |||
|---|---|---|---|
| Quadrant | BADHDUFLAG | Total packets | Discarded packets |
| A | 0 | 132 | 0 |
| B | 0 | 132 | 0 |
| C | 0 | 132 | 0 |
| D | 0 | 132 | 0 |
| Mode M9 | |||
|---|---|---|---|
| Quadrant | BADHDUFLAG | Total packets | Discarded packets |
| A | 0 | 15 | 0 |
| B | 0 | 15 | 0 |
| C | 0 | 15 | 0 |
| D | 0 | 16 | 0 |
| Quadrant | Total seconds | Saturated seconds | Saturation percentage |
|---|---|---|---|
| A | 6542 | 40 | 0.611434% |
| B | 6542 | 410 | 6.267197% |
| C | 6542 | 11 | 0.168144% |
| D | 6542 | 39 | 0.596148% |
Noise dominated data is calculated using 1-second bins in cleaned event files. If a bin has >2000 counts, and if more than 50% of those come from <1% of pixels, then it is considered to be noise-dominated and hence unusable.
| Quadrant | # 1 sec bins | Bins with >0 counts | Bins with >2000 counts | High rate bins dominated by noise | Noise dominated (total time) | Noise dominated (detector-on time) | Marked lightcurve |
|---|---|---|---|---|---|---|---|
| A | 7713 | 6544 | 0 | 0 | 0.00% | 0.00% | 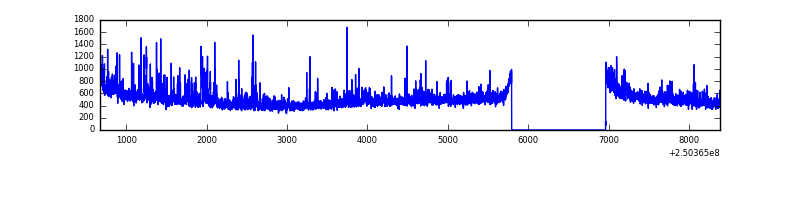 |
| B | 7713 | 6544 | 287 | 287 | 3.72% | 4.39% | 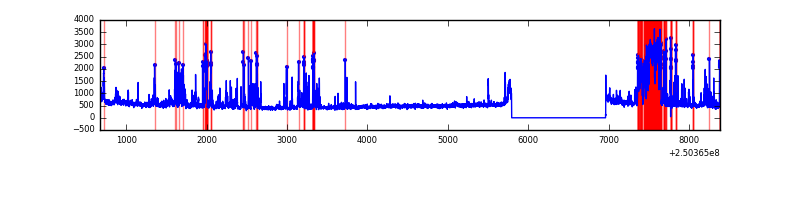 |
| C | 7713 | 6544 | 0 | 0 | 0.00% | 0.00% | 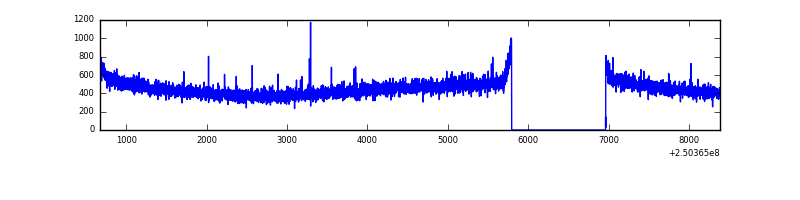 |
| D | 7713 | 6544 | 16 | 16 | 0.21% | 0.24% | 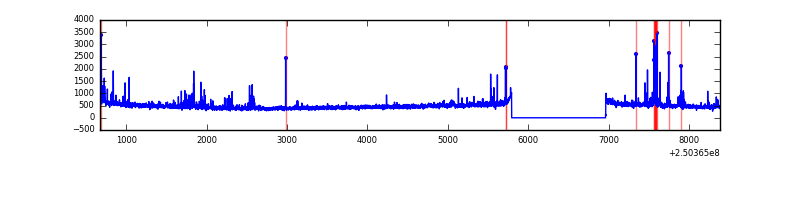 |
Top three noisy pixels from each quadrant. If the there are fewer than three noisy pixels in the level2.evt file, extra rows are filled as -1
| Pixel properties | Quadrant properties | ||||||
|---|---|---|---|---|---|---|---|
| Quadrant | DetID | PixID | Counts | Sigma | Mean | Median | Sigma |
| A | 8 | 15 | 88618 | 555.7 | 781 | 764 | 158.1 |
| A | 1 | 162 | 82696 | 518.24 | 781 | 764 | 158.1 |
| A | 13 | 251 | 62569 | 390.93 | 781 | 764 | 158.1 |
| B | 4 | 239 | 739774 | 5072.47 | 764 | 747 | 145.7 |
| B | 3 | 64 | 459328 | 3147.57 | 764 | 747 | 145.7 |
| B | 15 | 185 | 66367 | 450.4 | 764 | 747 | 145.7 |
| C | 13 | 61 | 5424 | 26.78 | 753 | 757 | 174.3 |
| C | 14 | 234 | 2896 | 12.27 | 753 | 757 | 174.3 |
| C | 12 | 4 | 2811 | 11.78 | 753 | 757 | 174.3 |
| D | 8 | 195 | 185655 | 1029.61 | 742 | 720 | 179.6 |
| D | 1 | 52 | 81223 | 448.19 | 742 | 720 | 179.6 |
| D | 13 | 249 | 80787 | 445.77 | 742 | 720 | 179.6 |
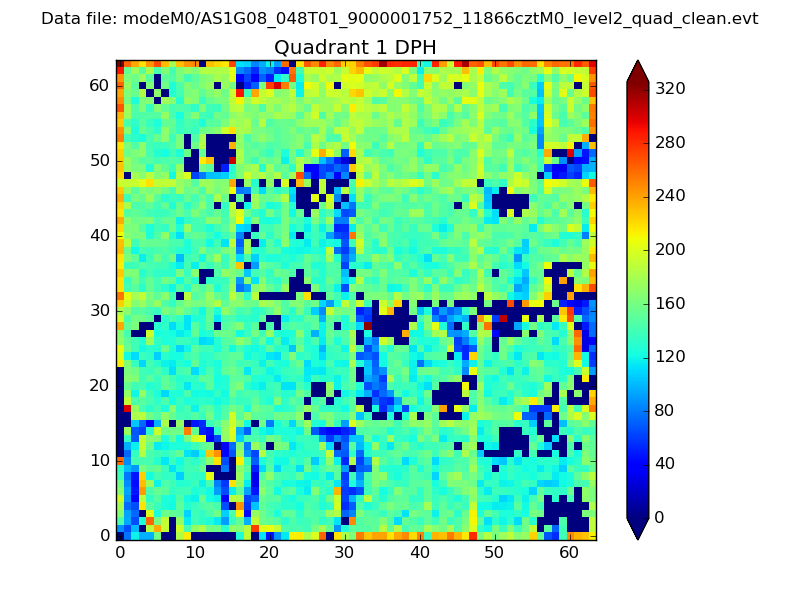
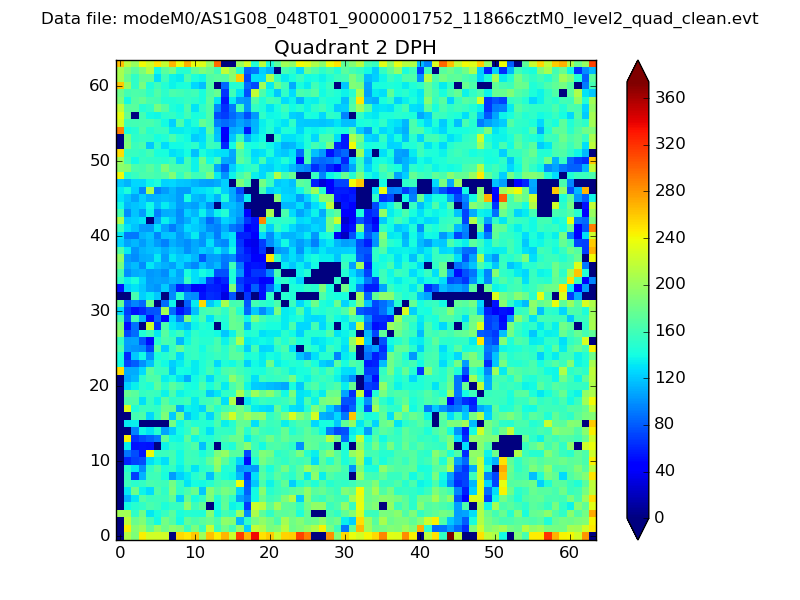
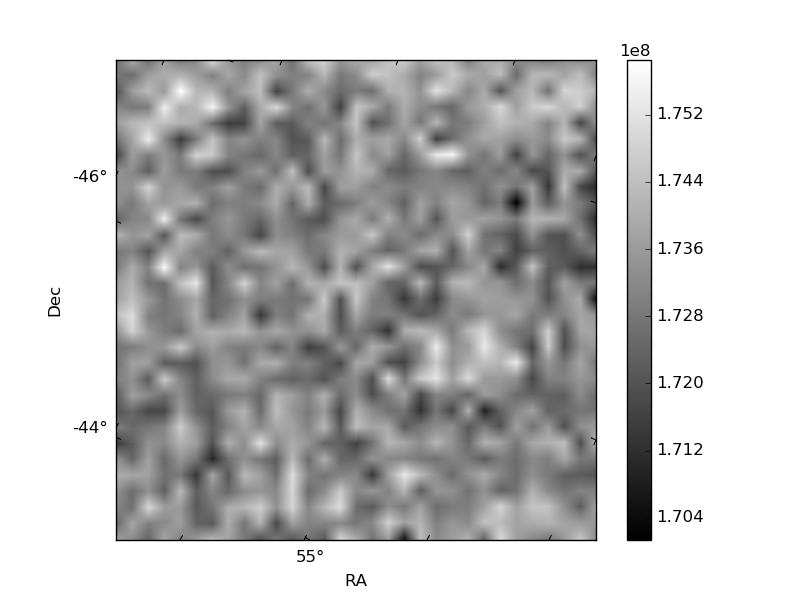
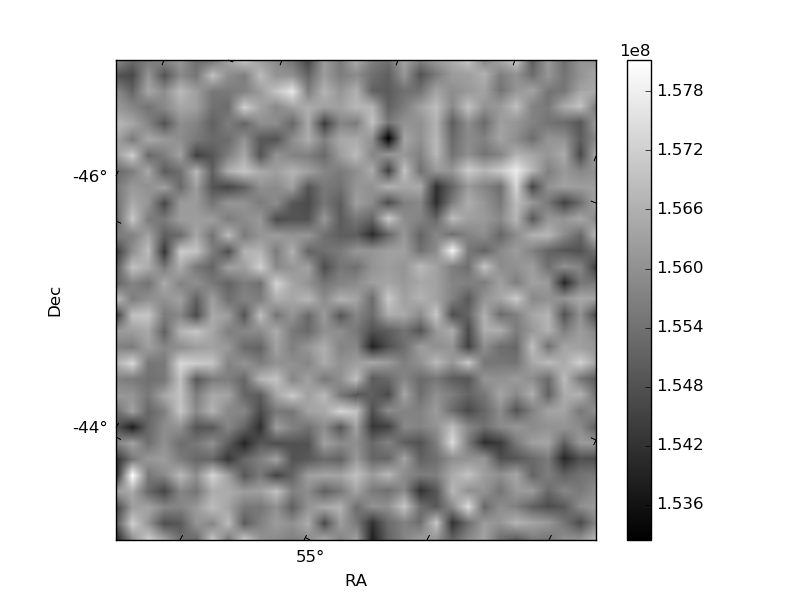
Histogram calculated using DETX and DETY for each event in the final _common_clean file
| Quadrant A |  |
 |
Quadrant B |
|---|---|---|---|
| Quadrant D |  |
 |
Quadrant C |
| Plot type | Count rate plots | Images |
|---|---|---|
| Comparison with Poisson distribution Blue bars denote a histogram of data divided into 1 sec bins. Red curve is a Poisson curve with rate = median count rate of data. |
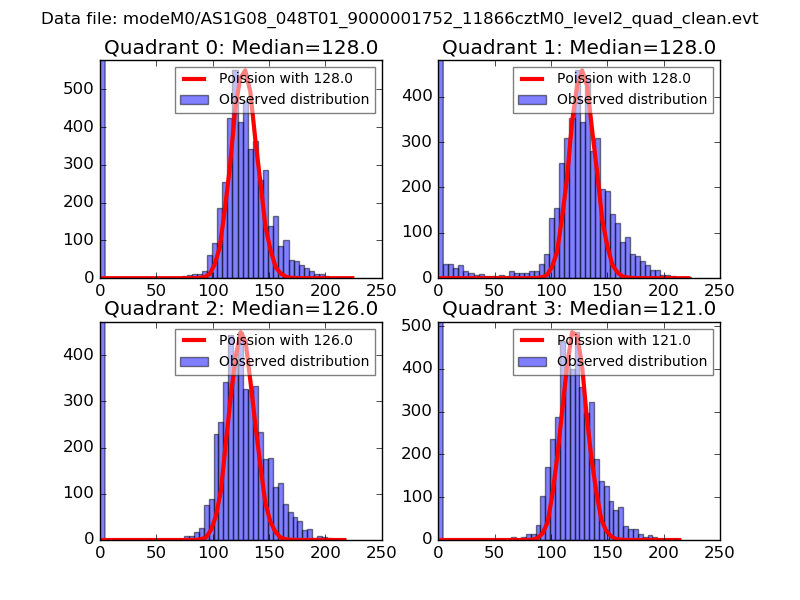 |
 |
| Quadrant-wise count rates Data is divided into 100 sec bins |
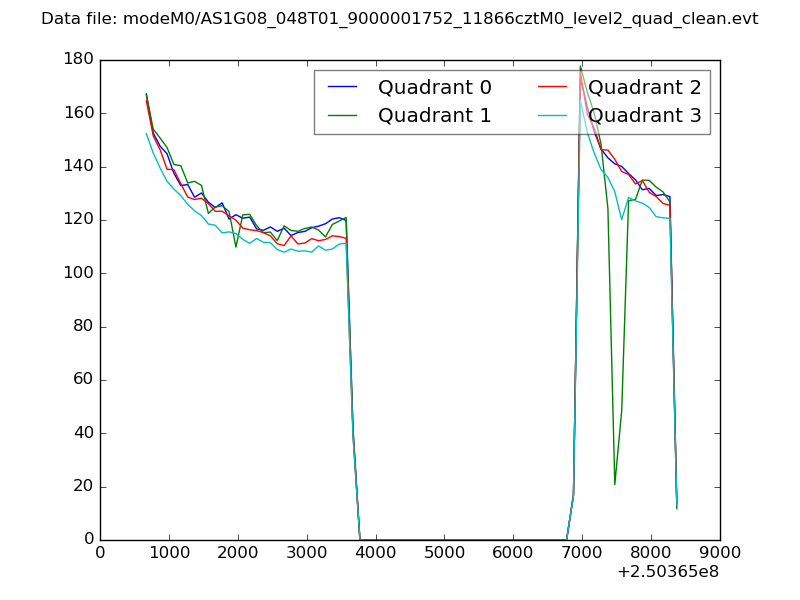 |
|
| Module-wise count rates for Quadrant A Data is divided into 100 sec bins |
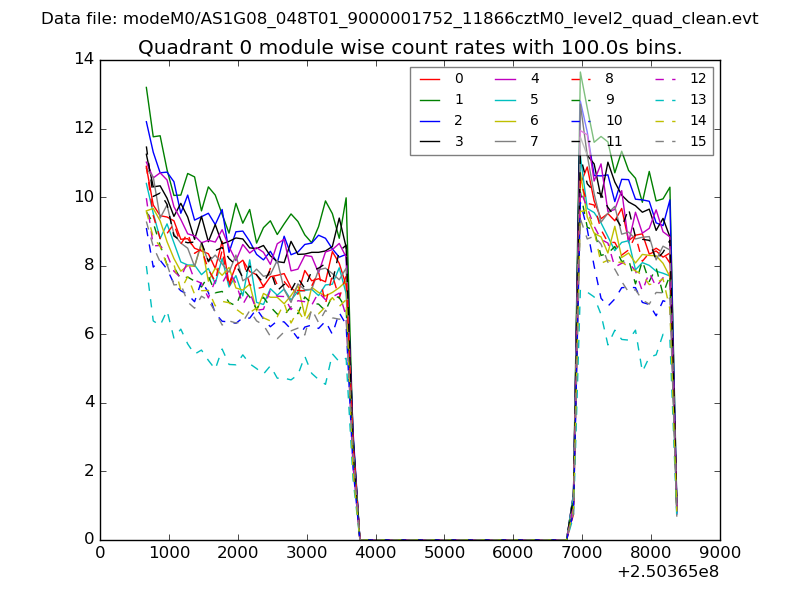 |
 |
| Module-wise count rates for Quadrant B Data is divided into 100 sec bins |
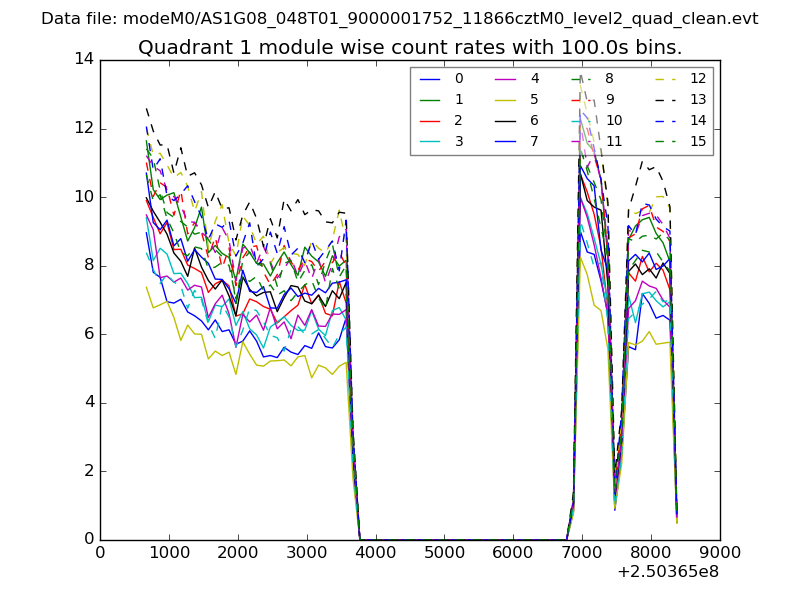 |
 |
| Module-wise count rates for Quadrant C Data is divided into 100 sec bins |
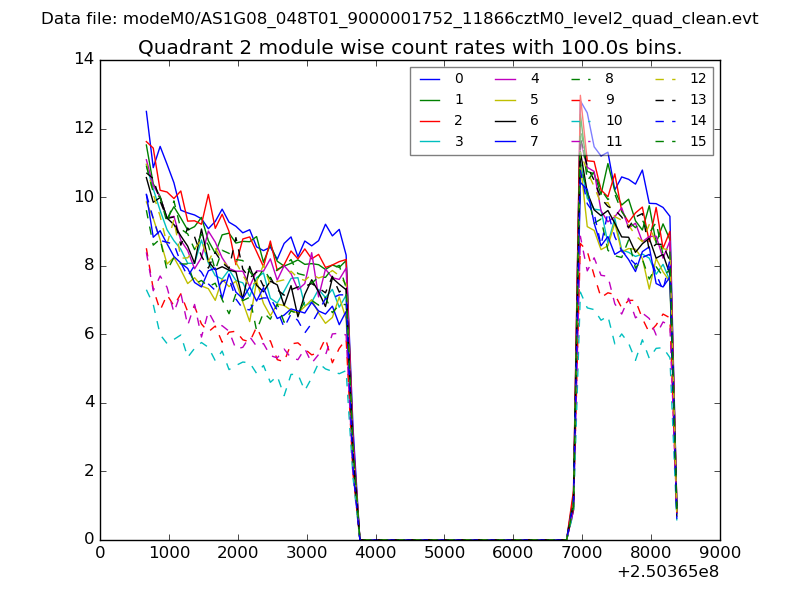 |
 |
| Module-wise count rates for Quadrant D Data is divided into 100 sec bins |
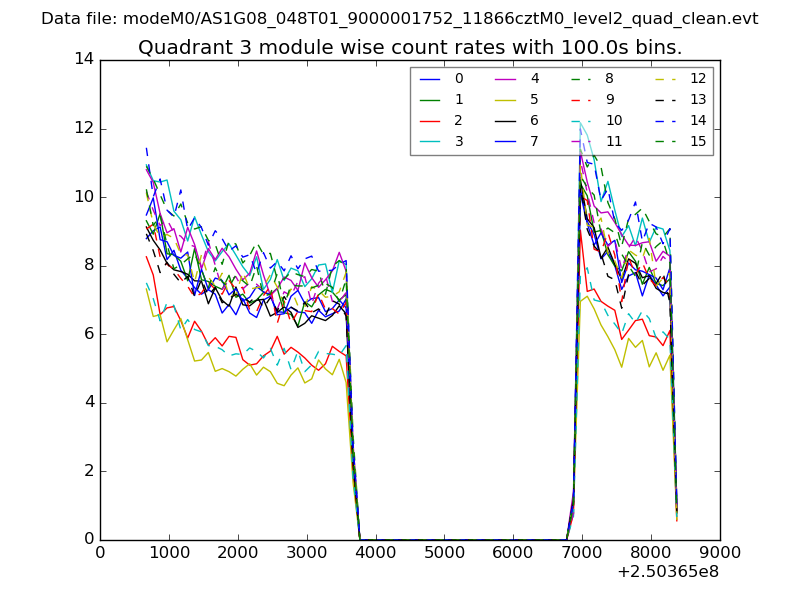 |
 |
| Parameter | Plot |
|---|---|
| CZT HV Monitor | 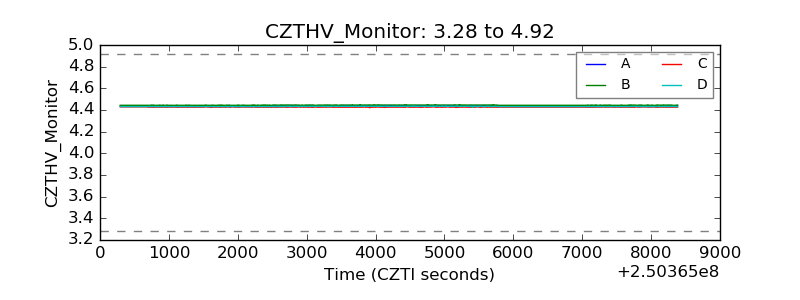 |
| D_VDD | 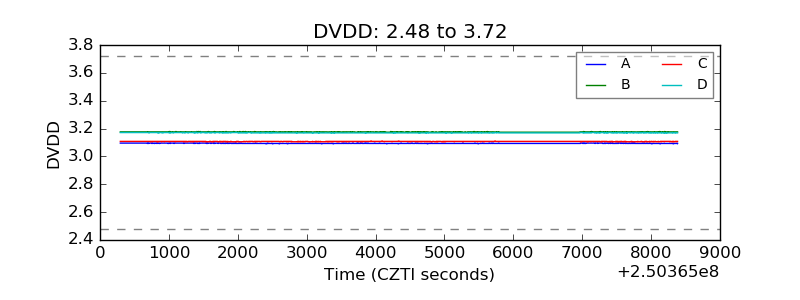 |
| Temperature 1 | 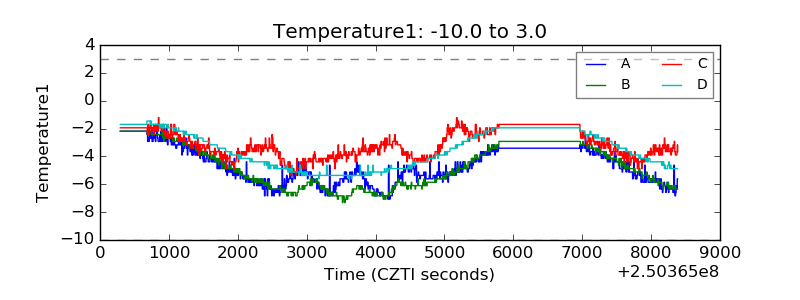 |
| Veto HV Monitor | 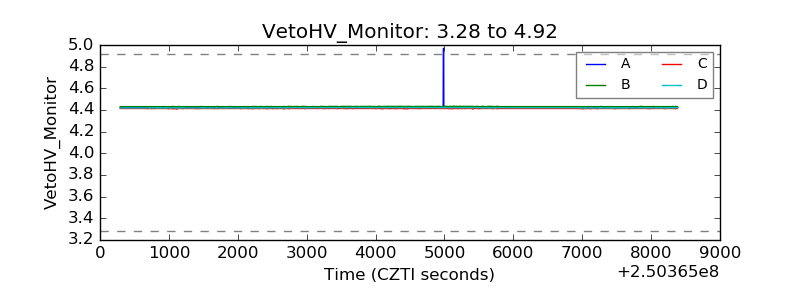 |
| Veto LLD | 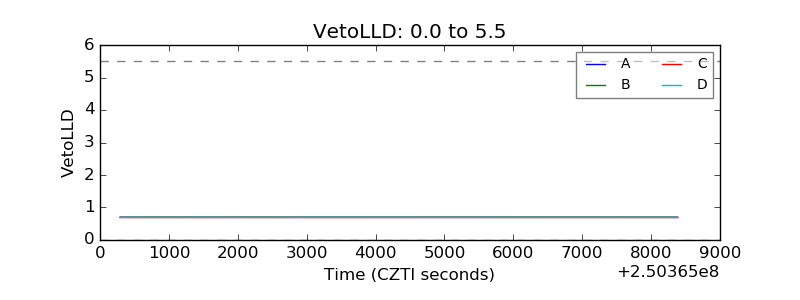 |
| Alpha Counter | 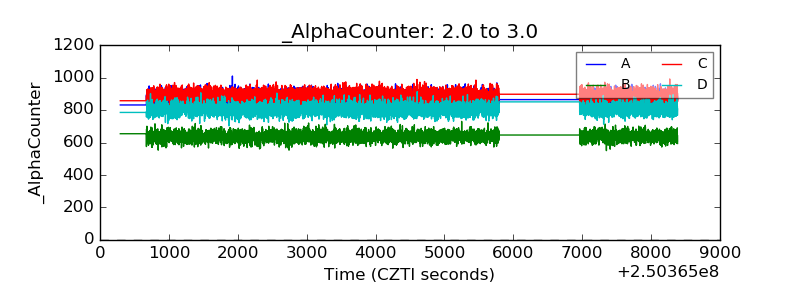 |
| _CPM_Rate | 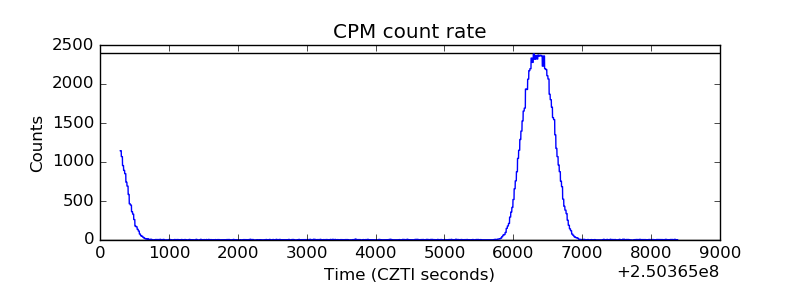 |
| CZT Counter | 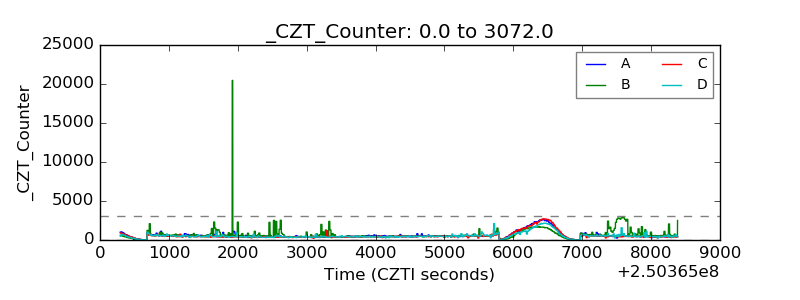 |
| +2.5 Volts monitor |  |
| +5 Volts monitor |  |
| _ROLL_ROT | 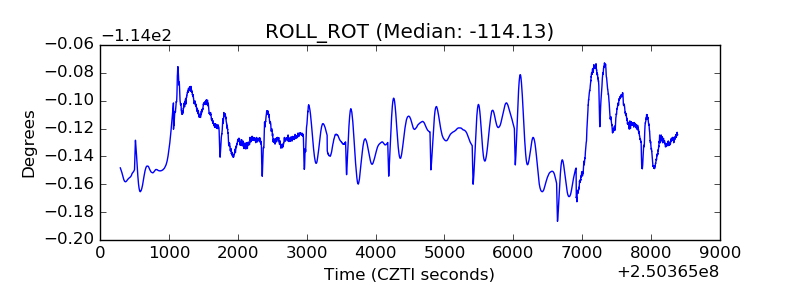 |
| _Roll_DEC | 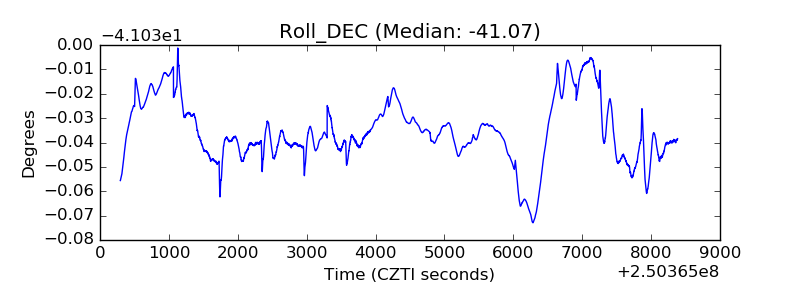 |
| _Roll_RA | 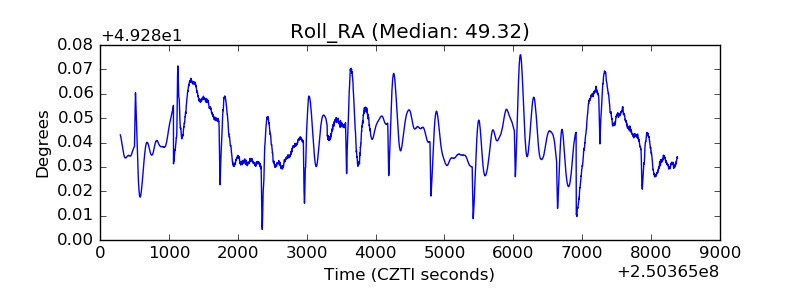 |
| Veto Counter | 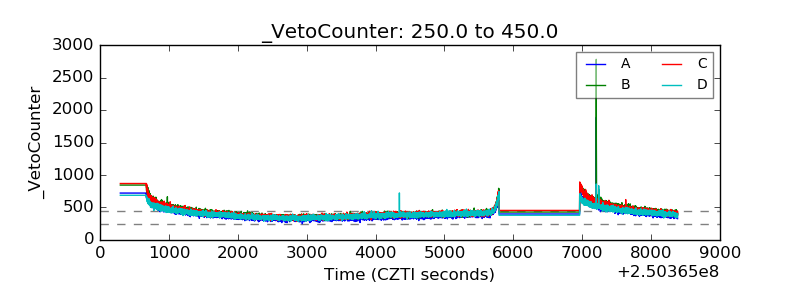 |