| Param | Original file | Final file |
|---|---|---|
| Filename | modeM0/AS1G08_048T01_9000001752_11868cztM0_level2.evt | modeM0/AS1G08_048T01_9000001752_11868cztM0_level2_quad_clean.evt |
| Size (bytes) | 798,071,040 | 137,540,160 |
| Size | 761.1 MB | 131.2 MB |
| Events in quadrant A | 5,432,911 | 878,744 |
| Events in quadrant B | 6,952,113 | 855,491 |
| Events in quadrant C | 4,887,997 | 866,206 |
| Events in quadrant D | 6,162,211 | 813,723 |
| Mode M0 | |||
|---|---|---|---|
| Quadrant | BADHDUFLAG | Total packets | Discarded packets |
| A | 0 | 23220 | 2 |
| B | 0 | 27760 | 2 |
| C | 0 | 22048 | 2 |
| D | 0 | 25723 | 2 |
| Mode SS | |||
|---|---|---|---|
| Quadrant | BADHDUFLAG | Total packets | Discarded packets |
| A | 0 | 220 | 0 |
| B | 0 | 220 | 0 |
| C | 0 | 220 | 0 |
| D | 0 | 220 | 0 |
| Mode M9 | |||
|---|---|---|---|
| Quadrant | BADHDUFLAG | Total packets | Discarded packets |
| A | 0 | 25 | 0 |
| B | 0 | 25 | 0 |
| C | 0 | 25 | 0 |
| D | 0 | 25 | 0 |
| Quadrant | Total seconds | Saturated seconds | Saturation percentage |
|---|---|---|---|
| A | 10852 | 67 | 0.617398% |
| B | 10852 | 578 | 5.326207% |
| C | 10852 | 16 | 0.147438% |
| D | 10852 | 196 | 1.806119% |
Noise dominated data is calculated using 1-second bins in cleaned event files. If a bin has >2000 counts, and if more than 50% of those come from <1% of pixels, then it is considered to be noise-dominated and hence unusable.
| Quadrant | # 1 sec bins | Bins with >0 counts | Bins with >2000 counts | High rate bins dominated by noise | Noise dominated (total time) | Noise dominated (detector-on time) | Marked lightcurve |
|---|---|---|---|---|---|---|---|
| A | 13318 | 10855 | 2 | 2 | 0.02% | 0.02% | 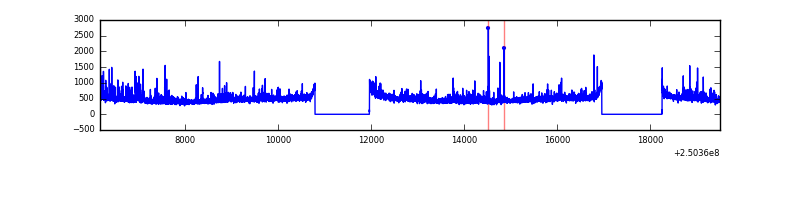 |
| B | 13318 | 10855 | 373 | 373 | 2.80% | 3.44% |  |
| C | 13318 | 10855 | 0 | 0 | 0.00% | 0.00% | 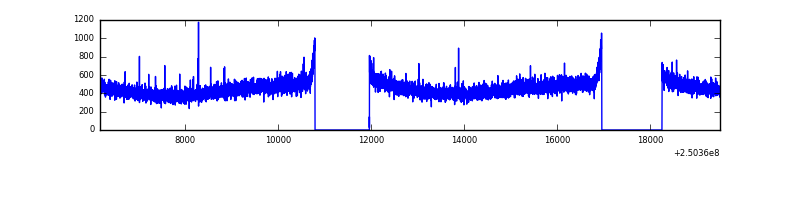 |
| D | 13318 | 10855 | 109 | 109 | 0.82% | 1.00% |  |
Top three noisy pixels from each quadrant. If the there are fewer than three noisy pixels in the level2.evt file, extra rows are filled as -1
| Pixel properties | Quadrant properties | ||||||
|---|---|---|---|---|---|---|---|
| Quadrant | DetID | PixID | Counts | Sigma | Mean | Median | Sigma |
| A | 1 | 162 | 127014 | 487.17 | 1284 | 1259 | 258.1 |
| A | 8 | 15 | 112643 | 431.5 | 1284 | 1259 | 258.1 |
| A | 13 | 251 | 74450 | 283.54 | 1284 | 1259 | 258.1 |
| B | 4 | 239 | 1162249 | 4841.72 | 1270 | 1239 | 239.8 |
| B | 3 | 64 | 518515 | 2157.18 | 1270 | 1239 | 239.8 |
| B | 15 | 185 | 68457 | 280.32 | 1270 | 1239 | 239.8 |
| C | 13 | 61 | 9156 | 27.45 | 1252 | 1261 | 287.6 |
| C | 12 | 4 | 3928 | 9.27 | 1252 | 1261 | 287.6 |
| C | 14 | 234 | 3640 | 8.27 | 1252 | 1261 | 287.6 |
| D | 1 | 52 | 860177 | 2937.59 | 1222 | 1189 | 292.4 |
| D | 8 | 195 | 381638 | 1301.07 | 1222 | 1189 | 292.4 |
| D | 13 | 104 | 86007 | 290.06 | 1222 | 1189 | 292.4 |
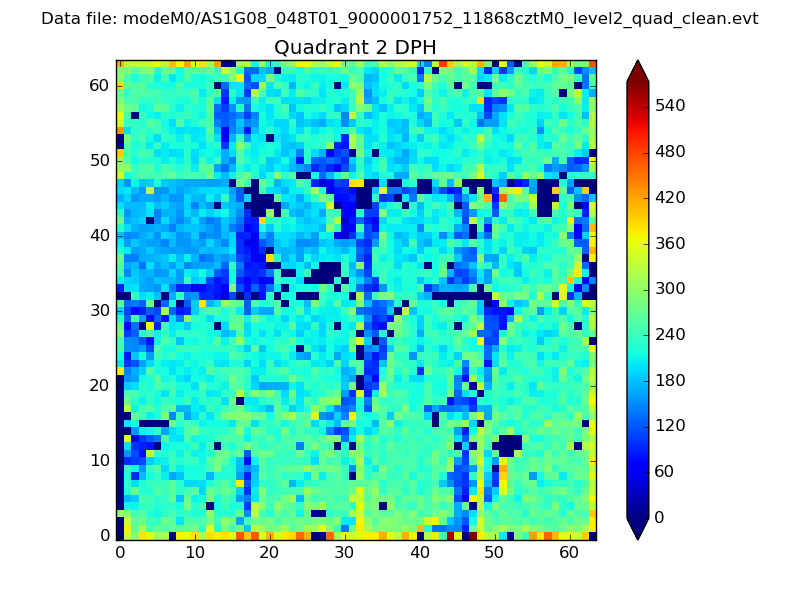
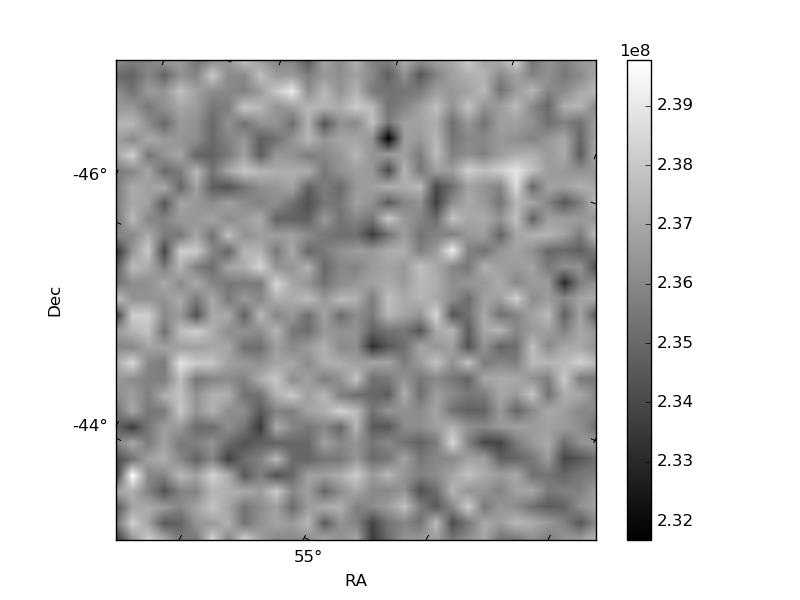
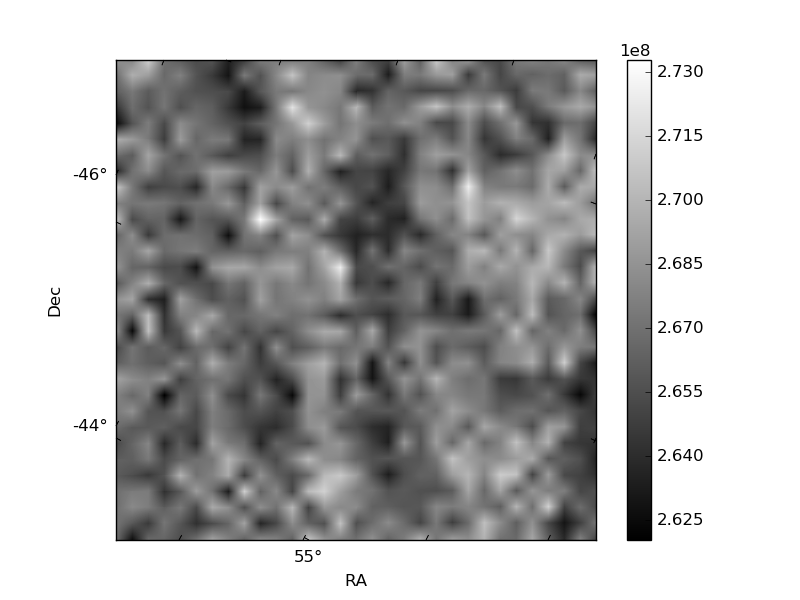
Histogram calculated using DETX and DETY for each event in the final _common_clean file
| Quadrant A | 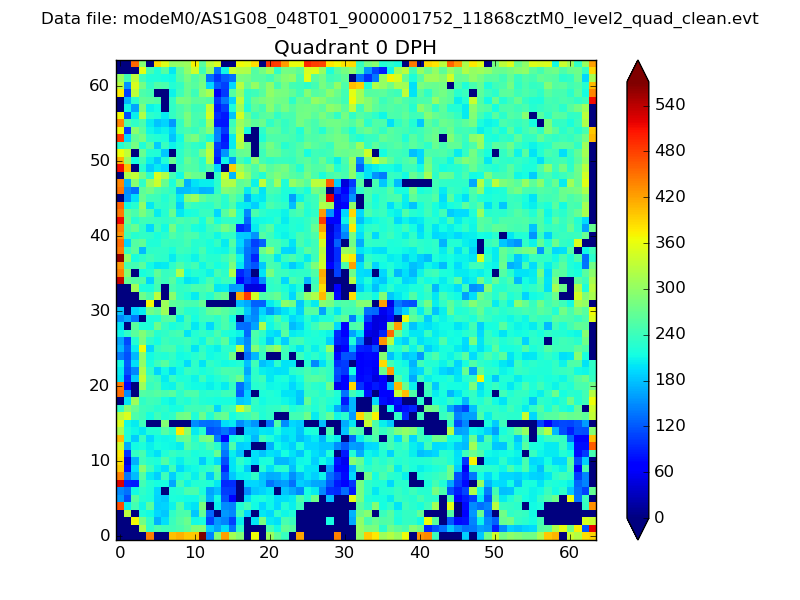 |
 |
Quadrant B |
|---|---|---|---|
| Quadrant D | 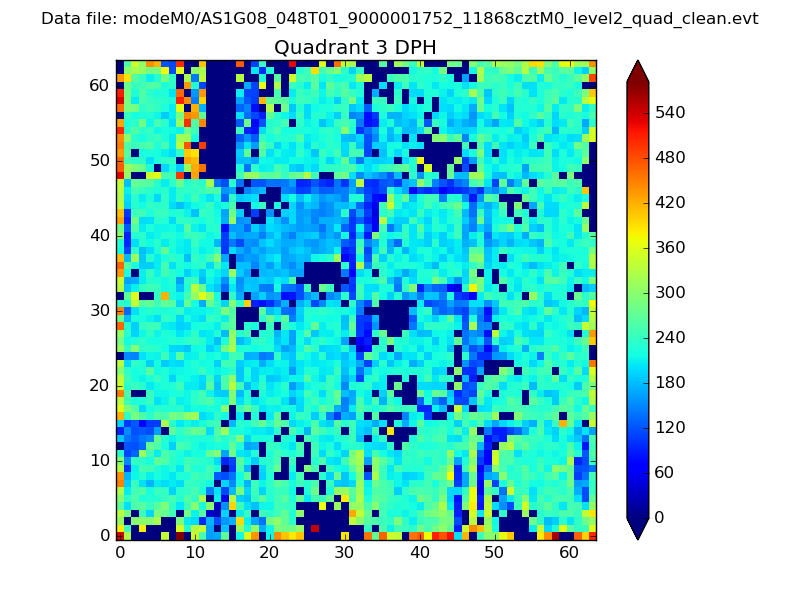 |
 |
Quadrant C |
| Plot type | Count rate plots | Images |
|---|---|---|
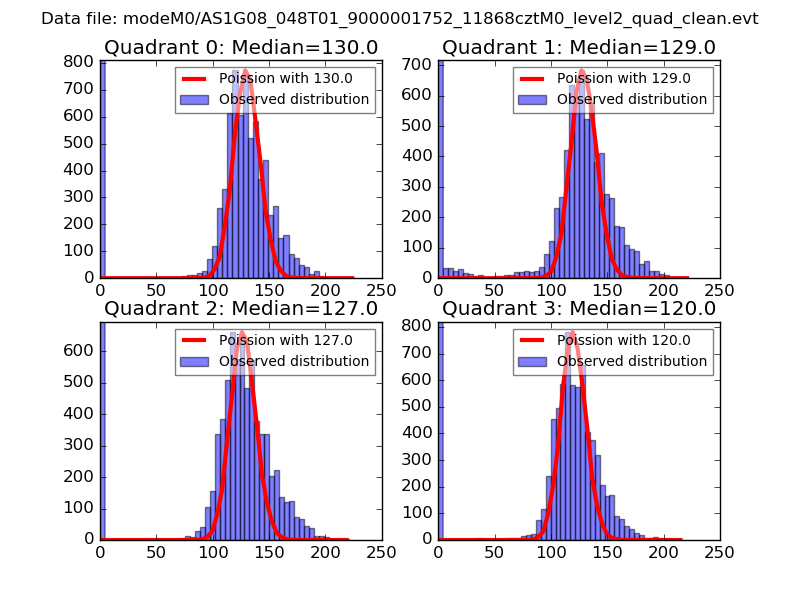
| Comparison with Poisson distribution Blue bars denote a histogram of data divided into 1 sec bins. Red curve is a Poisson curve with rate = median count rate of data. |
 |
 |
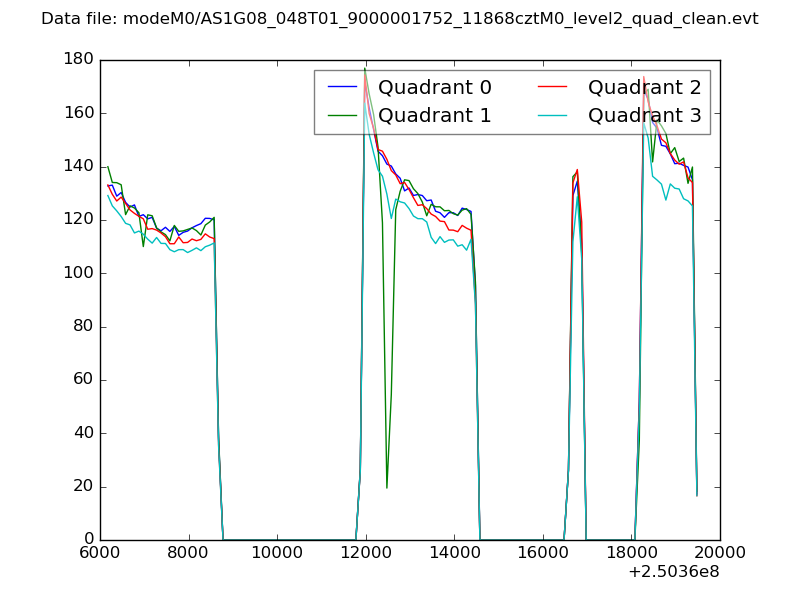
| Quadrant-wise count rates Data is divided into 100 sec bins |
 |
|
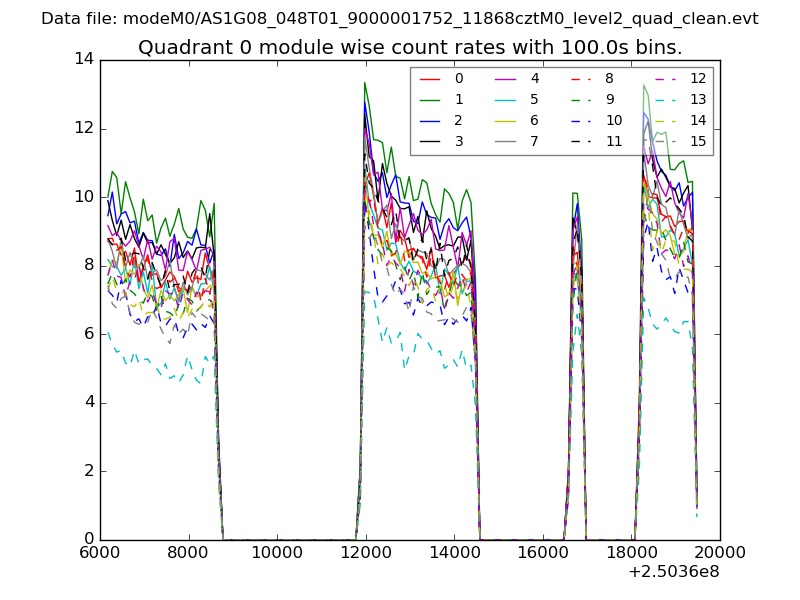
| Module-wise count rates for Quadrant A Data is divided into 100 sec bins |
 |
 |
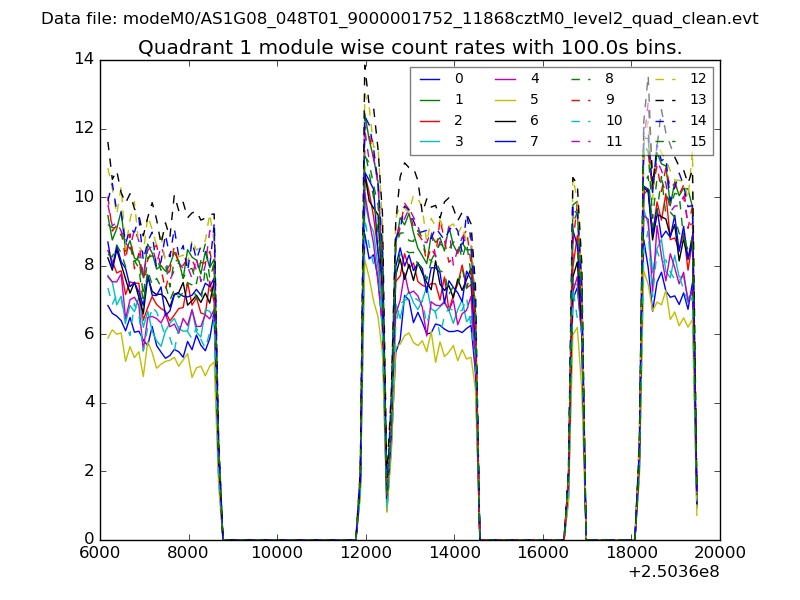
| Module-wise count rates for Quadrant B Data is divided into 100 sec bins |
 |
 |
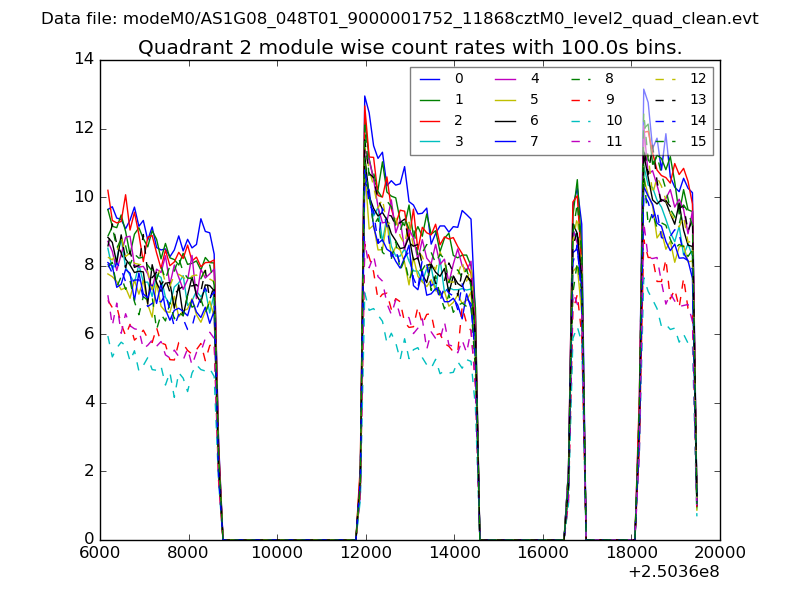
| Module-wise count rates for Quadrant C Data is divided into 100 sec bins |
 |
 |
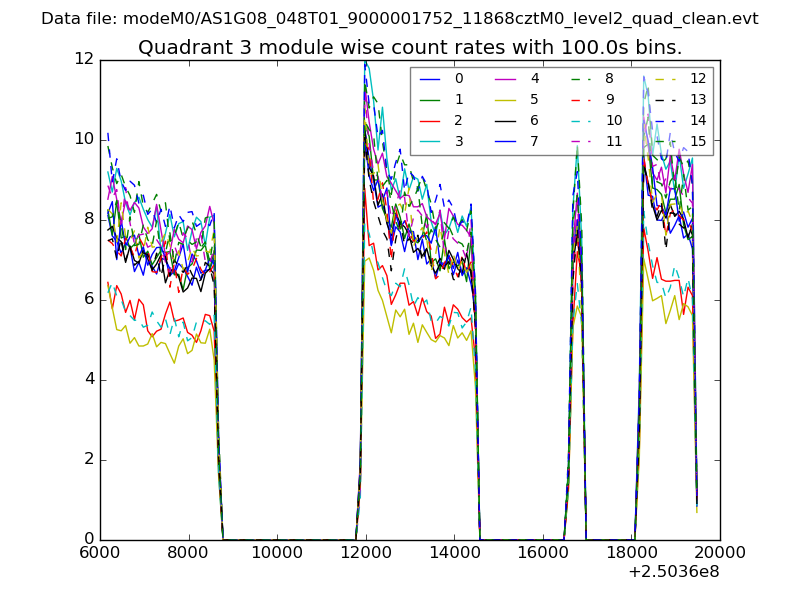
| Module-wise count rates for Quadrant D Data is divided into 100 sec bins |
 |
 |
| Parameter | Plot |
|---|---|
| CZT HV Monitor | 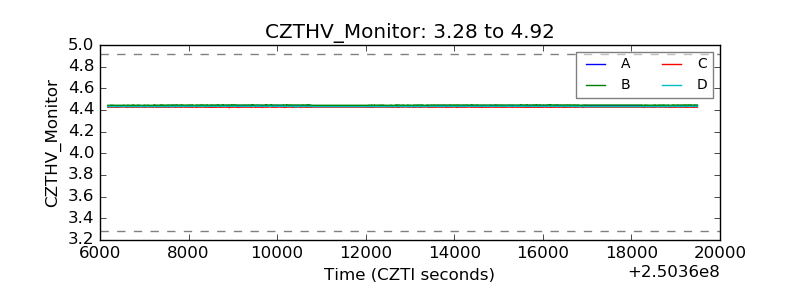 |
| D_VDD | 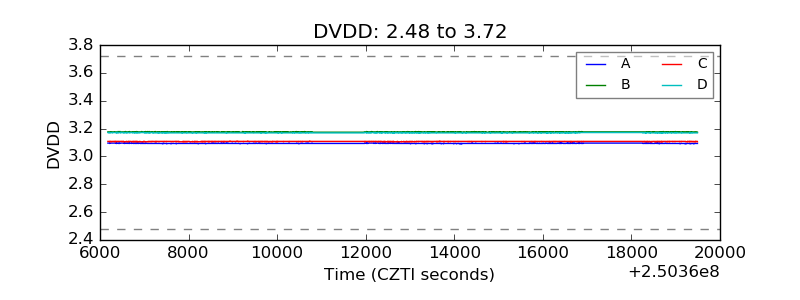 |
| Temperature 1 |  |
| Veto HV Monitor | 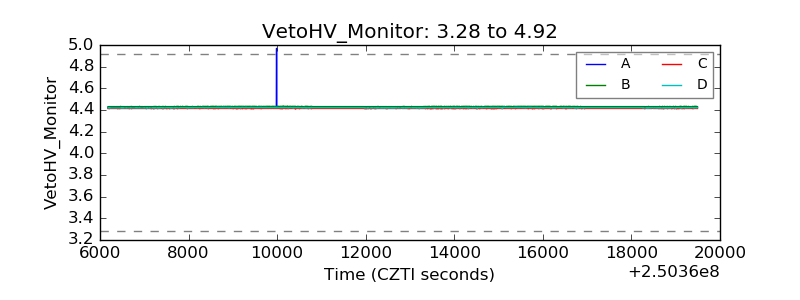 |
| Veto LLD | 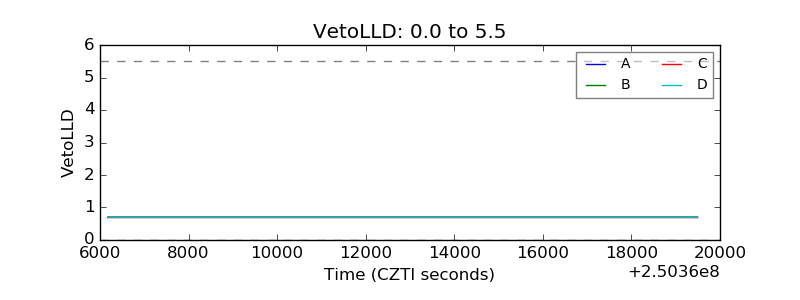 |
| Alpha Counter | 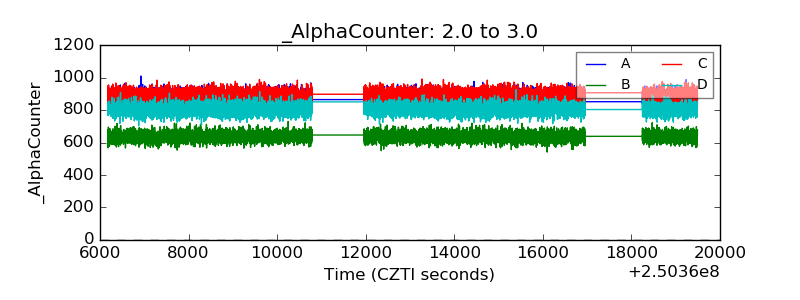 |
| _CPM_Rate | 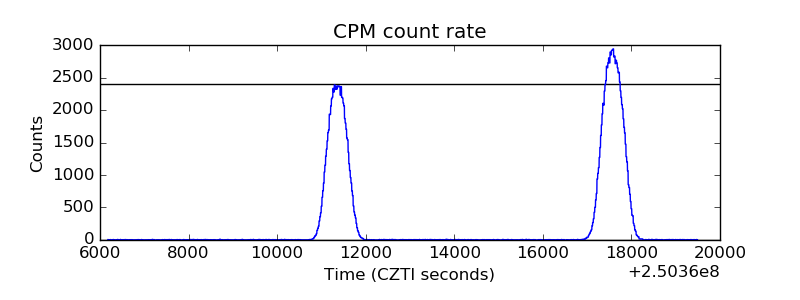 |
| CZT Counter | 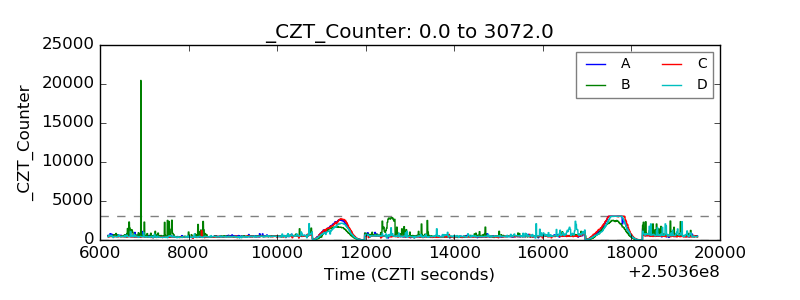 |
| +2.5 Volts monitor |  |
| +5 Volts monitor |  |
| _ROLL_ROT | 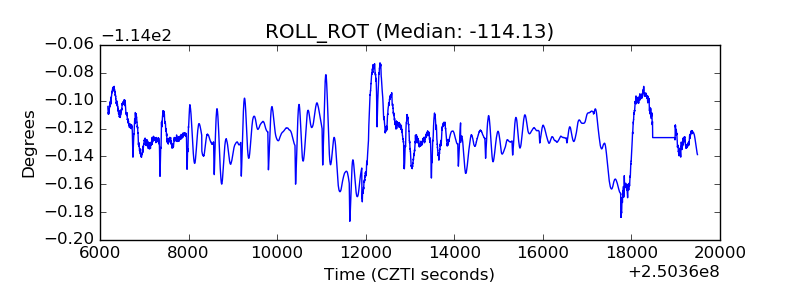 |
| _Roll_DEC | 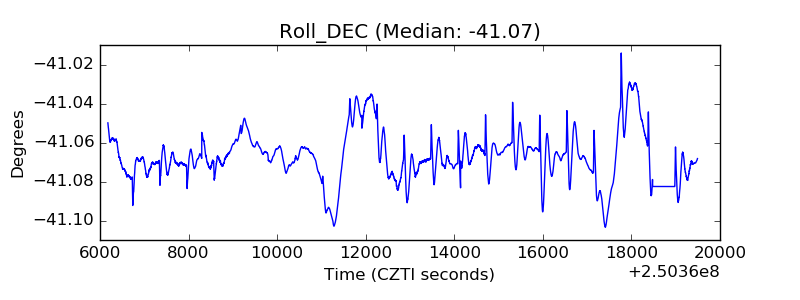 |
| _Roll_RA | 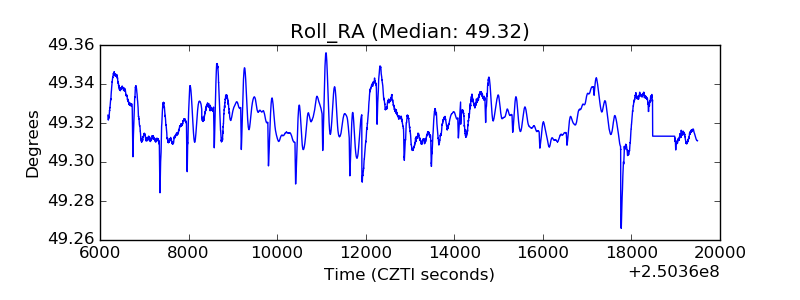 |
| Veto Counter | 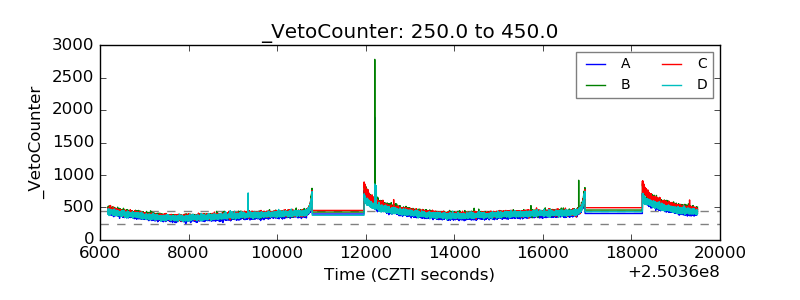 |