| Param | Original file | Final file |
|---|---|---|
| Filename | modeM0/AS1A04_145T01_9000001756cztM0_level2.fits | modeM0/AS1A04_145T01_9000001756cztM0_level2_quad_clean.evt |
| Size (bytes) | 79,280,640 | 67,069,440 |
| Size | 75.6 MB | 64.0 MB |
| Events in quadrant A | 472,494 | 380,566 |
| Events in quadrant B | 449,236 | 366,673 |
| Events in quadrant C | 472,940 | 361,377 |
| Events in quadrant D | 388,674 | 304,573 |
| Mode M0 | |||
|---|---|---|---|
| Quadrant | BADHDUFLAG | Total packets | Discarded packets |
| A | 0 | 18976 | 0 |
| B | 0 | 22229 | 0 |
| C | 0 | 18262 | 0 |
| D | 0 | 29934 | 0 |
| Mode SS | |||
|---|---|---|---|
| Quadrant | BADHDUFLAG | Total packets | Discarded packets |
| A | 0 | 178 | 0 |
| B | 0 | 178 | 0 |
| C | 0 | 178 | 0 |
| D | 0 | 178 | 0 |
| Quadrant | Total seconds | Saturated seconds | Saturation percentage |
|---|---|---|---|
| A | 8890 | 286 | 3.217098% |
| B | 8890 | 591 | 6.647919% |
| C | 8890 | 167 | 1.878515% |
| D | 8890 | 824 | 9.268841% |
Noise dominated data is calculated using 1-second bins in cleaned event files. If a bin has >2000 counts, and if more than 50% of those come from <1% of pixels, then it is considered to be noise-dominated and hence unusable.
| Quadrant | # 1 sec bins | Bins with >0 counts | Bins with >2000 counts | High rate bins dominated by noise | Noise dominated (total time) | Noise dominated (detector-on time) | Marked lightcurve |
|---|---|---|---|---|---|---|---|
| A | 8890 | 8890 | 0 | 0 | 0.00% | 0.00% |  |
| B | 8889 | 8887 | 0 | 0 | 0.00% | 0.00% |  |
| C | 8889 | 8889 | 0 | 0 | 0.00% | 0.00% | 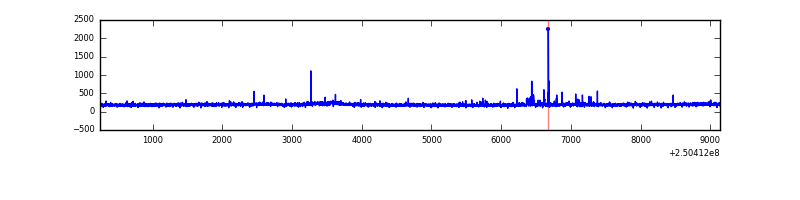 |
| D | 8890 | 8889 | 0 | 0 | 0.00% | 0.00% | 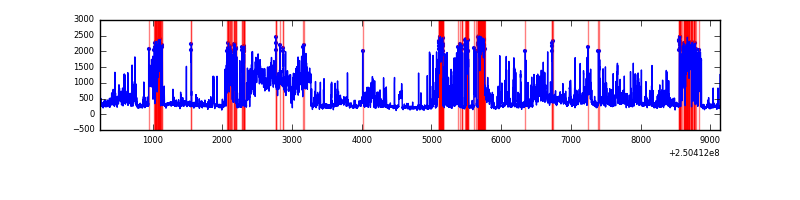 |
Top three noisy pixels from each quadrant. If the there are fewer than three noisy pixels in the level2.evt file, extra rows are filled as -1
| Pixel properties | Quadrant properties | ||||||
|---|---|---|---|---|---|---|---|
| Quadrant | DetID | PixID | Counts | Sigma | Mean | Median | Sigma |
| A | 0 | 29 | 476 | 10.78 | 122 | 115 | 33.5 |
| A | 14 | 188 | 462 | 10.36 | 122 | 115 | 33.5 |
| A | 14 | 204 | 414 | 8.93 | 122 | 115 | 33.5 |
| B | 2 | 9 | 382 | 10.2 | 119 | 113 | 26.4 |
| B | 14 | 254 | 334 | 8.38 | 119 | 113 | 26.4 |
| B | 3 | 17 | 296 | 6.94 | 119 | 113 | 26.4 |
| C | 3 | 126 | 374 | 7.62 | 124 | 115 | 34.0 |
| C | 12 | 241 | 372 | 7.56 | 124 | 115 | 34.0 |
| C | 2 | 191 | 364 | 7.33 | 124 | 115 | 34.0 |
| D | 3 | 14 | 305 | 6.42 | 111 | 101 | 31.8 |
| D | 6 | 231 | 296 | 6.13 | 111 | 101 | 31.8 |
| D | 7 | 5 | 291 | 5.98 | 111 | 101 | 31.8 |
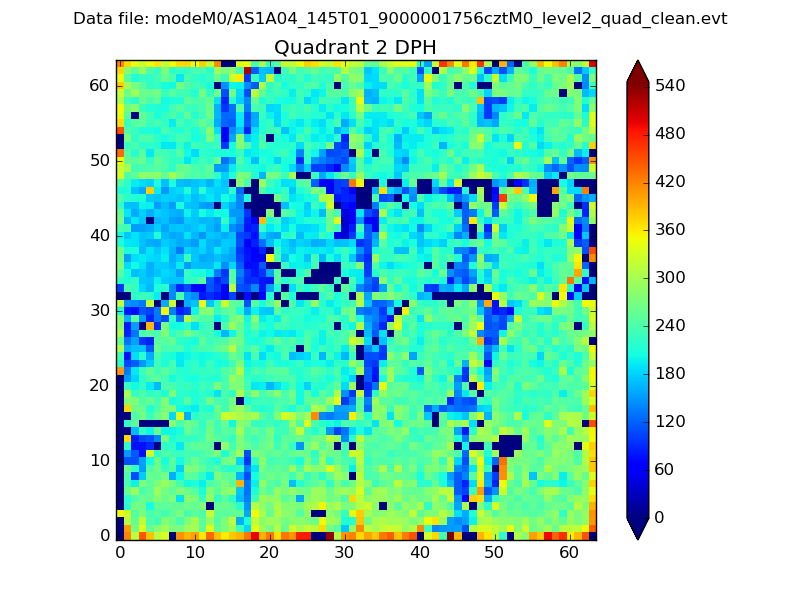
Histogram calculated using DETX and DETY for each event in the final _common_clean file
| Quadrant A | 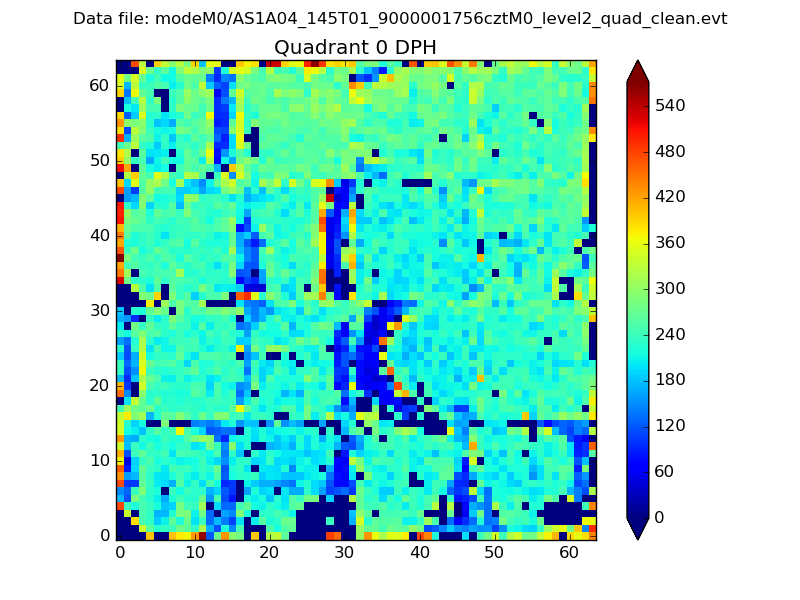 |
 |
Quadrant B |
|---|---|---|---|
| Quadrant D |  |
 |
Quadrant C |
| Plot type | Count rate plots | Images |
|---|---|---|
| Comparison with Poisson distribution Blue bars denote a histogram of data divided into 1 sec bins. Red curve is a Poisson curve with rate = median count rate of data. |
 |
 |
| Quadrant-wise count rates Data is divided into 100 sec bins |
 |
|
| Module-wise count rates for Quadrant A Data is divided into 100 sec bins |
 |
 |
| Module-wise count rates for Quadrant B Data is divided into 100 sec bins |
 |
 |
| Module-wise count rates for Quadrant C Data is divided into 100 sec bins |
 |
 |
| Module-wise count rates for Quadrant D Data is divided into 100 sec bins |
 |
 |
| Parameter | Plot |
|---|---|
| CZT HV Monitor |  |
| D_VDD | 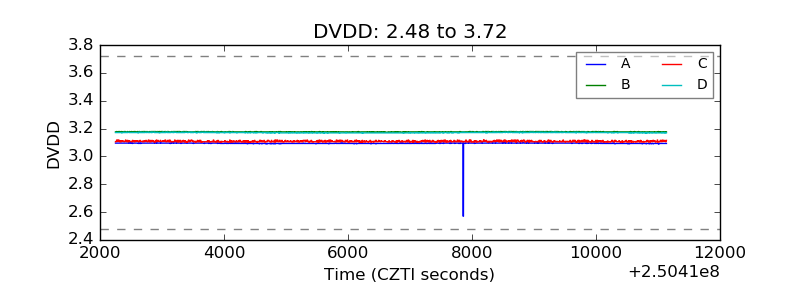 |
| Temperature 1 | 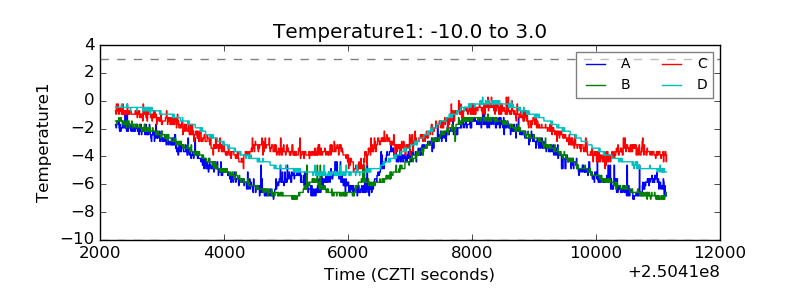 |
| Veto HV Monitor |  |
| Veto LLD |  |
| Alpha Counter |  |
| _CPM_Rate |  |
| CZT Counter |  |
| +2.5 Volts monitor |  |
| +5 Volts monitor |  |
| _ROLL_ROT |  |
| _Roll_DEC |  |
| _Roll_RA |  |
| Veto Counter | 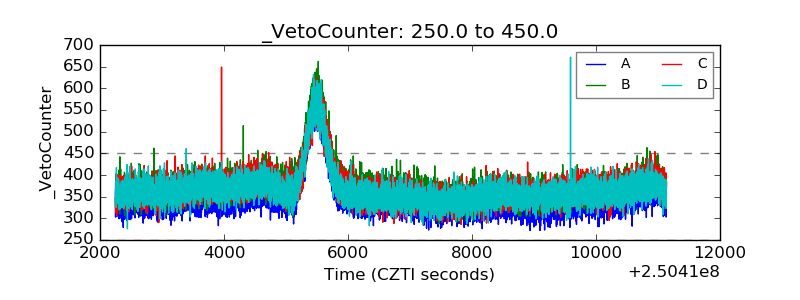 |