| Param | Original file | Final file |
|---|---|---|
| Filename | modeM0/AS1A04_145T01_9000001756_11873cztM0_level2.evt | modeM0/AS1A04_145T01_9000001756_11873cztM0_level2_quad_clean.evt |
| Size (bytes) | 417,746,880 | 66,957,120 |
| Size | 398.4 MB | 63.9 MB |
| Events in quadrant A | 2,444,739 | 431,376 |
| Events in quadrant B | 3,050,012 | 424,556 |
| Events in quadrant C | 2,285,677 | 429,538 |
| Events in quadrant D | 4,532,727 | 392,981 |
| Mode M0 | |||
|---|---|---|---|
| Quadrant | BADHDUFLAG | Total packets | Discarded packets |
| A | 0 | 10661 | 1 |
| B | 0 | 12337 | 0 |
| C | 0 | 10352 | 0 |
| D | 0 | 16813 | 0 |
| Mode SS | |||
|---|---|---|---|
| Quadrant | BADHDUFLAG | Total packets | Discarded packets |
| A | 0 | 100 | 0 |
| B | 0 | 100 | 0 |
| C | 0 | 100 | 0 |
| D | 0 | 100 | 0 |
| Quadrant | Total seconds | Saturated seconds | Saturation percentage |
|---|---|---|---|
| A | 4969 | 276 | 5.554438% |
| B | 4969 | 452 | 9.096398% |
| C | 4969 | 164 | 3.300463% |
| D | 4969 | 515 | 10.364258% |
Noise dominated data is calculated using 1-second bins in cleaned event files. If a bin has >2000 counts, and if more than 50% of those come from <1% of pixels, then it is considered to be noise-dominated and hence unusable.
| Quadrant | # 1 sec bins | Bins with >0 counts | Bins with >2000 counts | High rate bins dominated by noise | Noise dominated (total time) | Noise dominated (detector-on time) | Marked lightcurve |
|---|---|---|---|---|---|---|---|
| A | 4970 | 4970 | 5 | 5 | 0.10% | 0.10% | 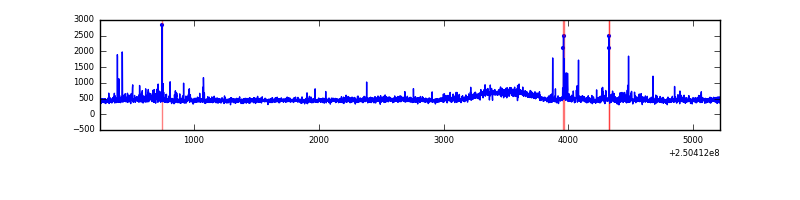 |
| B | 4970 | 4970 | 108 | 108 | 2.17% | 2.17% | 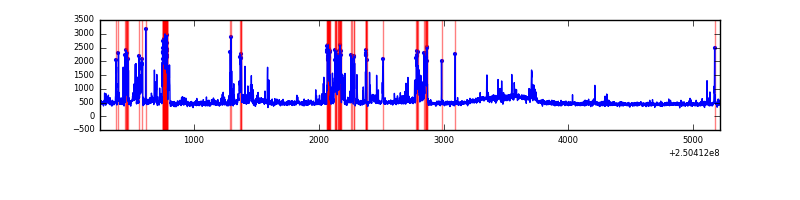 |
| C | 4970 | 4970 | 0 | 0 | 0.00% | 0.00% | 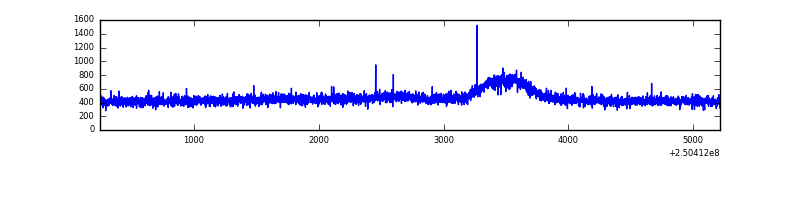 |
| D | 4970 | 4970 | 318 | 318 | 6.40% | 6.40% | 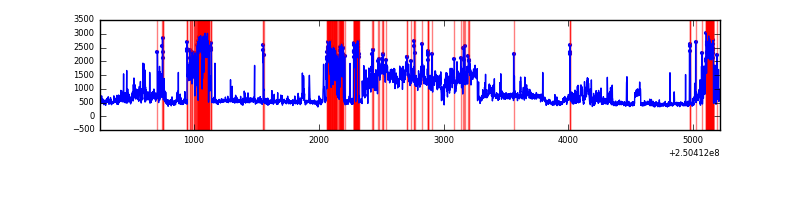 |
Top three noisy pixels from each quadrant. If the there are fewer than three noisy pixels in the level2.evt file, extra rows are filled as -1
| Pixel properties | Quadrant properties | ||||||
|---|---|---|---|---|---|---|---|
| Quadrant | DetID | PixID | Counts | Sigma | Mean | Median | Sigma |
| A | 1 | 162 | 59233 | 484.48 | 586 | 572 | 121.1 |
| A | 1 | 178 | 30751 | 249.25 | 586 | 572 | 121.1 |
| A | 1 | 161 | 26985 | 218.14 | 586 | 572 | 121.1 |
| B | 4 | 239 | 584893 | 5178.59 | 584 | 567 | 112.8 |
| B | 15 | 204 | 73463 | 646.04 | 584 | 567 | 112.8 |
| B | 0 | 85 | 32939 | 286.9 | 584 | 567 | 112.8 |
| C | 8 | 128 | 7449 | 50.74 | 581 | 581 | 135.4 |
| C | 8 | 112 | 4670 | 30.21 | 581 | 581 | 135.4 |
| C | 13 | 61 | 4248 | 27.09 | 581 | 581 | 135.4 |
| D | 13 | 122 | 1403452 | 10260.43 | 562 | 543 | 136.7 |
| D | 1 | 52 | 550680 | 4023.53 | 562 | 543 | 136.7 |
| D | 8 | 195 | 279391 | 2039.41 | 562 | 543 | 136.7 |
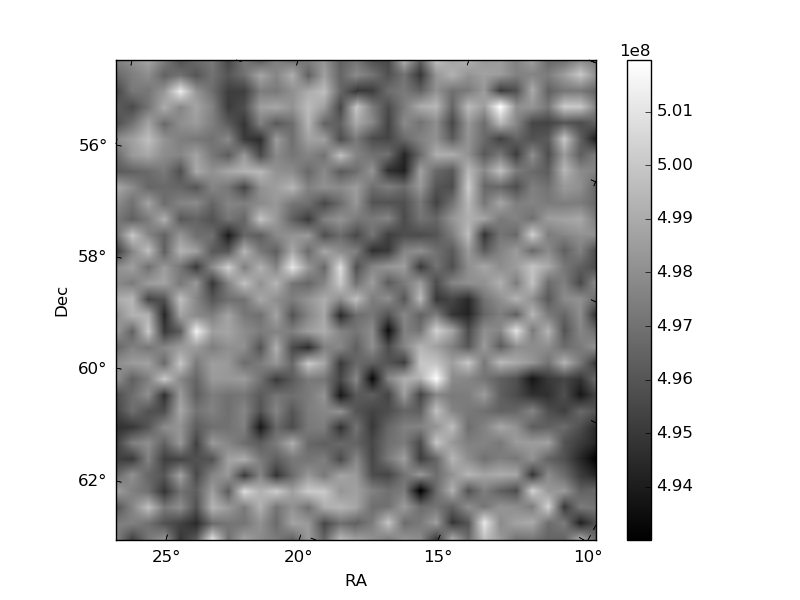
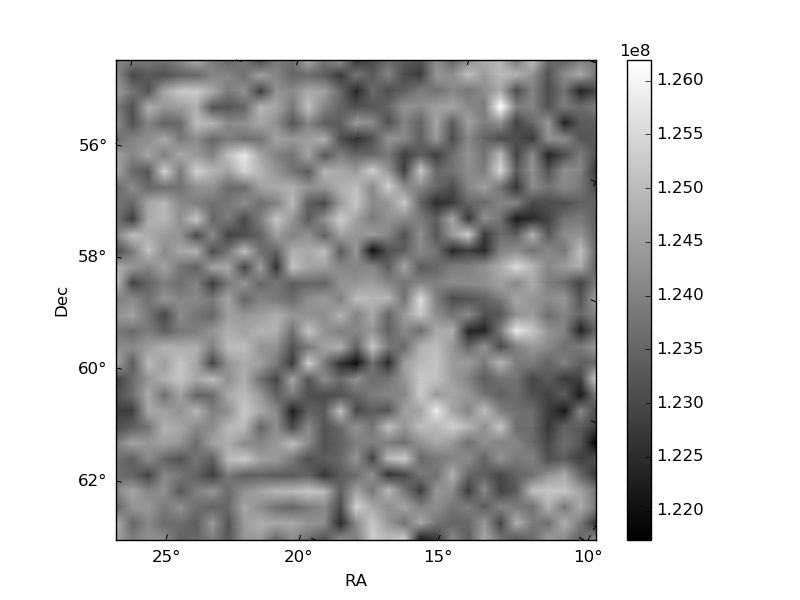
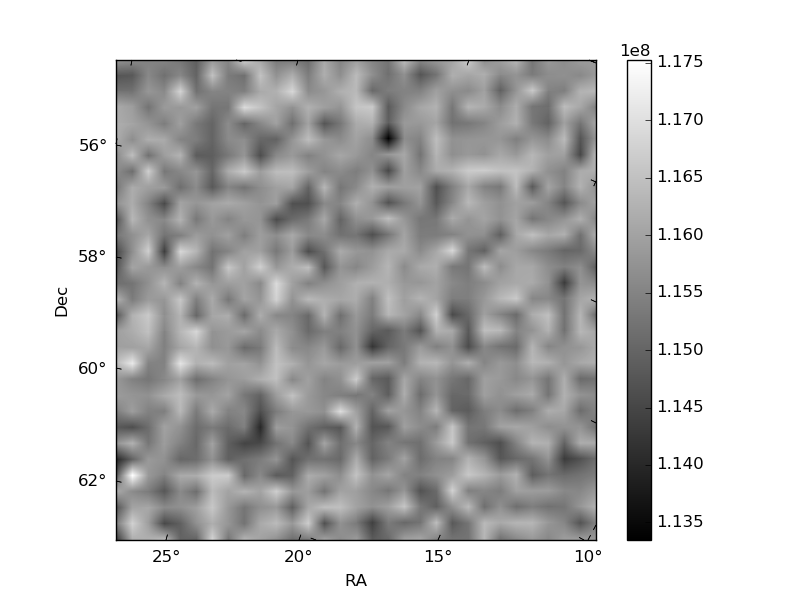
Histogram calculated using DETX and DETY for each event in the final _common_clean file
| Quadrant A | 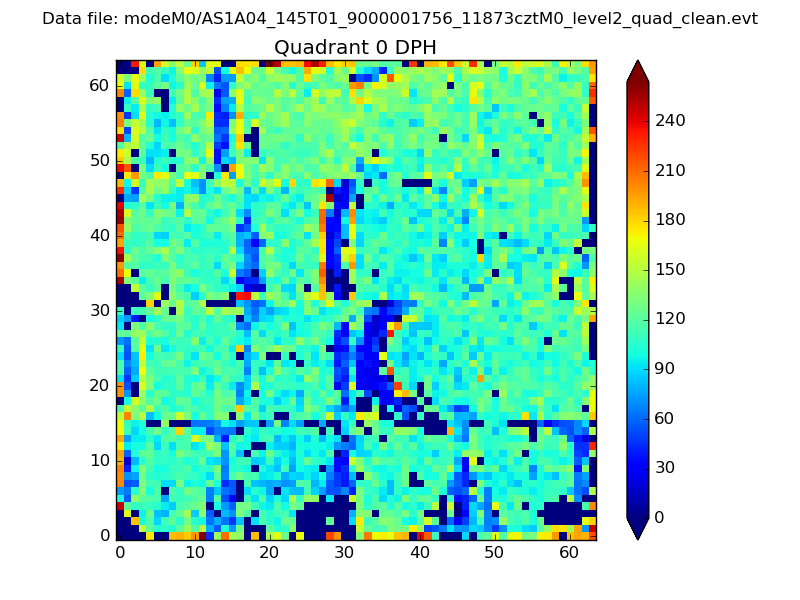 |
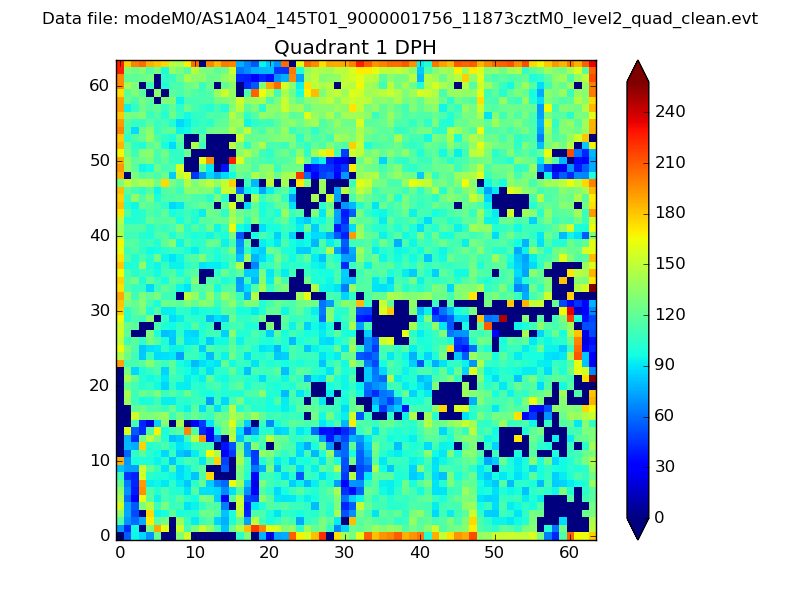 |
Quadrant B |
|---|---|---|---|
| Quadrant D | 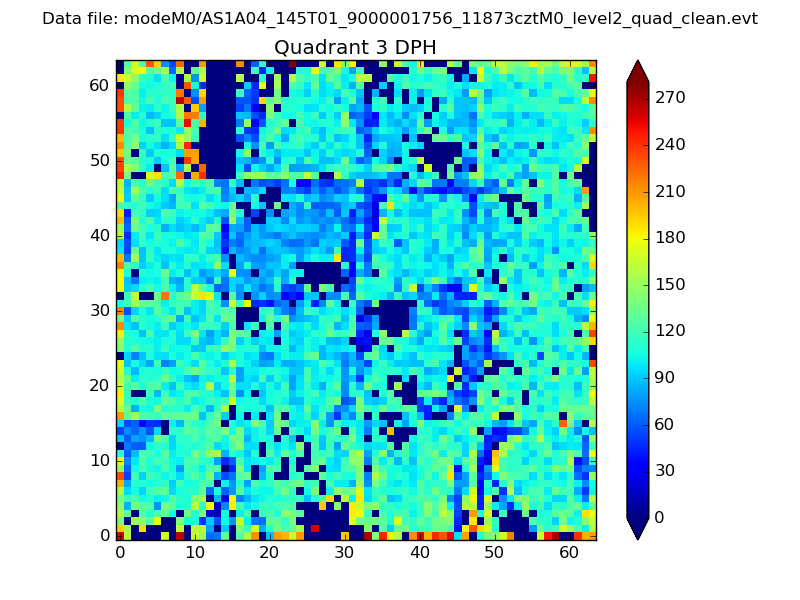 |
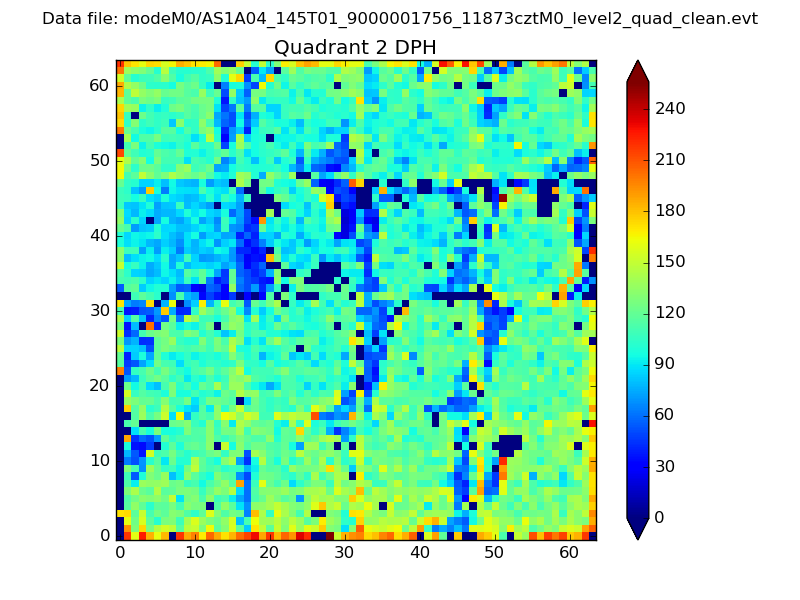 |
Quadrant C |
| Plot type | Count rate plots | Images |
|---|---|---|
| Comparison with Poisson distribution Blue bars denote a histogram of data divided into 1 sec bins. Red curve is a Poisson curve with rate = median count rate of data. |
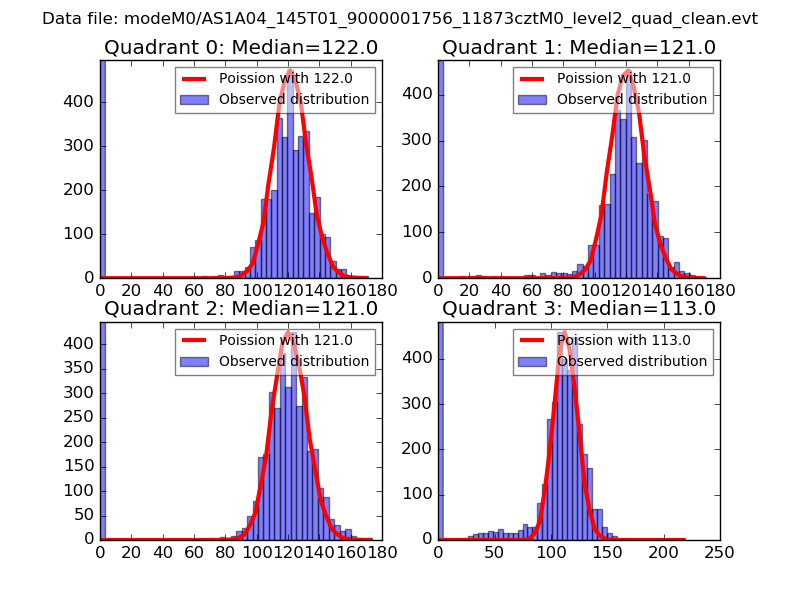 |
 |
| Quadrant-wise count rates Data is divided into 100 sec bins |
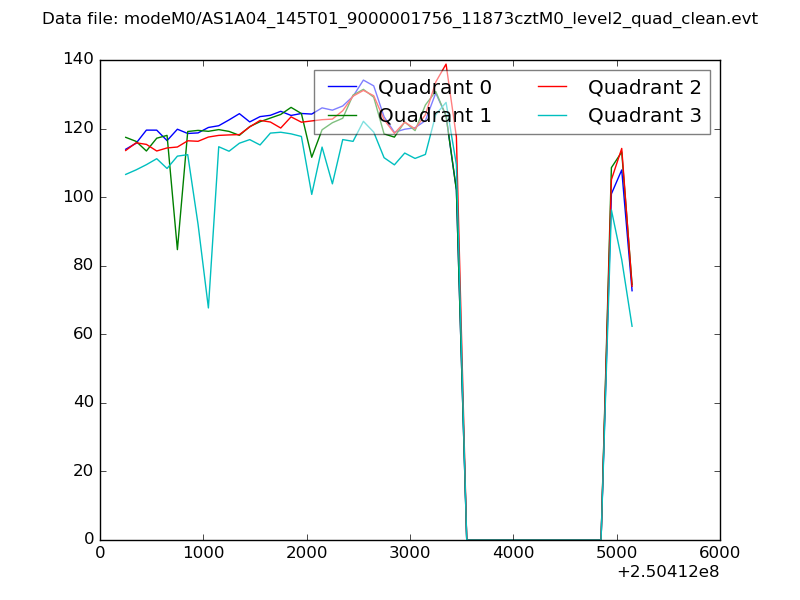 |
|
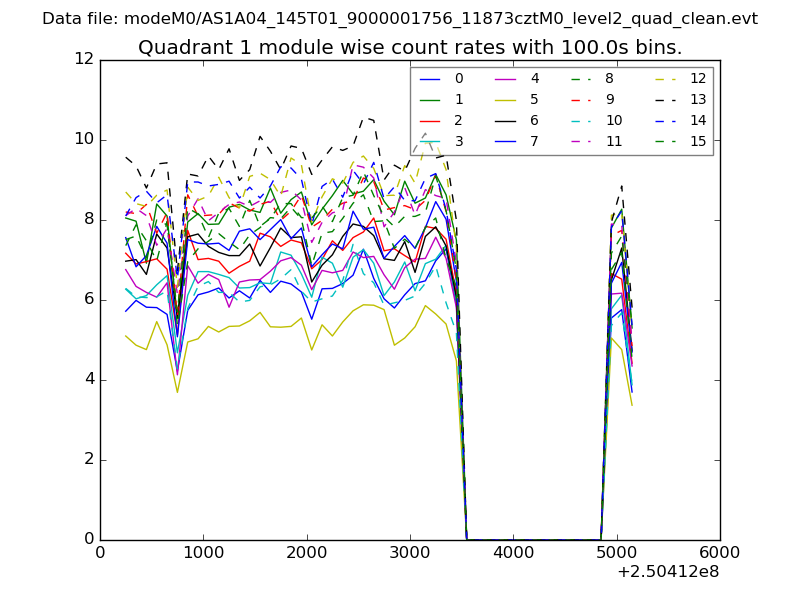
| Module-wise count rates for Quadrant A Data is divided into 100 sec bins |
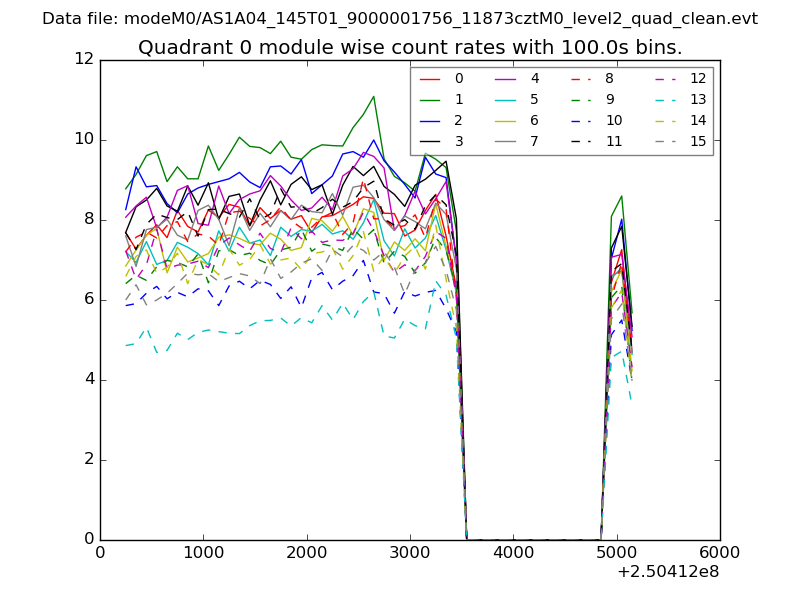 |
 |
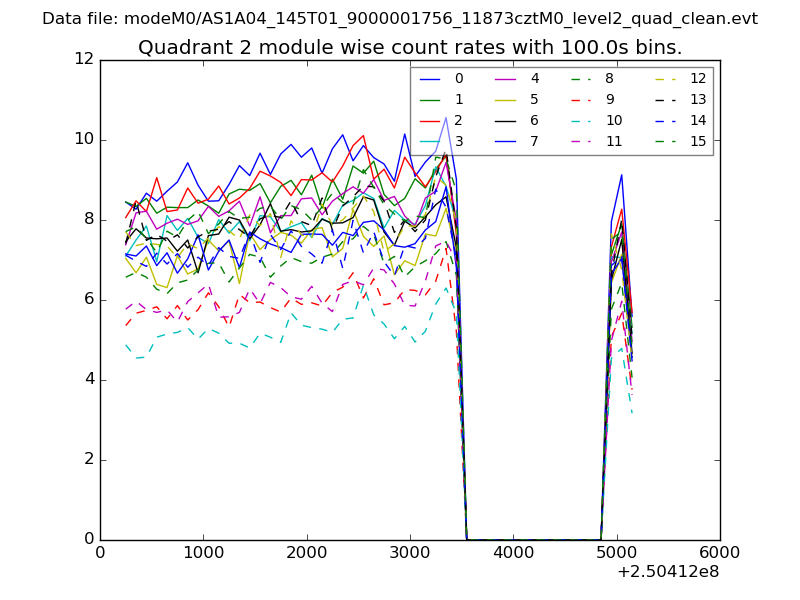
| Module-wise count rates for Quadrant B Data is divided into 100 sec bins |
 |
 |
| Module-wise count rates for Quadrant C Data is divided into 100 sec bins |
 |
 |
| Module-wise count rates for Quadrant D Data is divided into 100 sec bins |
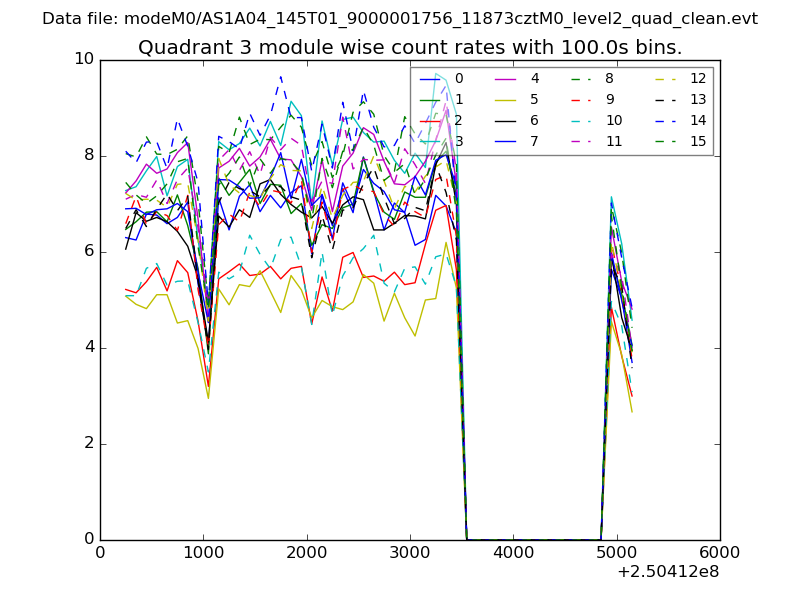 |
 |
| Parameter | Plot |
|---|---|
| CZT HV Monitor | 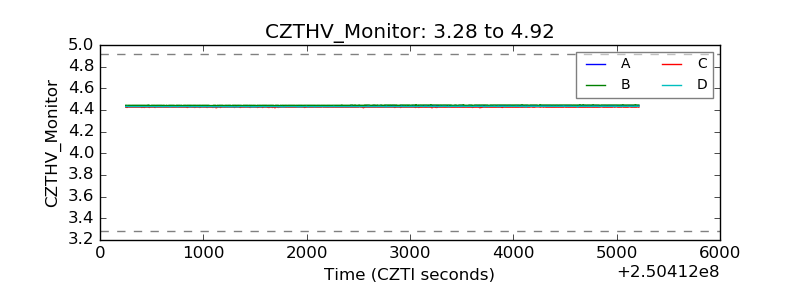 |
| D_VDD | 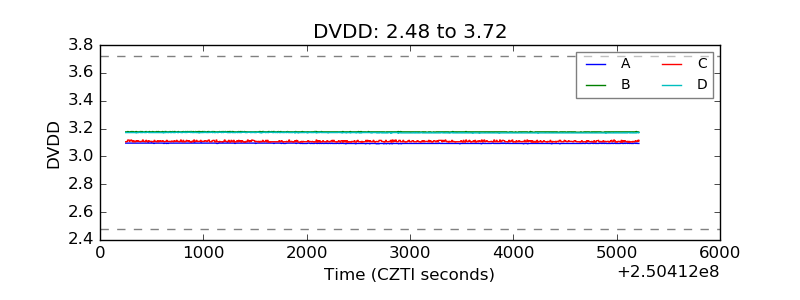 |
| Temperature 1 | 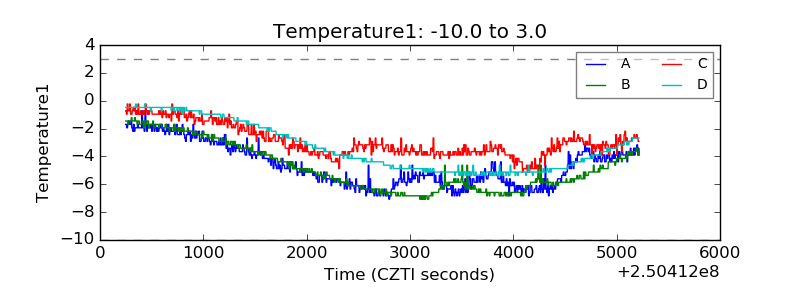 |
| Veto HV Monitor | 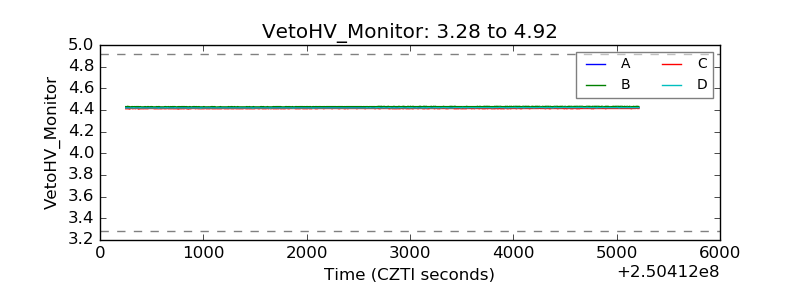 |
| Veto LLD | 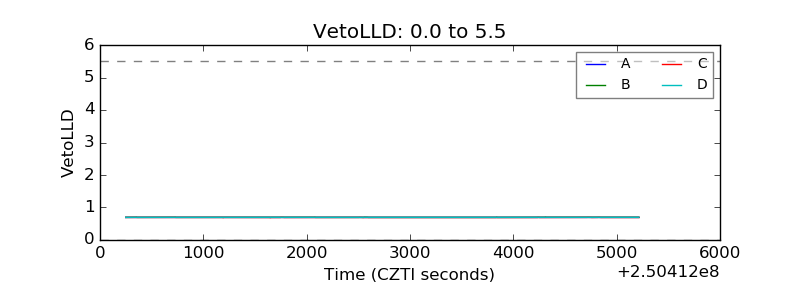 |
| Alpha Counter | 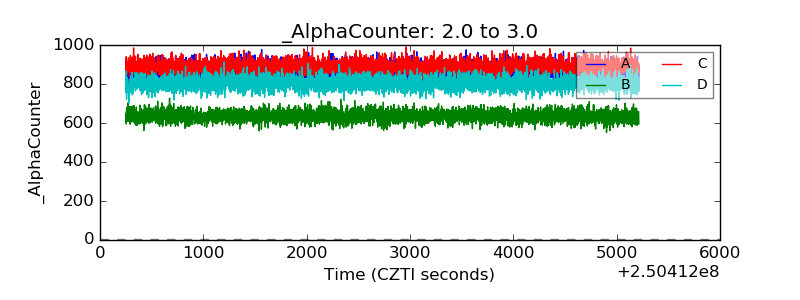 |
| _CPM_Rate | 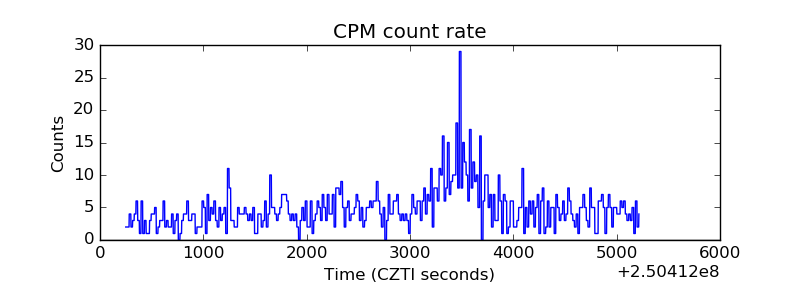 |
| CZT Counter | 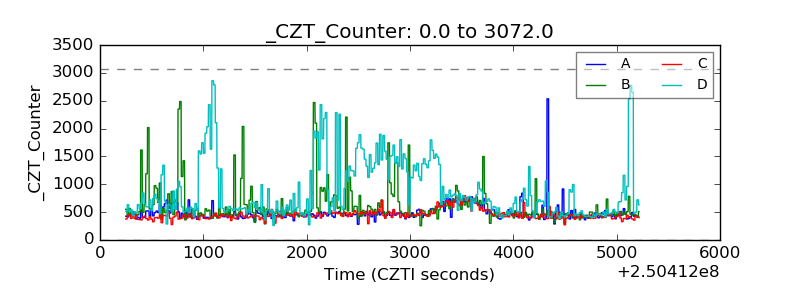 |
| +2.5 Volts monitor |  |
| +5 Volts monitor |  |
| _ROLL_ROT | 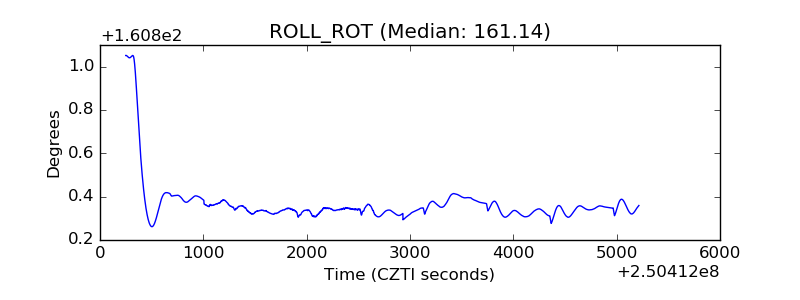 |
| _Roll_DEC | 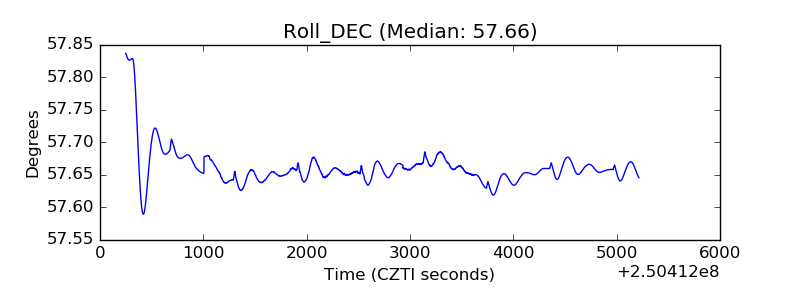 |
| _Roll_RA |  |
| Veto Counter | 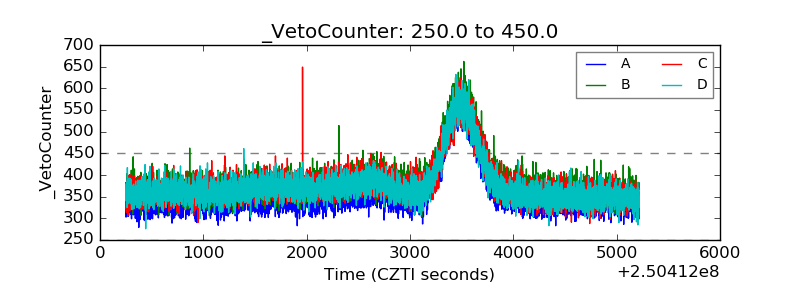 |