| Param | Original file | Final file |
|---|---|---|
| Filename | modeM0/AS1A04_145T01_9000001756_11874cztM0_level2.evt | modeM0/AS1A04_145T01_9000001756_11874cztM0_level2_quad_clean.evt |
| Size (bytes) | 454,668,480 | 77,040,000 |
| Size | 433.6 MB | 73.5 MB |
| Events in quadrant A | 2,827,625 | 498,318 |
| Events in quadrant B | 3,337,113 | 491,707 |
| Events in quadrant C | 2,496,401 | 495,011 |
| Events in quadrant D | 4,725,694 | 453,296 |
| Mode M0 | |||
|---|---|---|---|
| Quadrant | BADHDUFLAG | Total packets | Discarded packets |
| A | 0 | 12103 | 0 |
| B | 0 | 13641 | 0 |
| C | 0 | 11537 | 0 |
| D | 0 | 17898 | 0 |
| Mode SS | |||
|---|---|---|---|
| Quadrant | BADHDUFLAG | Total packets | Discarded packets |
| A | 0 | 112 | 0 |
| B | 0 | 112 | 0 |
| C | 0 | 112 | 0 |
| D | 0 | 112 | 0 |
| Quadrant | Total seconds | Saturated seconds | Saturation percentage |
|---|---|---|---|
| A | 5638 | 120 | 2.128414% |
| B | 5638 | 274 | 4.859879% |
| C | 5638 | 63 | 1.117418% |
| D | 5638 | 444 | 7.875133% |
Noise dominated data is calculated using 1-second bins in cleaned event files. If a bin has >2000 counts, and if more than 50% of those come from <1% of pixels, then it is considered to be noise-dominated and hence unusable.
| Quadrant | # 1 sec bins | Bins with >0 counts | Bins with >2000 counts | High rate bins dominated by noise | Noise dominated (total time) | Noise dominated (detector-on time) | Marked lightcurve |
|---|---|---|---|---|---|---|---|
| A | 5639 | 5639 | 5 | 5 | 0.09% | 0.09% | 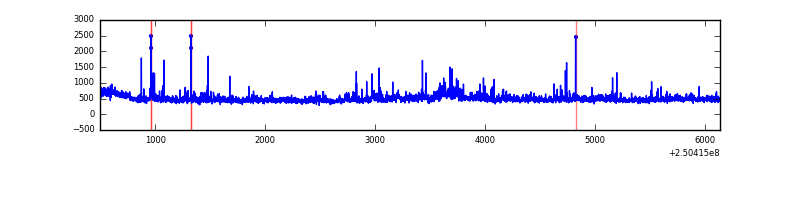 |
| B | 5639 | 5639 | 95 | 95 | 1.68% | 1.68% | 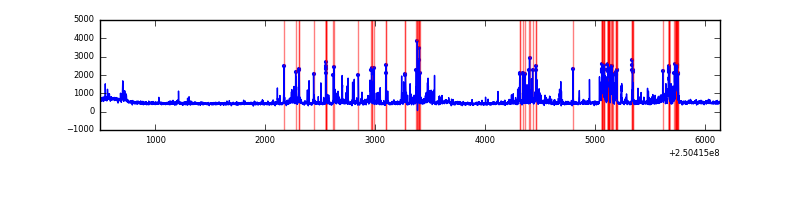 |
| C | 5639 | 5639 | 2 | 2 | 0.04% | 0.04% | 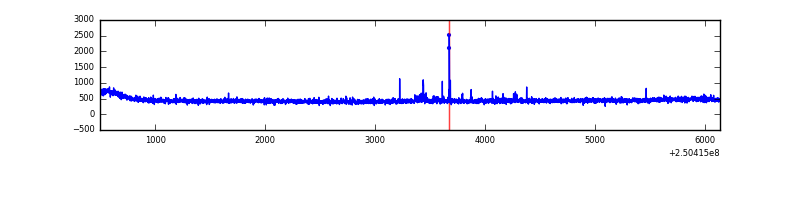 |
| D | 5639 | 5639 | 441 | 441 | 7.82% | 7.82% |  |
Top three noisy pixels from each quadrant. If the there are fewer than three noisy pixels in the level2.evt file, extra rows are filled as -1
| Pixel properties | Quadrant properties | ||||||
|---|---|---|---|---|---|---|---|
| Quadrant | DetID | PixID | Counts | Sigma | Mean | Median | Sigma |
| A | 8 | 15 | 99905 | 749.44 | 639 | 624 | 132.5 |
| A | 1 | 162 | 88172 | 660.87 | 639 | 624 | 132.5 |
| A | 7 | 144 | 47427 | 353.3 | 639 | 624 | 132.5 |
| B | 4 | 239 | 635012 | 5206.65 | 638 | 622 | 121.8 |
| B | 15 | 204 | 65282 | 530.69 | 638 | 622 | 121.8 |
| B | 15 | 33 | 35521 | 286.43 | 638 | 622 | 121.8 |
| C | 7 | 247 | 37073 | 249.57 | 625 | 627 | 146.0 |
| C | 8 | 128 | 8382 | 53.1 | 625 | 627 | 146.0 |
| C | 0 | 207 | 7622 | 47.9 | 625 | 627 | 146.0 |
| D | 13 | 122 | 1304674 | 8934.1 | 607 | 589 | 146.0 |
| D | 1 | 52 | 580153 | 3970.51 | 607 | 589 | 146.0 |
| D | 8 | 195 | 287384 | 1964.79 | 607 | 589 | 146.0 |
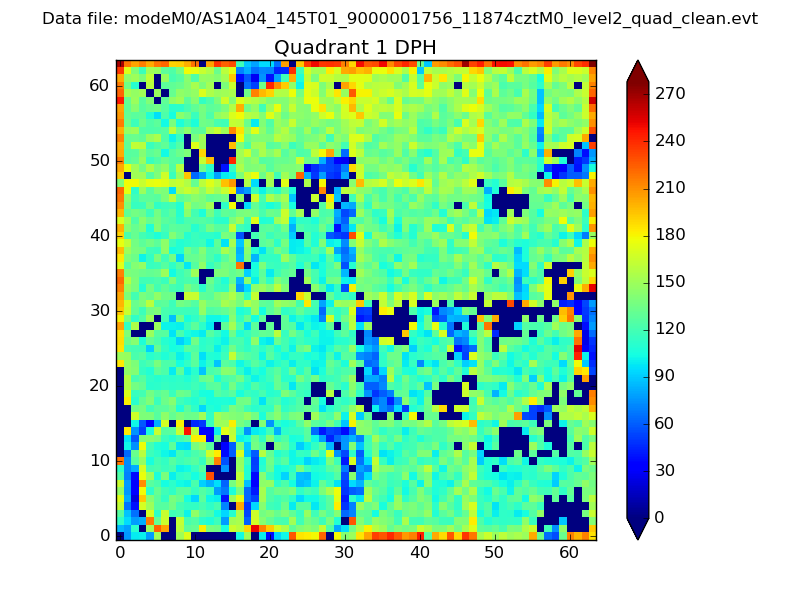
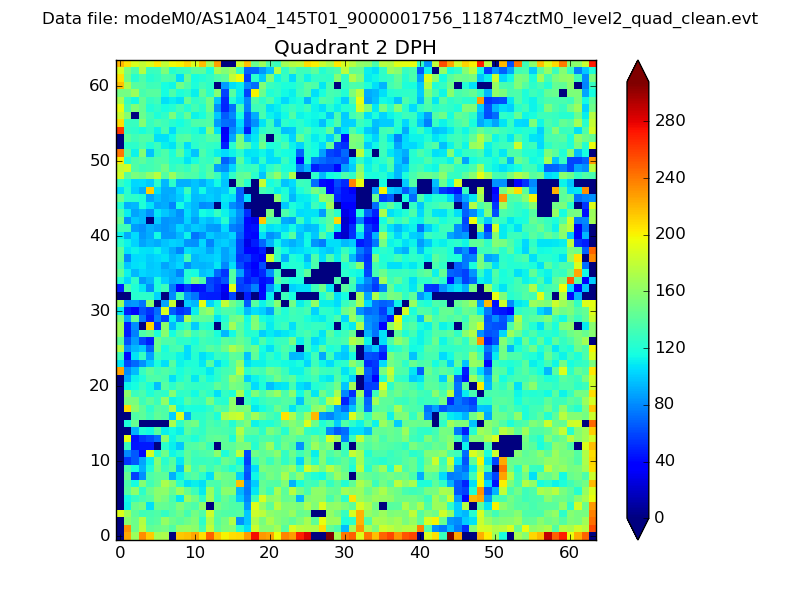
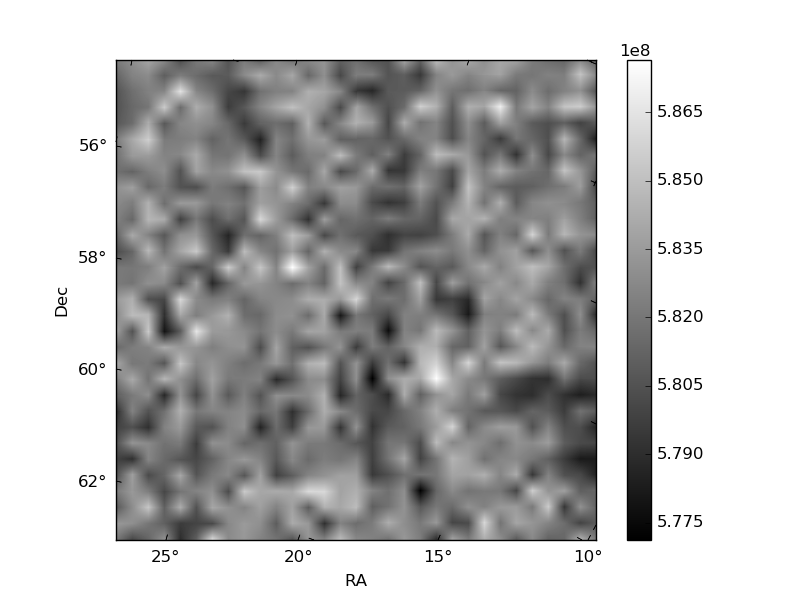
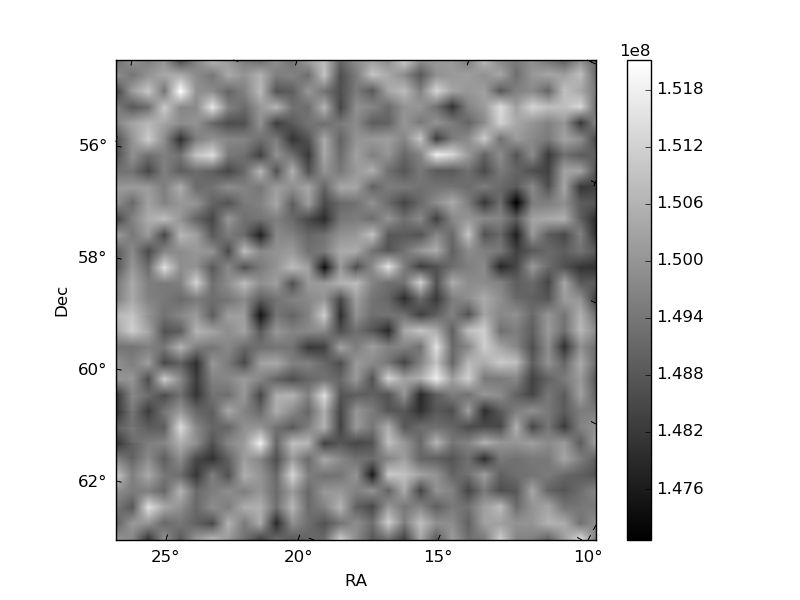
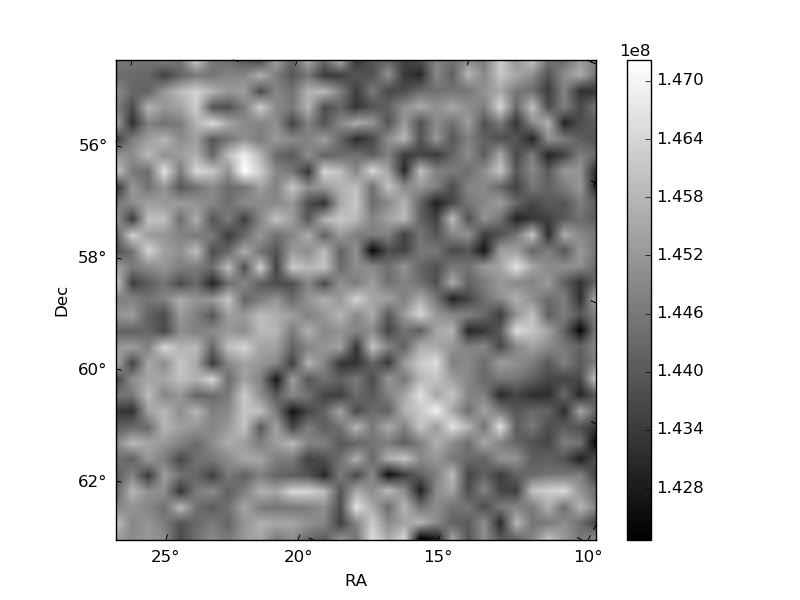
Histogram calculated using DETX and DETY for each event in the final _common_clean file
| Quadrant A | 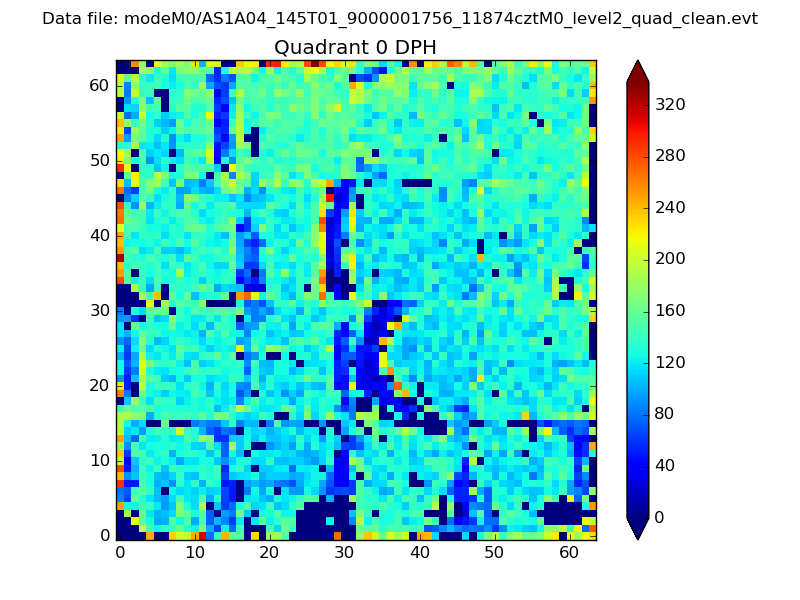 |
 |
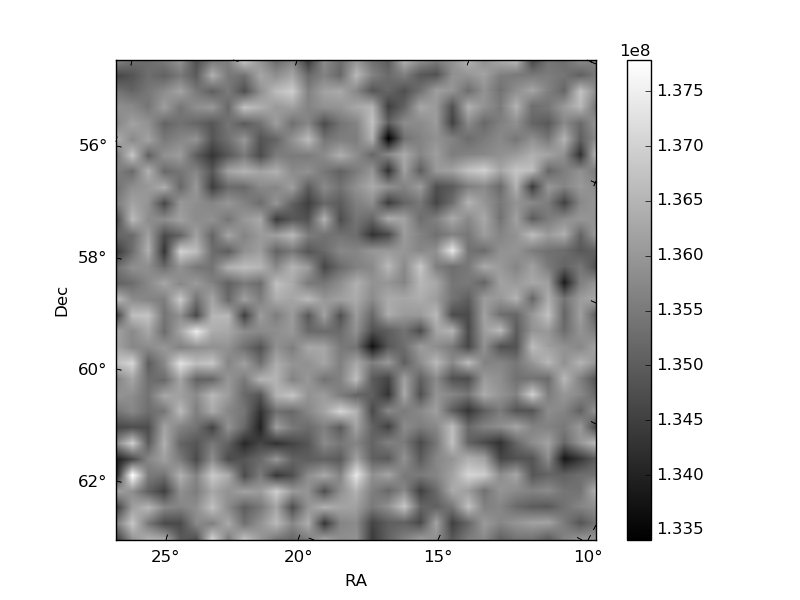
Quadrant B |
|---|---|---|---|
| Quadrant D | 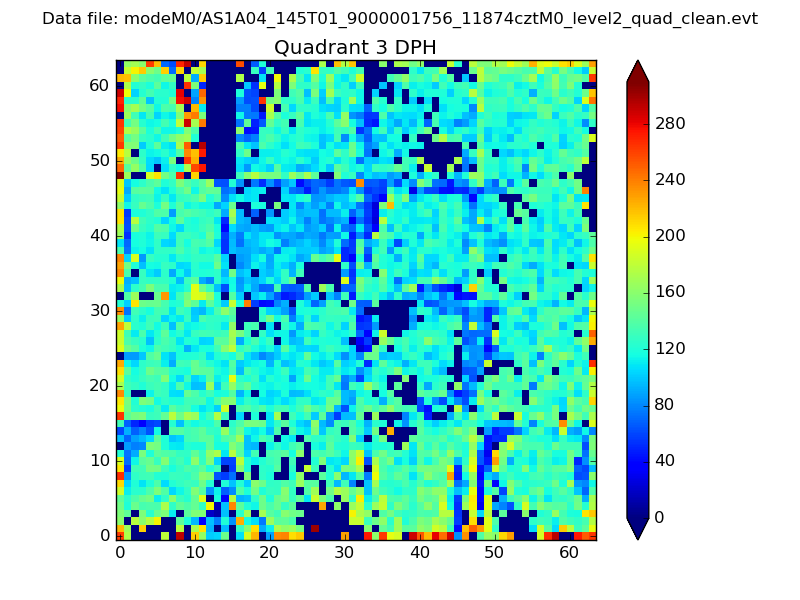 |
 |
Quadrant C |
| Plot type | Count rate plots | Images |
|---|---|---|
| Comparison with Poisson distribution Blue bars denote a histogram of data divided into 1 sec bins. Red curve is a Poisson curve with rate = median count rate of data. |
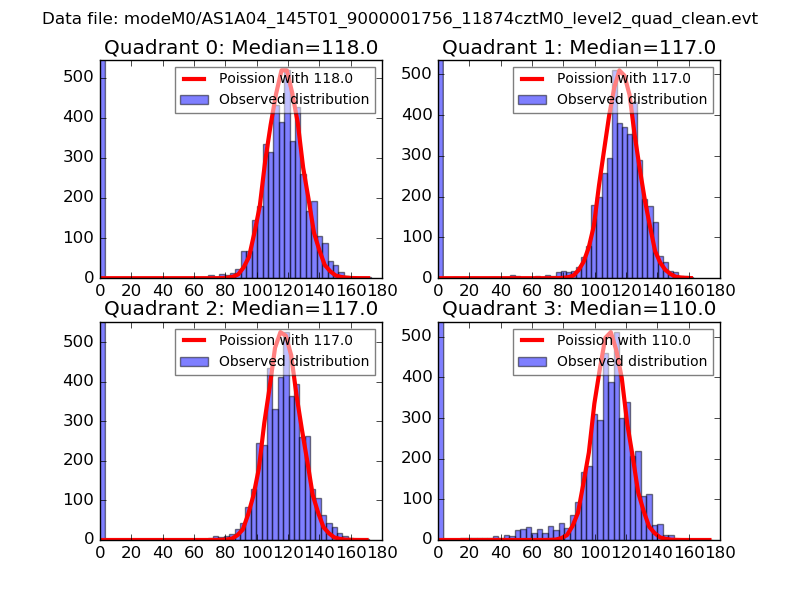 |
 |
| Quadrant-wise count rates Data is divided into 100 sec bins |
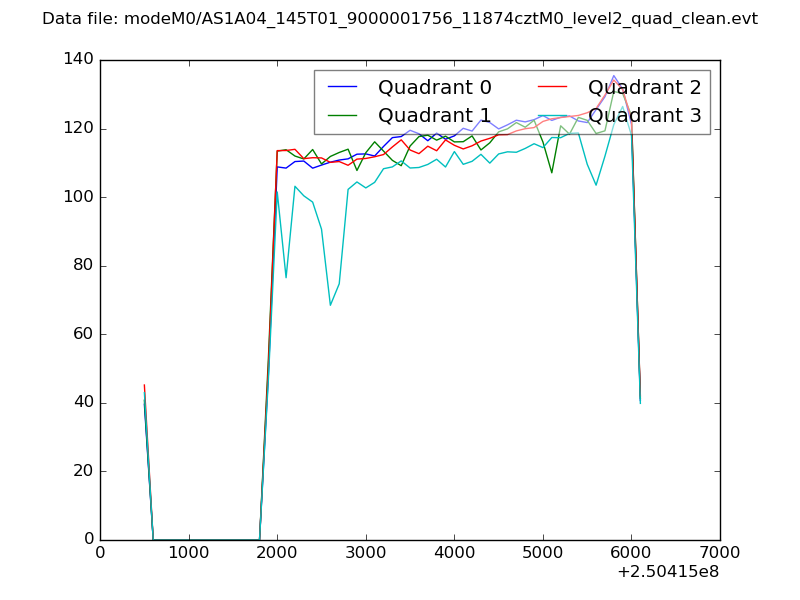 |
|
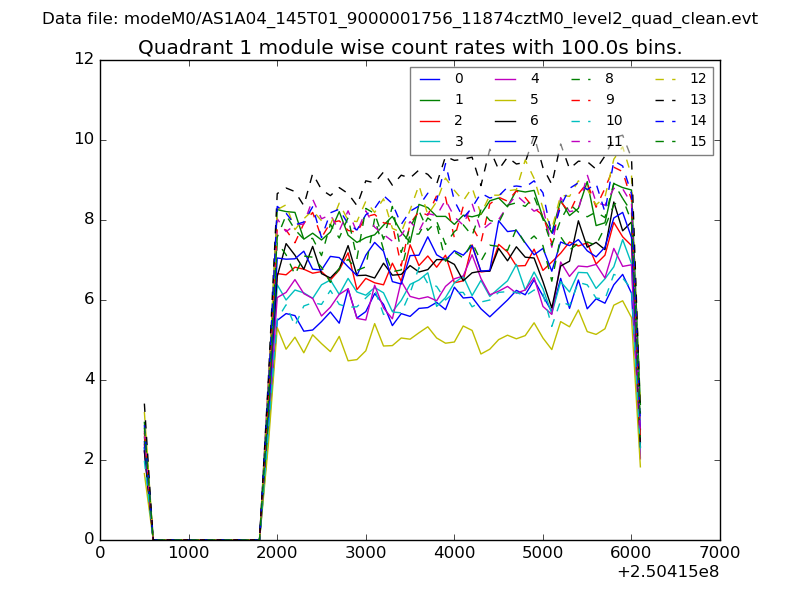
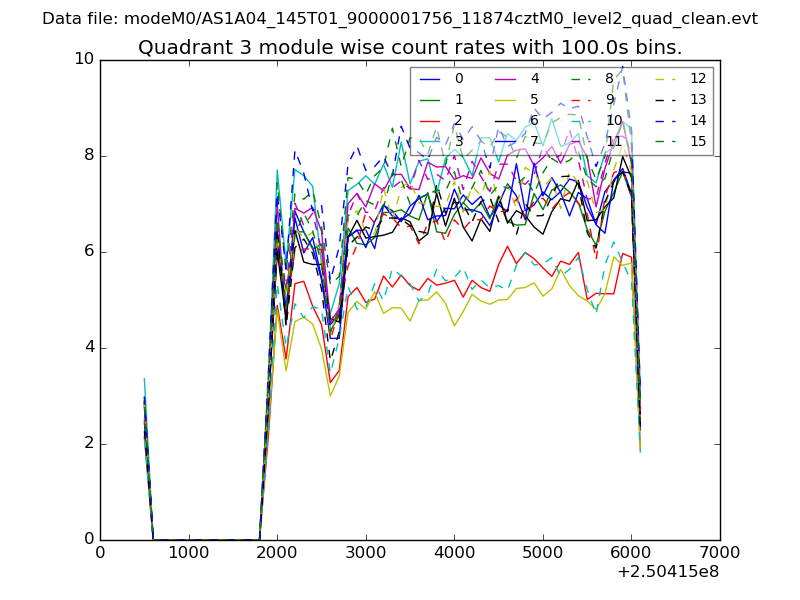
| Module-wise count rates for Quadrant A Data is divided into 100 sec bins |
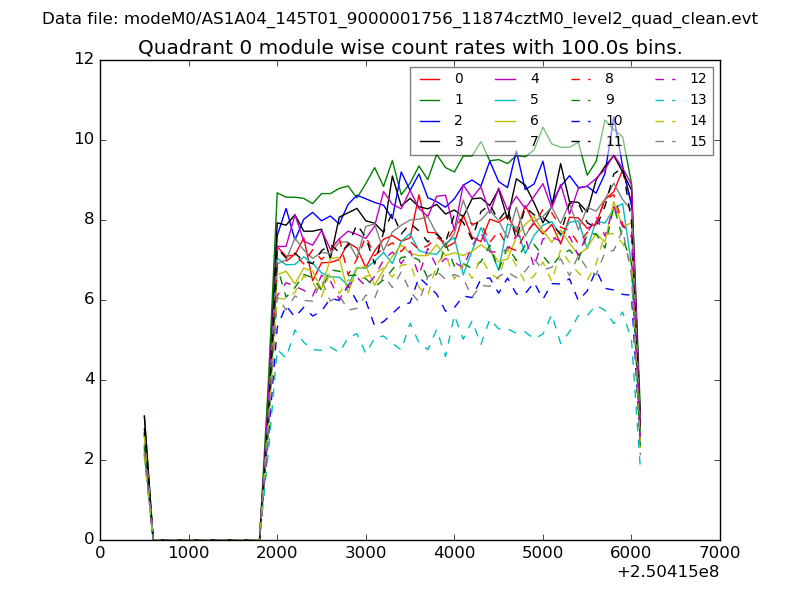 |
 |
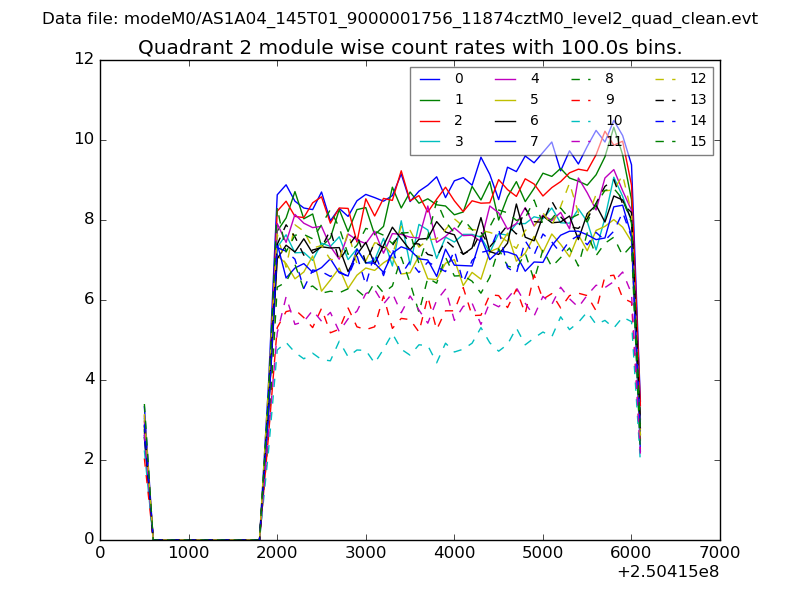
| Module-wise count rates for Quadrant B Data is divided into 100 sec bins |
 |
 |
| Module-wise count rates for Quadrant C Data is divided into 100 sec bins |
 |
 |
| Module-wise count rates for Quadrant D Data is divided into 100 sec bins |
 |
 |
| Parameter | Plot |
|---|---|
| CZT HV Monitor | 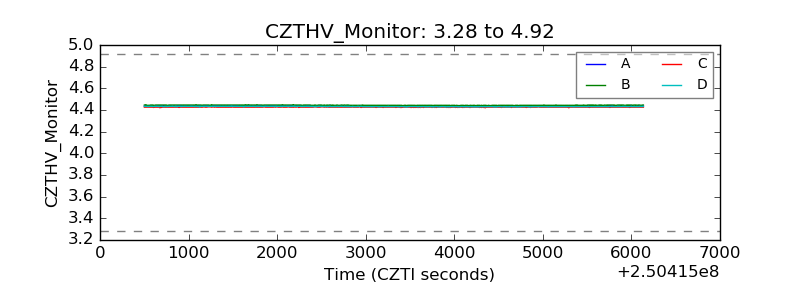 |
| D_VDD | 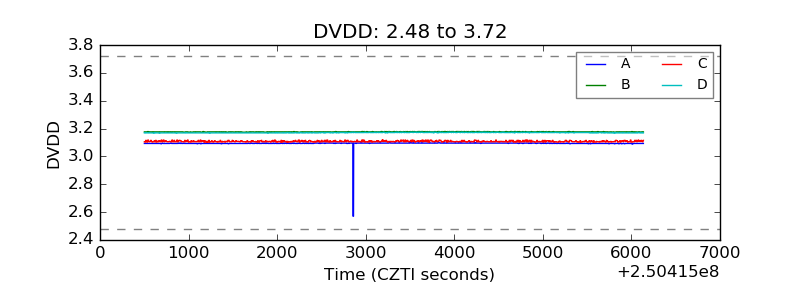 |
| Temperature 1 | 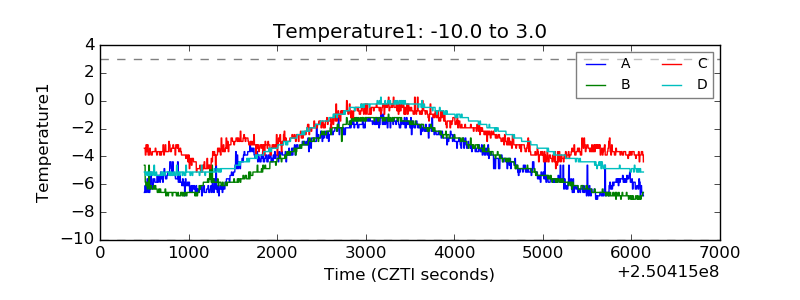 |
| Veto HV Monitor | 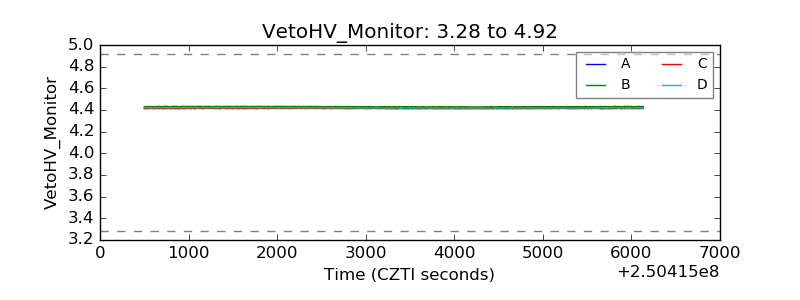 |
| Veto LLD | 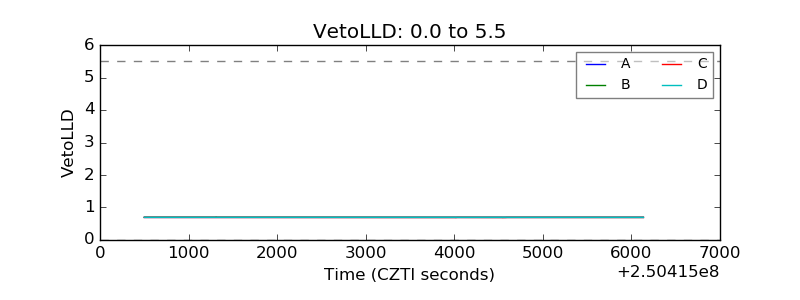 |
| Alpha Counter | 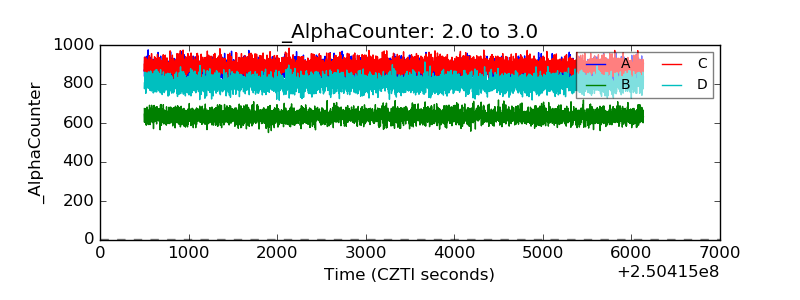 |
| _CPM_Rate | 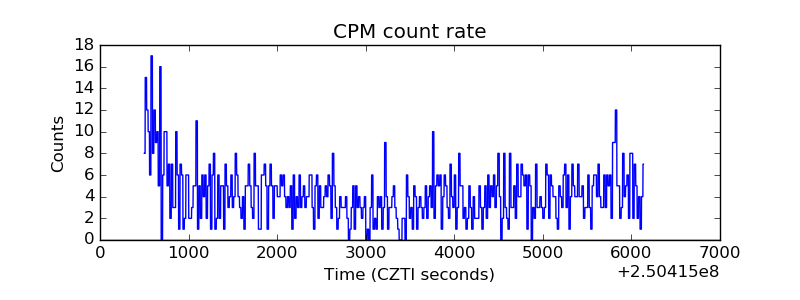 |
| CZT Counter | 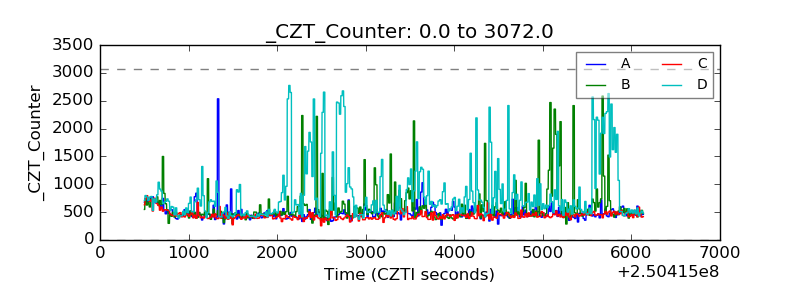 |
| +2.5 Volts monitor |  |
| +5 Volts monitor |  |
| _ROLL_ROT | 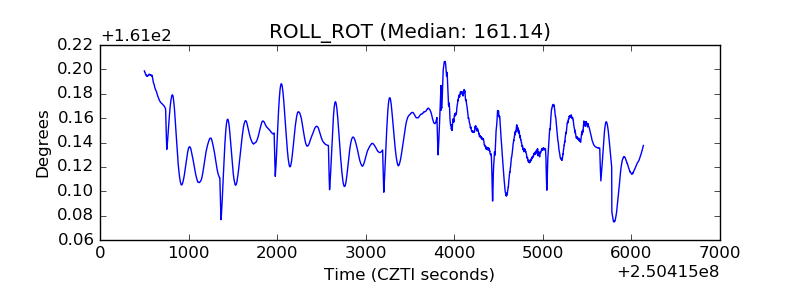 |
| _Roll_DEC | 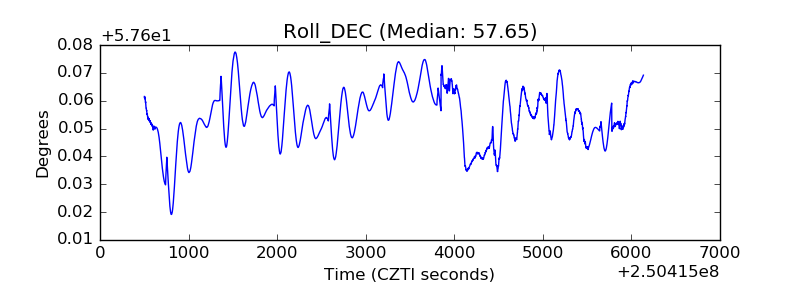 |
| _Roll_RA | 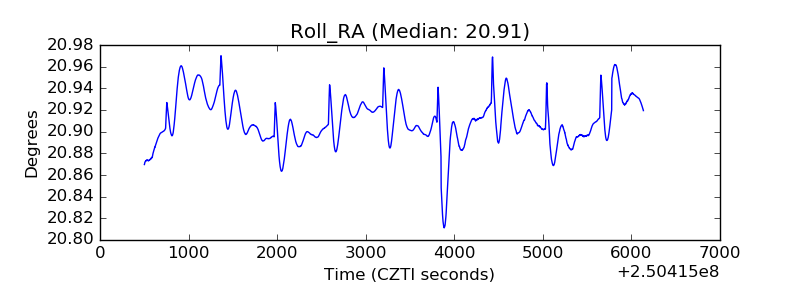 |
| Veto Counter | 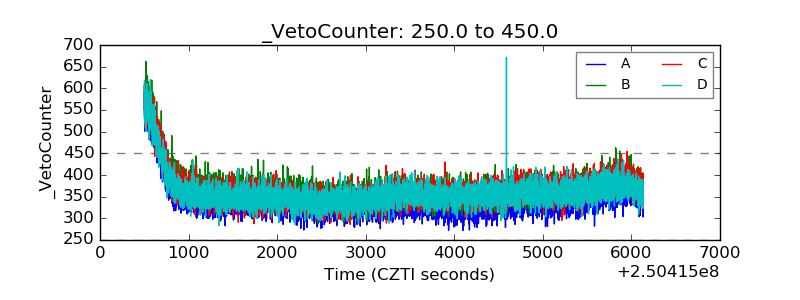 |