| Param | Original file | Final file |
|---|---|---|
| Filename | modeM0/AS1T01_209T01_9000001758cztM0_level2.fits | modeM0/AS1T01_209T01_9000001758cztM0_level2_quad_clean.evt |
| Size (bytes) | 621,659,520 | 735,379,200 |
| Size | 592.9 MB | 701.3 MB |
| Events in quadrant A | 3,708,894 | 4,574,100 |
| Events in quadrant B | 3,557,760 | 4,547,581 |
| Events in quadrant C | 3,719,454 | 4,450,985 |
| Events in quadrant D | 3,183,100 | 4,044,022 |
| Mode M0 | |||
|---|---|---|---|
| Quadrant | BADHDUFLAG | Total packets | Discarded packets |
| A | 0 | 158011 | 0 |
| B | 0 | 169536 | 0 |
| C | 0 | 138268 | 0 |
| D | 0 | 158481 | 0 |
| Mode SS | |||
|---|---|---|---|
| Quadrant | BADHDUFLAG | Total packets | Discarded packets |
| A | 0 | 1386 | 0 |
| B | 0 | 1386 | 0 |
| C | 0 | 1386 | 0 |
| D | 0 | 1386 | 0 |
| Mode M9 | |||
|---|---|---|---|
| Quadrant | BADHDUFLAG | Total packets | Discarded packets |
| A | 0 | 109 | 0 |
| B | 0 | 109 | 0 |
| C | 0 | 109 | 0 |
| D | 0 | 109 | 0 |
| Quadrant | Total seconds | Saturated seconds | Saturation percentage |
|---|---|---|---|
| A | 67883 | 1815 | 2.673718% |
| B | 67883 | 3162 | 4.658015% |
| C | 67883 | 566 | 0.833788% |
| D | 67883 | 1317 | 1.940103% |
Noise dominated data is calculated using 1-second bins in cleaned event files. If a bin has >2000 counts, and if more than 50% of those come from <1% of pixels, then it is considered to be noise-dominated and hence unusable.
| Quadrant | # 1 sec bins | Bins with >0 counts | Bins with >2000 counts | High rate bins dominated by noise | Noise dominated (total time) | Noise dominated (detector-on time) | Marked lightcurve |
|---|---|---|---|---|---|---|---|
| A | 78928 | 67884 | 0 | 0 | 0.00% | 0.00% |  |
| B | 78928 | 67842 | 0 | 0 | 0.00% | 0.00% | 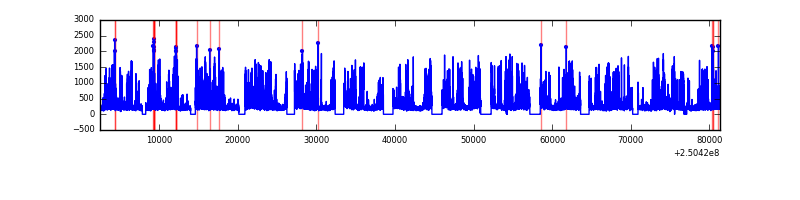 |
| C | 78928 | 67884 | 0 | 0 | 0.00% | 0.00% |  |
| D | 78927 | 67808 | 0 | 0 | 0.00% | 0.00% | 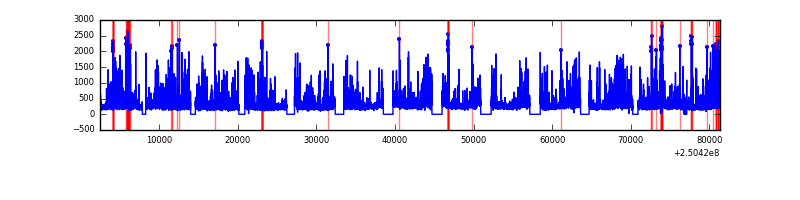 |
Top three noisy pixels from each quadrant. If the there are fewer than three noisy pixels in the level2.evt file, extra rows are filled as -1
| Pixel properties | Quadrant properties | ||||||
|---|---|---|---|---|---|---|---|
| Quadrant | DetID | PixID | Counts | Sigma | Mean | Median | Sigma |
| A | 0 | 29 | 3662 | 11.42 | 966 | 906 | 241.3 |
| A | 7 | 110 | 3041 | 8.85 | 966 | 906 | 241.3 |
| A | 9 | 19 | 2833 | 7.99 | 966 | 906 | 241.3 |
| B | 2 | 9 | 3108 | 11.91 | 943 | 901 | 185.3 |
| B | 14 | 254 | 2449 | 8.35 | 943 | 901 | 185.3 |
| B | 3 | 17 | 2398 | 8.08 | 943 | 901 | 185.3 |
| C | 1 | 81 | 2807 | 7.47 | 981 | 915 | 253.4 |
| C | 1 | 80 | 2800 | 7.44 | 981 | 915 | 253.4 |
| C | 12 | 241 | 2682 | 6.97 | 981 | 915 | 253.4 |
| D | 3 | 14 | 2413 | 6.54 | 907 | 823 | 243.0 |
| D | 6 | 231 | 2327 | 6.19 | 907 | 823 | 243.0 |
| D | 7 | 3 | 2295 | 6.05 | 907 | 823 | 243.0 |
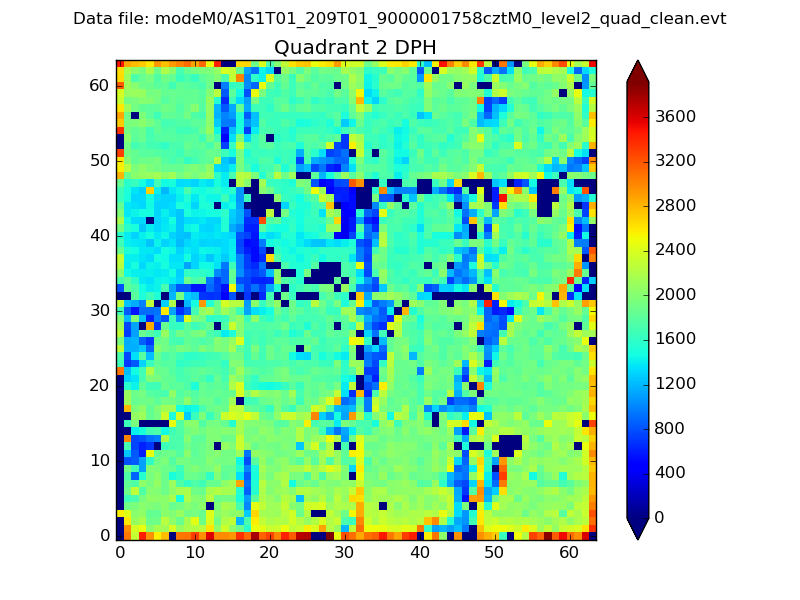
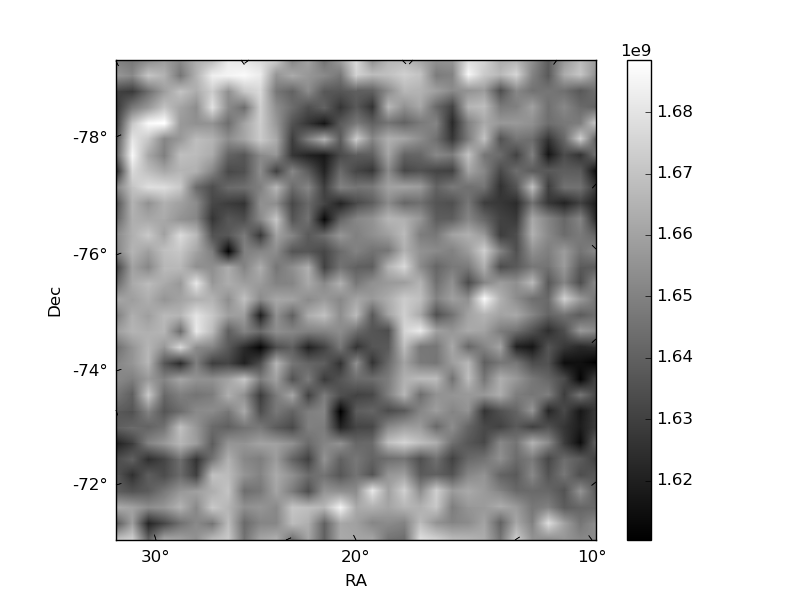
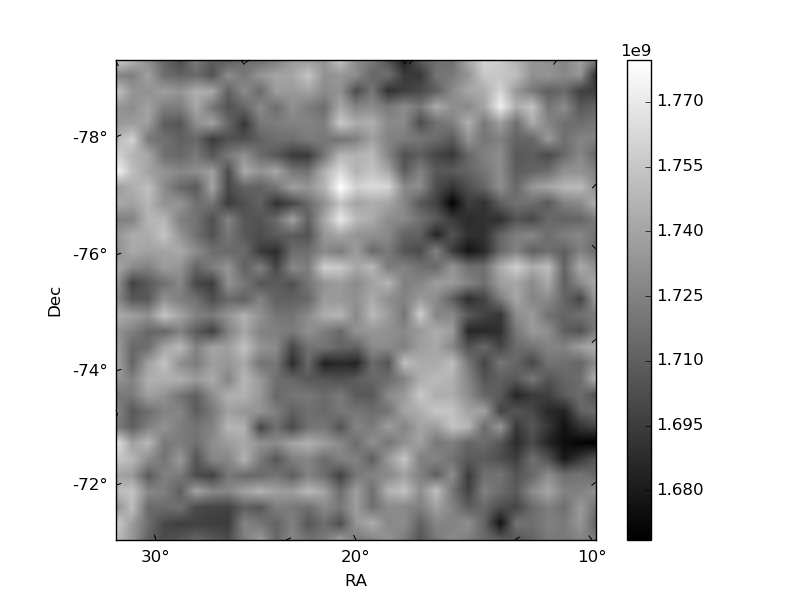
Histogram calculated using DETX and DETY for each event in the final _common_clean file
| Quadrant A | 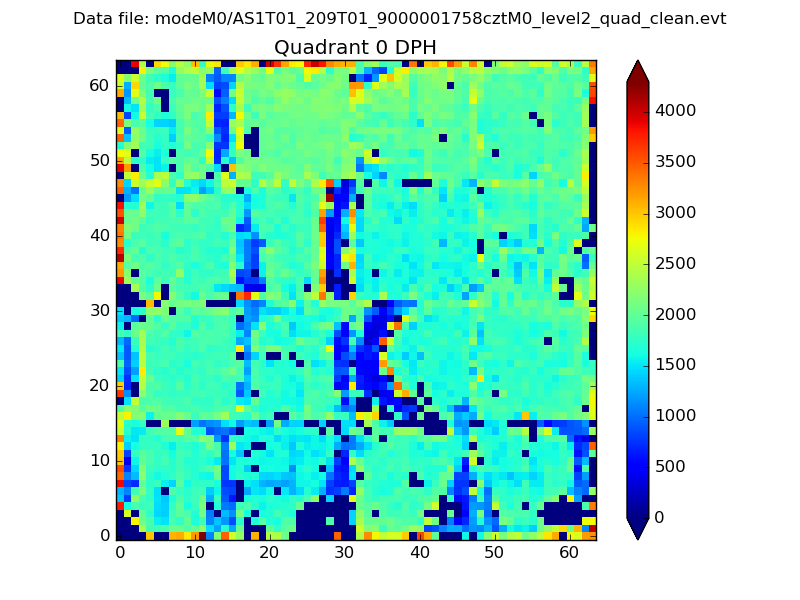 |
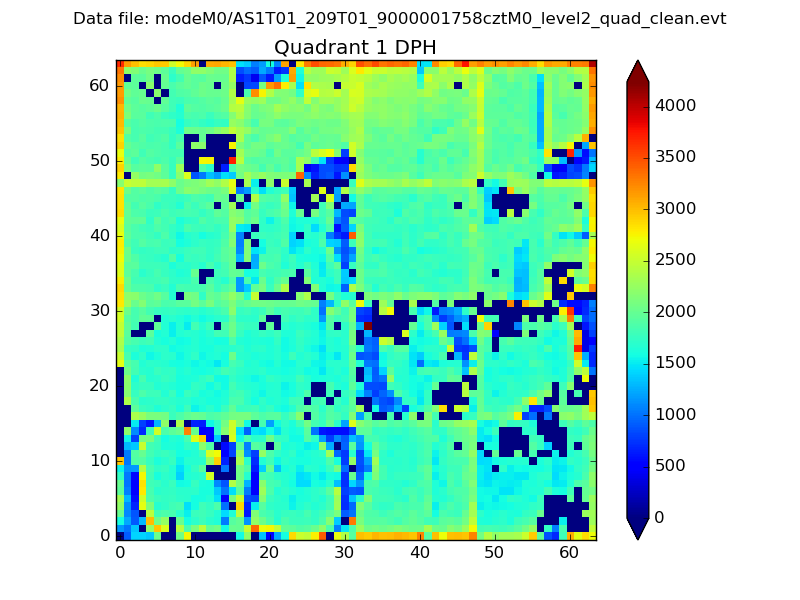 |
Quadrant B |
|---|---|---|---|
| Quadrant D | 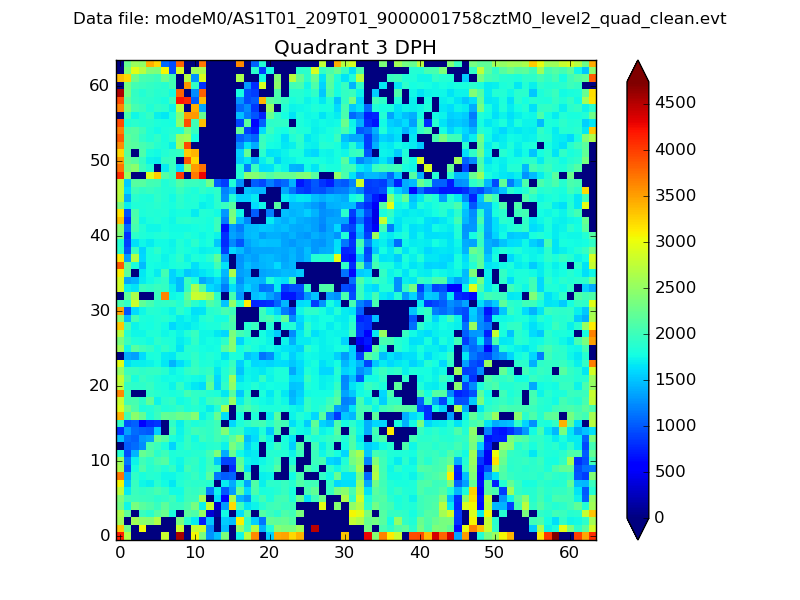 |
 |
Quadrant C |
| Plot type | Count rate plots | Images |
|---|---|---|
| Comparison with Poisson distribution Blue bars denote a histogram of data divided into 1 sec bins. Red curve is a Poisson curve with rate = median count rate of data. |
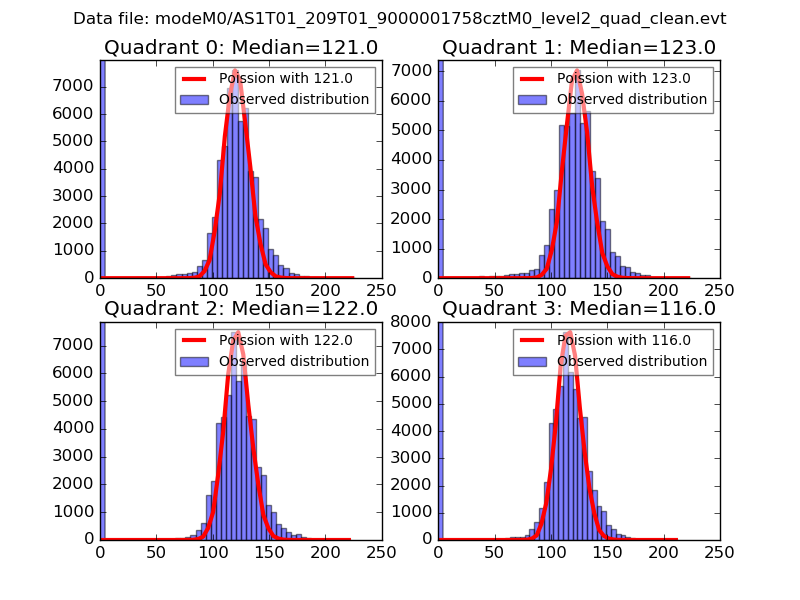 |
 |
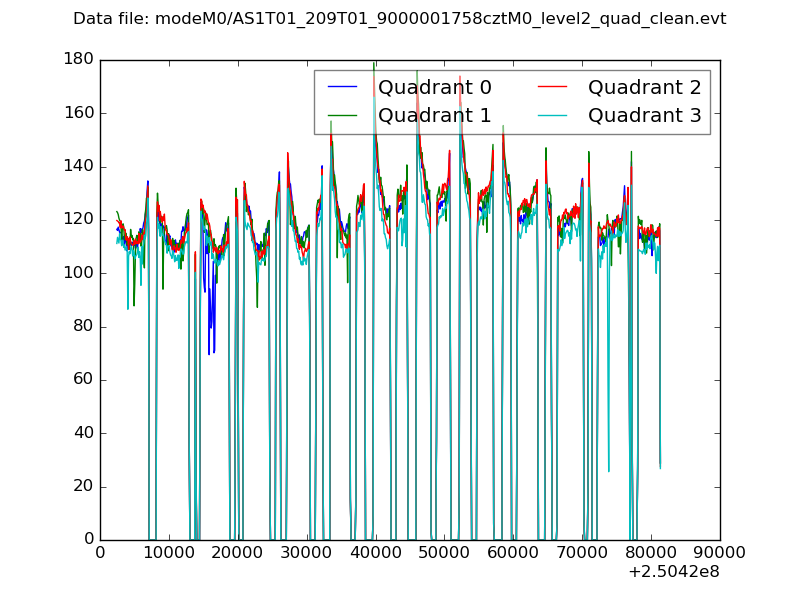
| Quadrant-wise count rates Data is divided into 100 sec bins |
 |
|
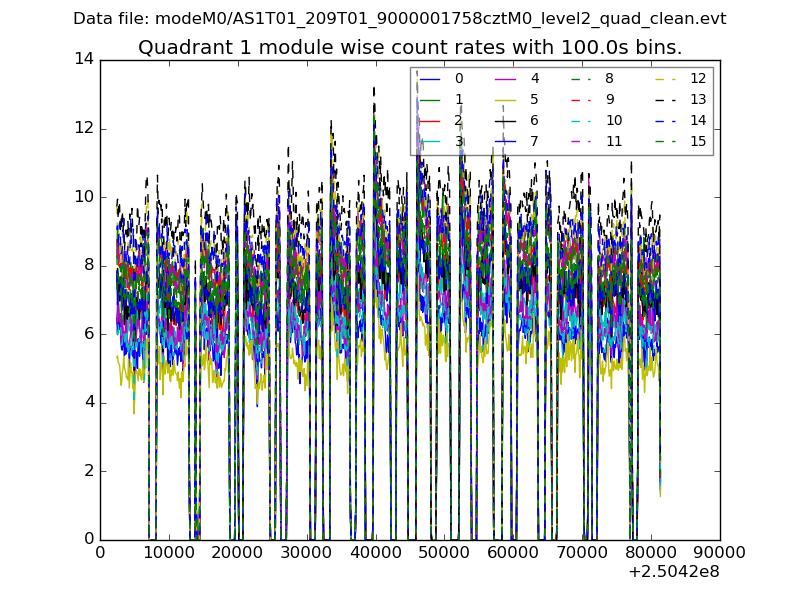
| Module-wise count rates for Quadrant A Data is divided into 100 sec bins |
 |
 |
| Module-wise count rates for Quadrant B Data is divided into 100 sec bins |
 |
 |
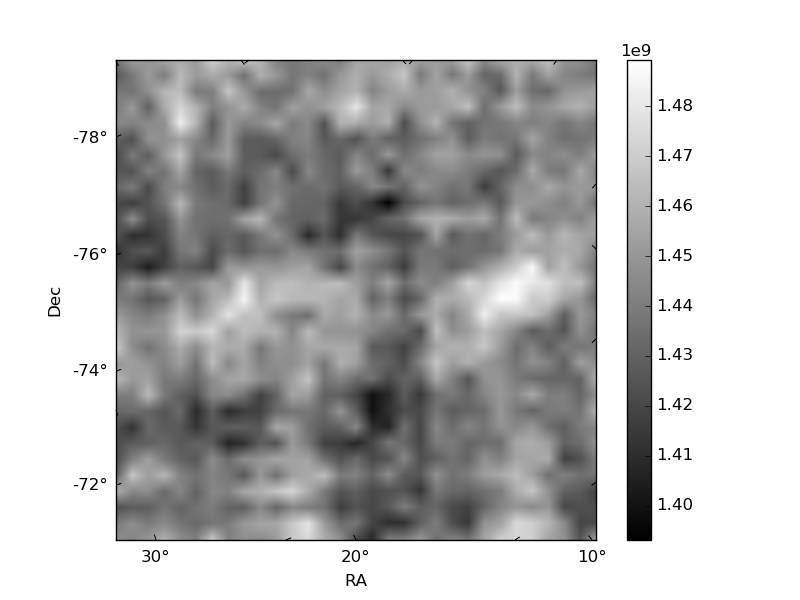
| Module-wise count rates for Quadrant C Data is divided into 100 sec bins |
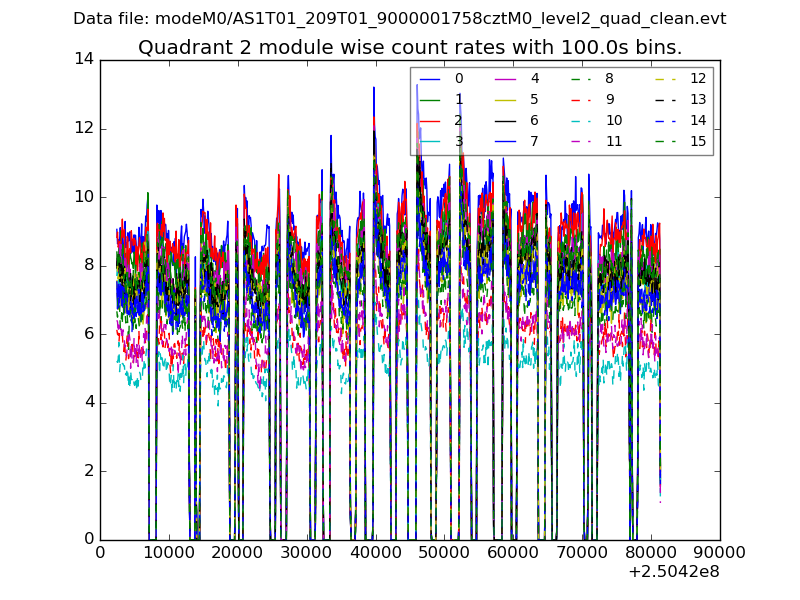 |
 |
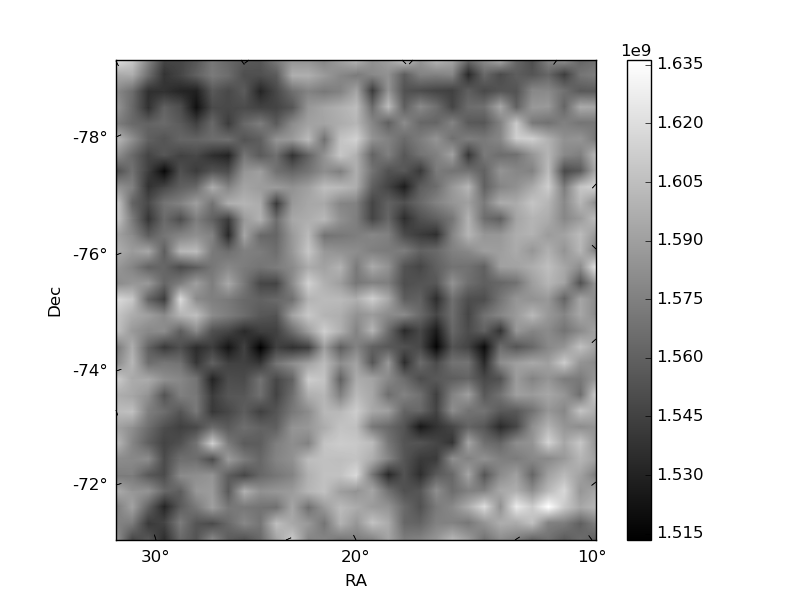
| Module-wise count rates for Quadrant D Data is divided into 100 sec bins |
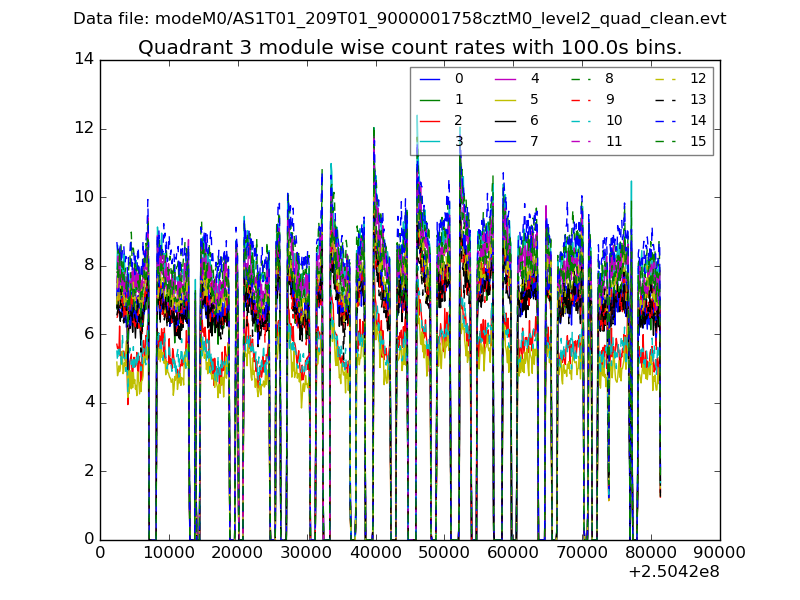 |
 |
| Parameter | Plot |
|---|---|
| CZT HV Monitor | 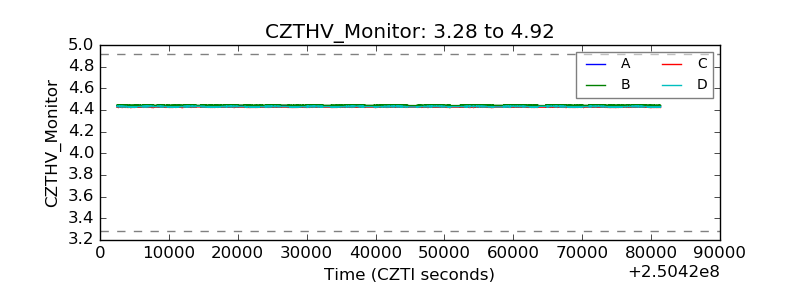 |
| D_VDD | 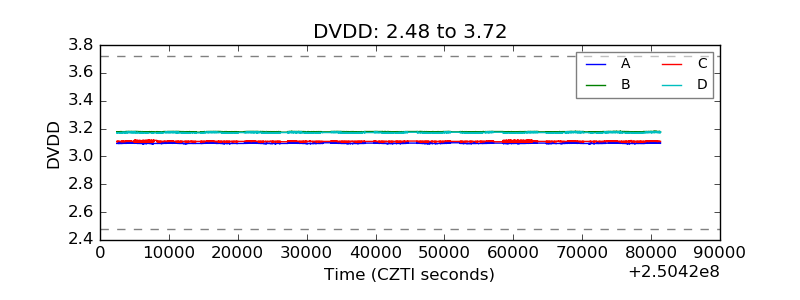 |
| Temperature 1 | 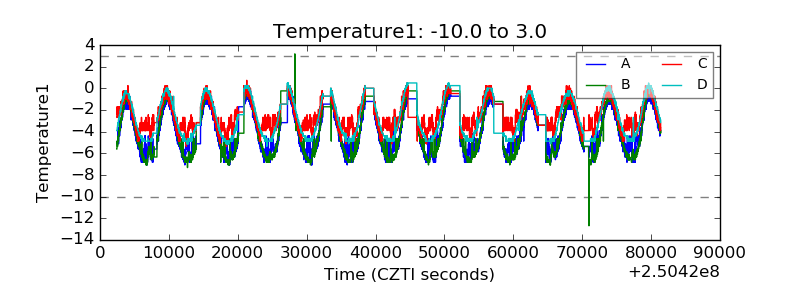 |
| Veto HV Monitor |  |
| Veto LLD | 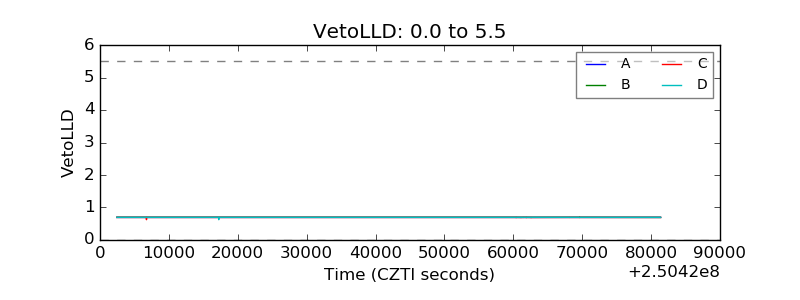 |
| Alpha Counter |  |
| _CPM_Rate | 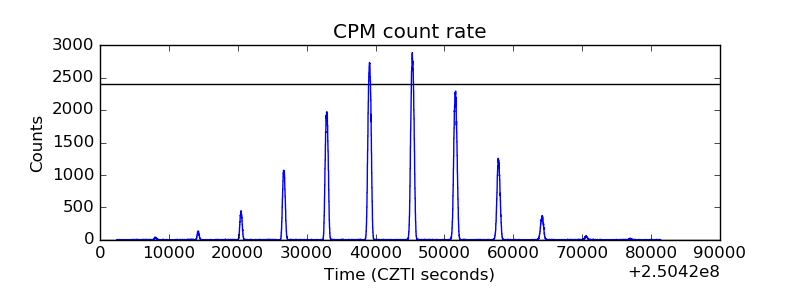 |
| CZT Counter |  |
| +2.5 Volts monitor |  |
| +5 Volts monitor | 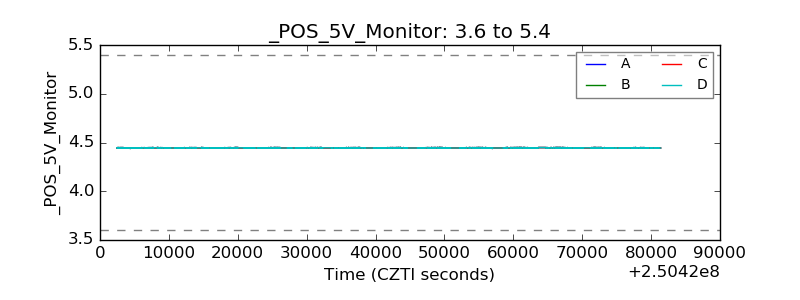 |
| _ROLL_ROT | 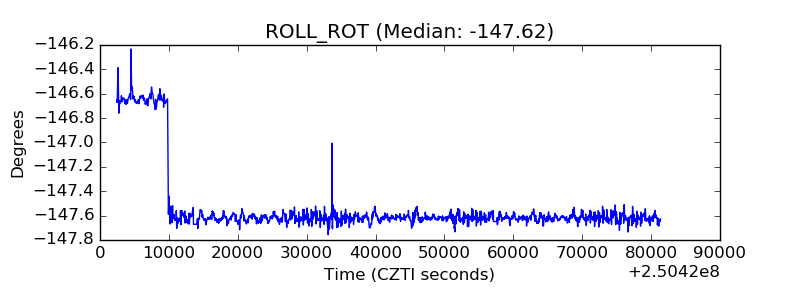 |
| _Roll_DEC | 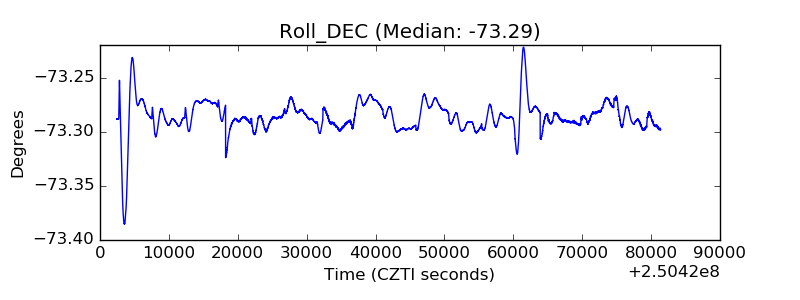 |
| _Roll_RA | 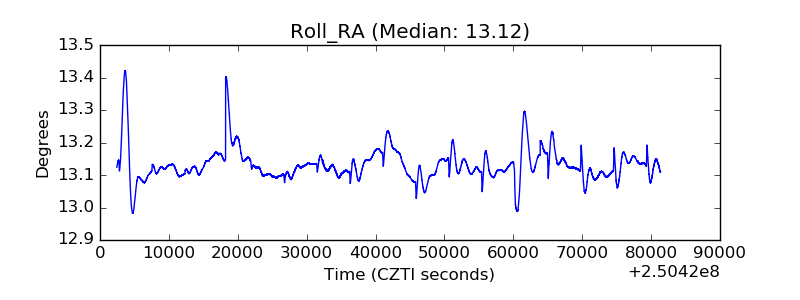 |
| Veto Counter | 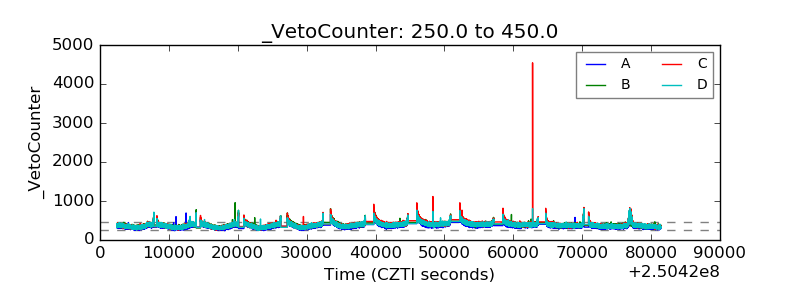 |