| Param | Original file | Final file |
|---|---|---|
| Filename | modeM0/AS1T01_209T01_9000001758_11877cztM0_level2.evt | modeM0/AS1T01_209T01_9000001758_11877cztM0_level2_quad_clean.evt |
| Size (bytes) | 1,409,348,160 | 279,017,280 |
| Size | 1.3 GB | 266.1 MB |
| Events in quadrant A | 12,301,103 | 1,787,926 |
| Events in quadrant B | 11,085,487 | 1,826,092 |
| Events in quadrant C | 7,893,277 | 1,832,029 |
| Events in quadrant D | 10,173,809 | 1,750,817 |
| Mode M0 | |||
|---|---|---|---|
| Quadrant | BADHDUFLAG | Total packets | Discarded packets |
| A | 0 | 48661 | 4 |
| B | 0 | 44507 | 3 |
| C | 0 | 36890 | 3 |
| D | 0 | 42018 | 3 |
| Mode SS | |||
|---|---|---|---|
| Quadrant | BADHDUFLAG | Total packets | Discarded packets |
| A | 0 | 372 | 0 |
| B | 0 | 372 | 0 |
| C | 0 | 372 | 0 |
| D | 0 | 372 | 0 |
| Mode M9 | |||
|---|---|---|---|
| Quadrant | BADHDUFLAG | Total packets | Discarded packets |
| A | 0 | 17 | 0 |
| B | 0 | 17 | 0 |
| C | 0 | 17 | 0 |
| D | 0 | 17 | 0 |
| Quadrant | Total seconds | Saturated seconds | Saturation percentage |
|---|---|---|---|
| A | 18187 | 1068 | 5.872326% |
| B | 18187 | 720 | 3.958872% |
| C | 18187 | 128 | 0.703799% |
| D | 18187 | 339 | 1.863969% |
Noise dominated data is calculated using 1-second bins in cleaned event files. If a bin has >2000 counts, and if more than 50% of those come from <1% of pixels, then it is considered to be noise-dominated and hence unusable.
| Quadrant | # 1 sec bins | Bins with >0 counts | Bins with >2000 counts | High rate bins dominated by noise | Noise dominated (total time) | Noise dominated (detector-on time) | Marked lightcurve |
|---|---|---|---|---|---|---|---|
| A | 20018 | 18191 | 737 | 737 | 3.68% | 4.05% | 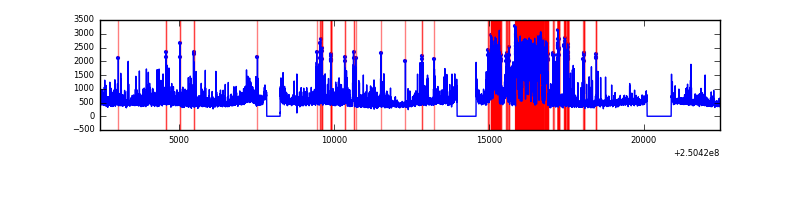 |
| B | 20018 | 18191 | 372 | 372 | 1.86% | 2.04% | 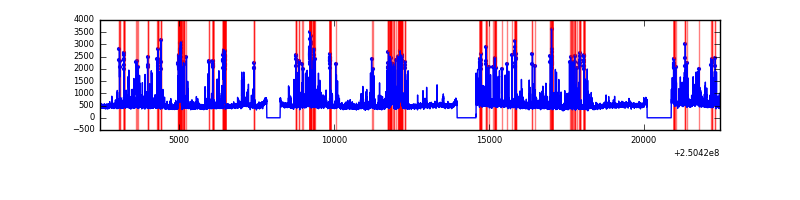 |
| C | 20018 | 18191 | 16 | 16 | 0.08% | 0.09% | 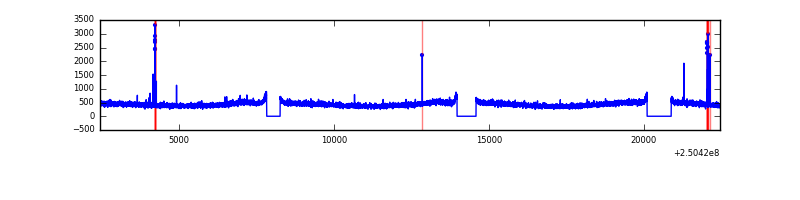 |
| D | 20018 | 18191 | 182 | 182 | 0.91% | 1.00% | 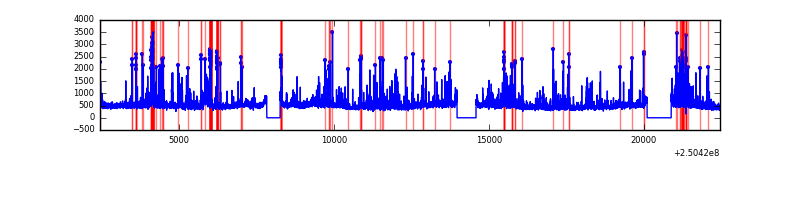 |
Top three noisy pixels from each quadrant. If the there are fewer than three noisy pixels in the level2.evt file, extra rows are filled as -1
| Pixel properties | Quadrant properties | ||||||
|---|---|---|---|---|---|---|---|
| Quadrant | DetID | PixID | Counts | Sigma | Mean | Median | Sigma |
| A | 7 | 144 | 3124324 | 7529.54 | 2041 | 1995 | 414.7 |
| A | 1 | 162 | 345795 | 829.08 | 2041 | 1995 | 414.7 |
| A | 8 | 15 | 292522 | 700.61 | 2041 | 1995 | 414.7 |
| B | 4 | 239 | 1749822 | 4484.42 | 2063 | 2011 | 389.8 |
| B | 0 | 85 | 398938 | 1018.41 | 2063 | 2011 | 389.8 |
| B | 15 | 204 | 301140 | 767.49 | 2063 | 2011 | 389.8 |
| C | 0 | 207 | 59289 | 124.44 | 2006 | 2011 | 460.3 |
| C | 13 | 61 | 15012 | 28.25 | 2006 | 2011 | 460.3 |
| C | 8 | 128 | 6131 | 8.95 | 2006 | 2011 | 460.3 |
| D | 1 | 52 | 846008 | 1763.05 | 1998 | 1937 | 478.8 |
| D | 8 | 195 | 694327 | 1446.23 | 1998 | 1937 | 478.8 |
| D | 13 | 249 | 286023 | 593.38 | 1998 | 1937 | 478.8 |
Histogram calculated using DETX and DETY for each event in the final _common_clean file
| Quadrant A | 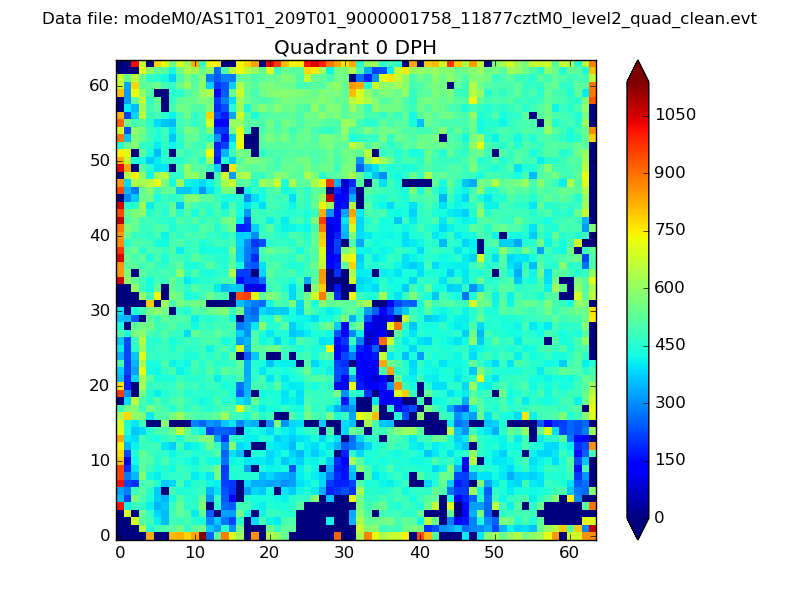 |
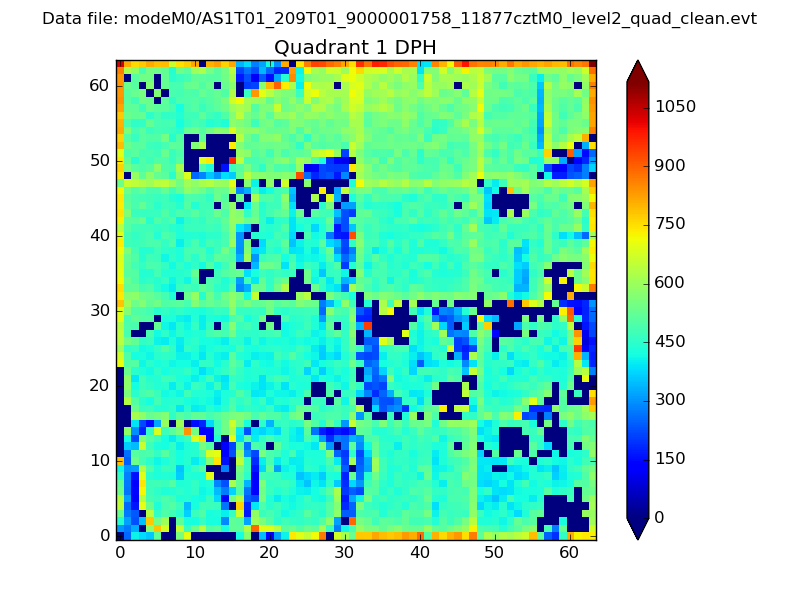 |
Quadrant B |
|---|---|---|---|
| Quadrant D | 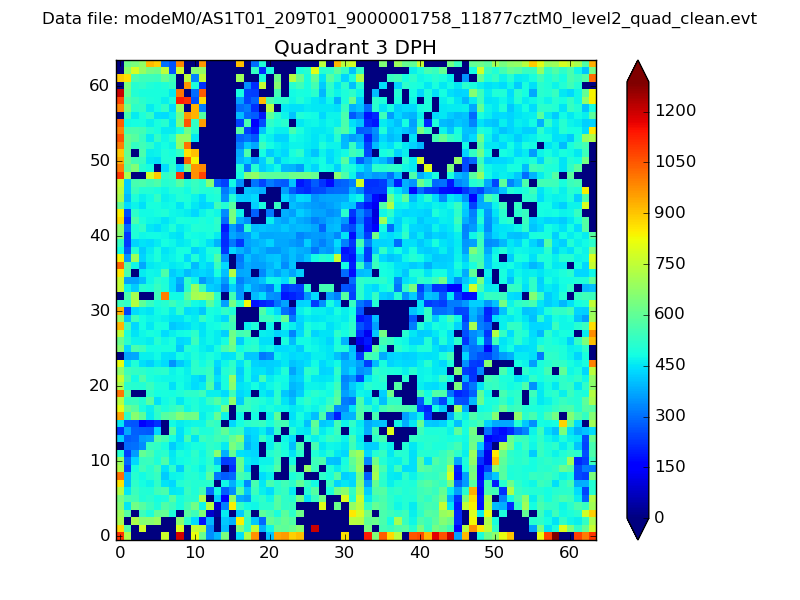 |
 |
Quadrant C |
| Plot type | Count rate plots | Images |
|---|---|---|
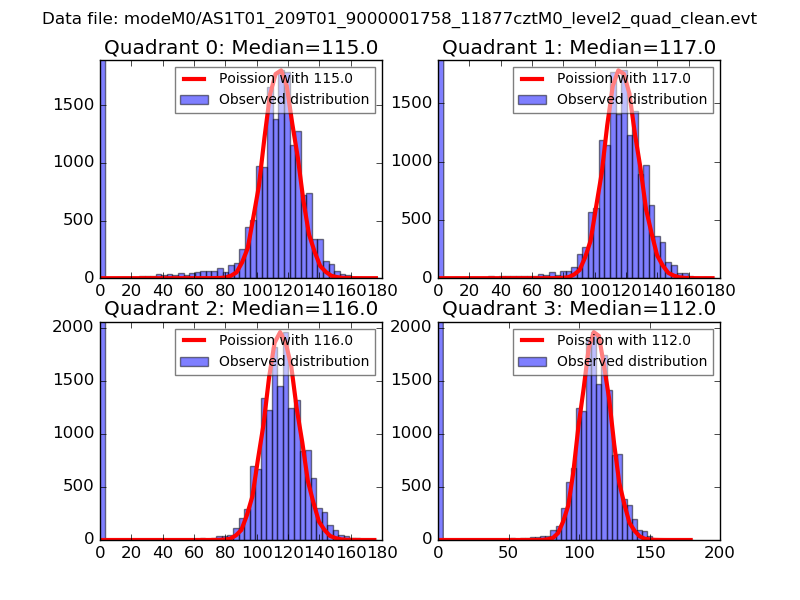
| Comparison with Poisson distribution Blue bars denote a histogram of data divided into 1 sec bins. Red curve is a Poisson curve with rate = median count rate of data. |
 |
 |
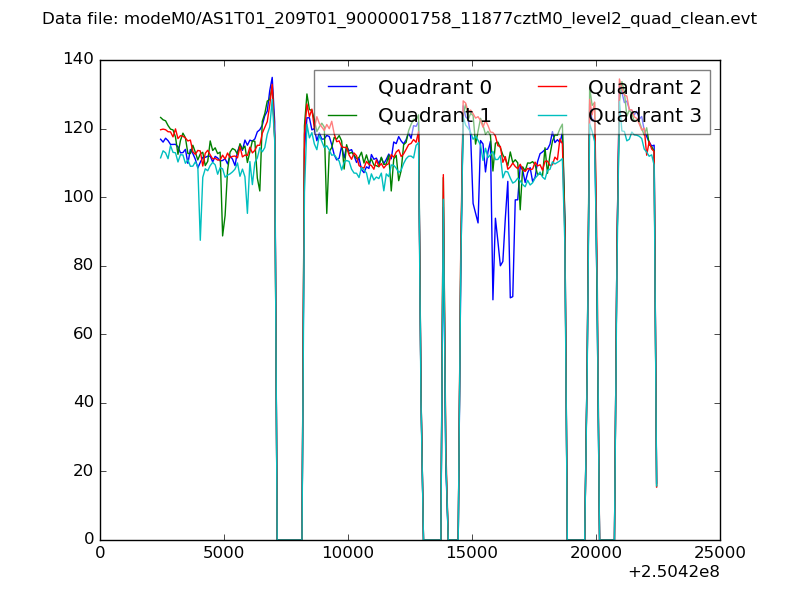
| Quadrant-wise count rates Data is divided into 100 sec bins |
 |
|
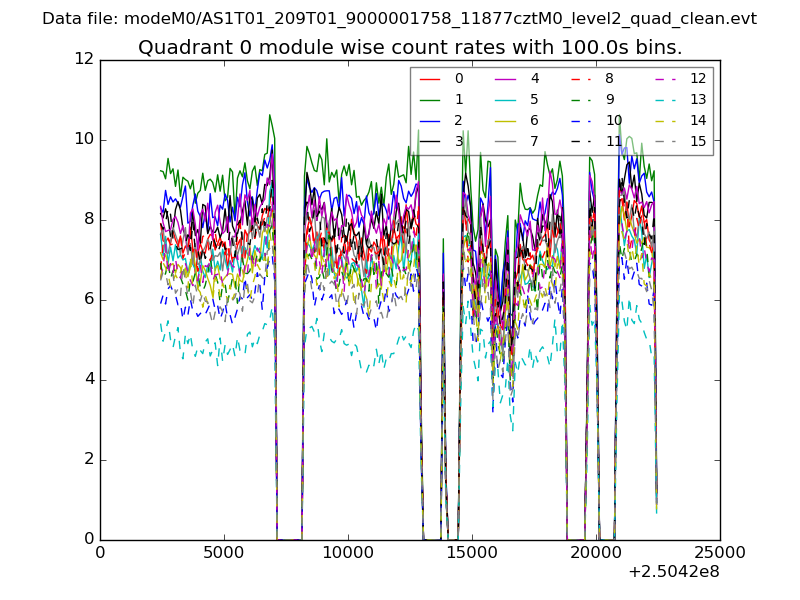
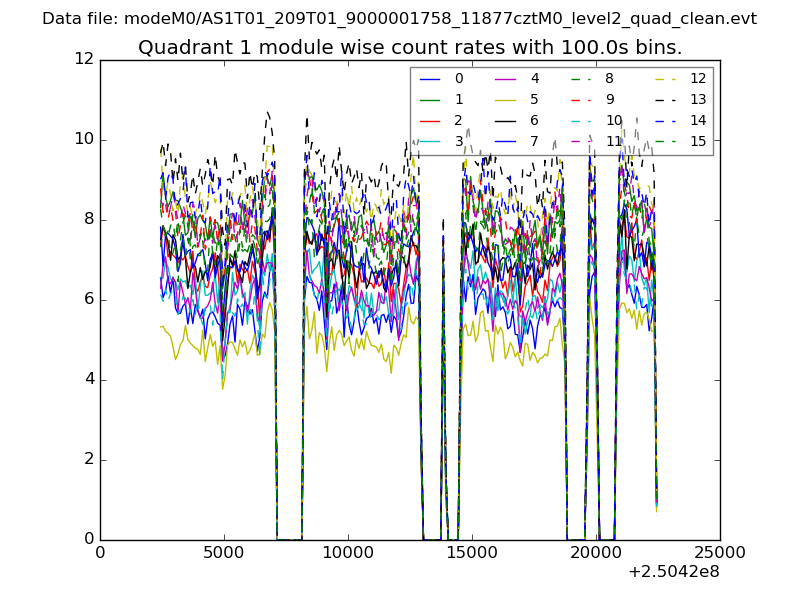
| Module-wise count rates for Quadrant A Data is divided into 100 sec bins |
 |
 |
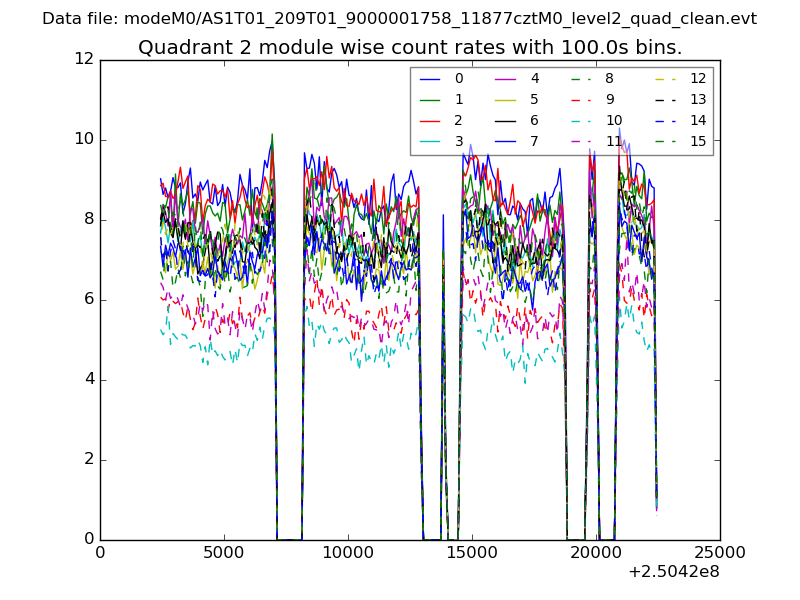
| Module-wise count rates for Quadrant B Data is divided into 100 sec bins |
 |
 |
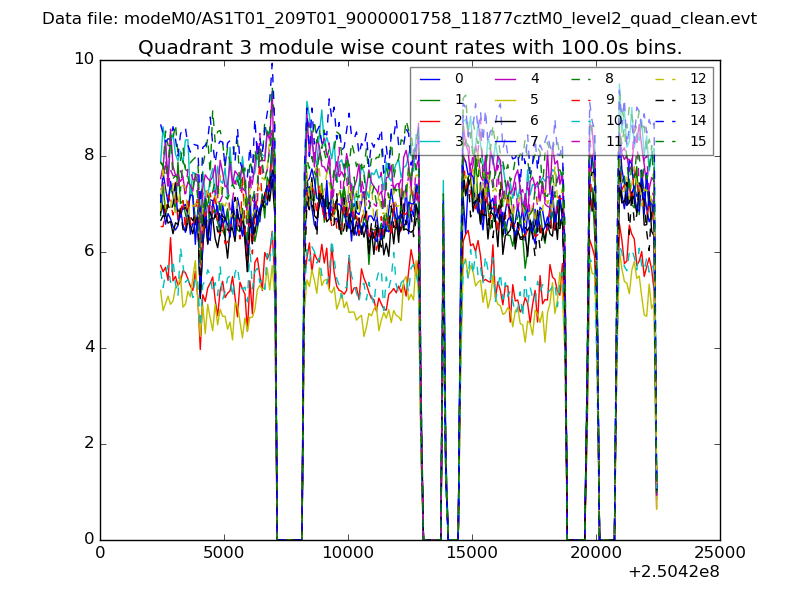
| Module-wise count rates for Quadrant C Data is divided into 100 sec bins |
 |
 |
| Module-wise count rates for Quadrant D Data is divided into 100 sec bins |
 |
 |
| Parameter | Plot |
|---|---|
| CZT HV Monitor | 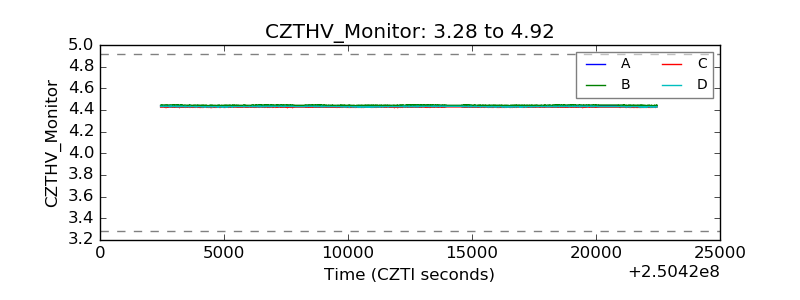 |
| D_VDD | 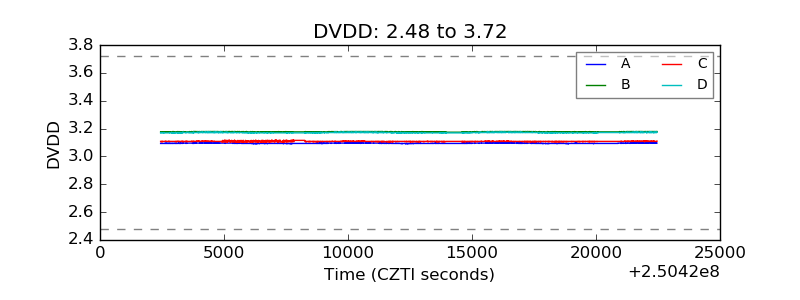 |
| Temperature 1 | 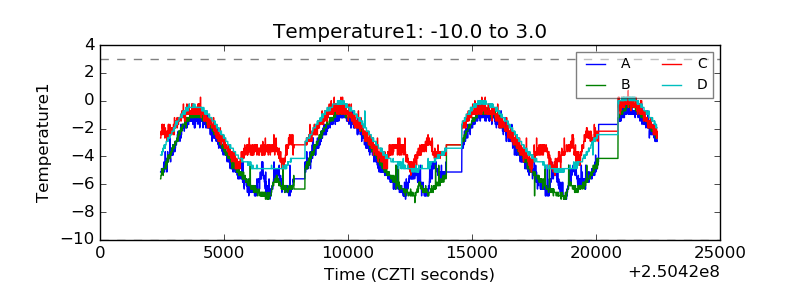 |
| Veto HV Monitor |  |
| Veto LLD | 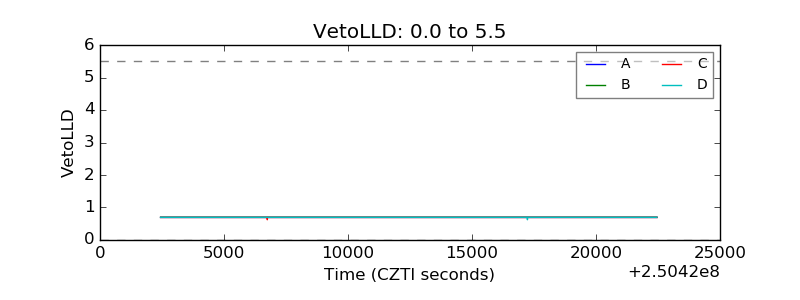 |
| Alpha Counter | 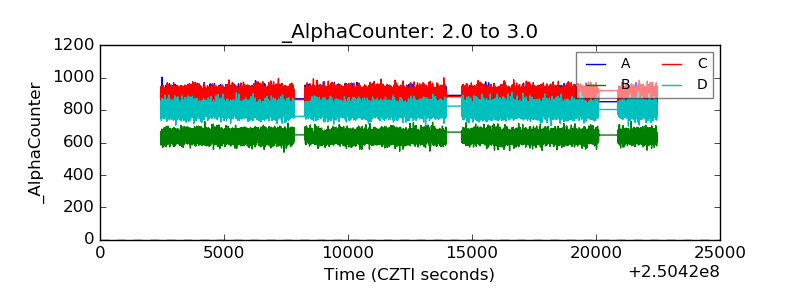 |
| _CPM_Rate | 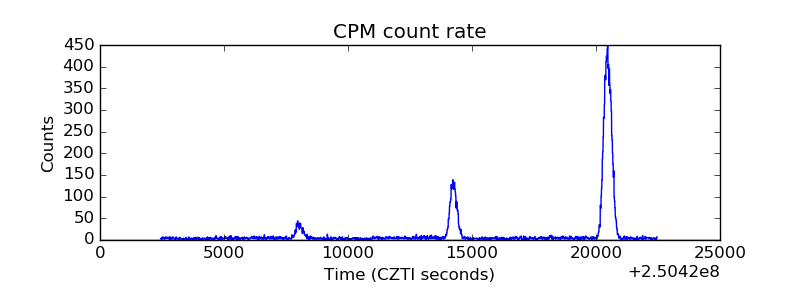 |
| CZT Counter |  |
| +2.5 Volts monitor | 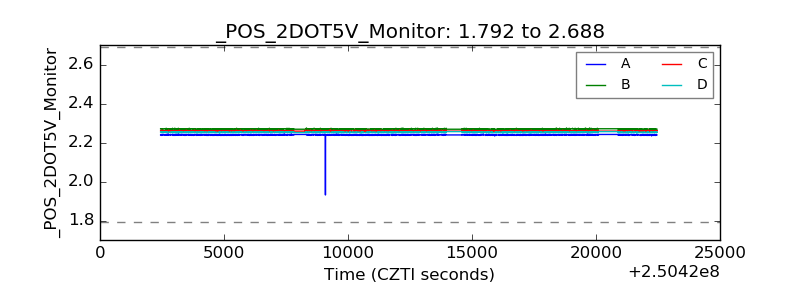 |
| +5 Volts monitor |  |
| _ROLL_ROT | 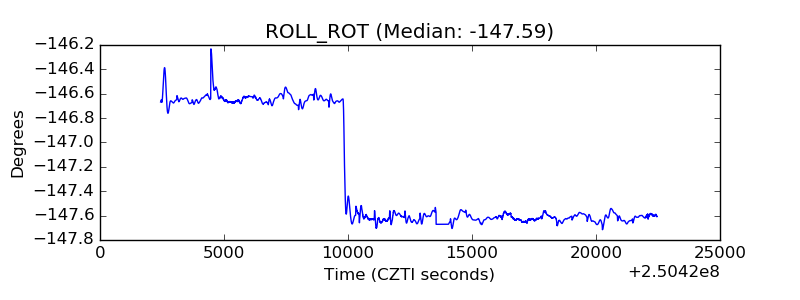 |
| _Roll_DEC | 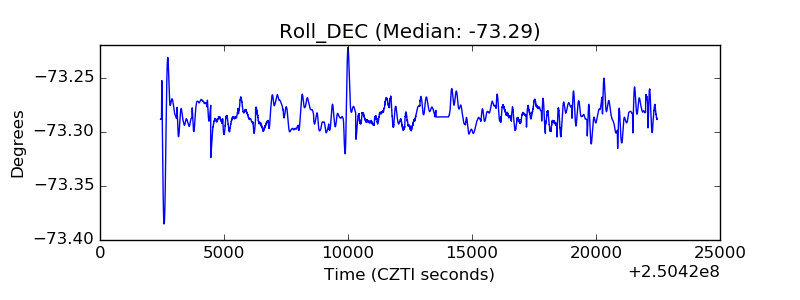 |
| _Roll_RA | 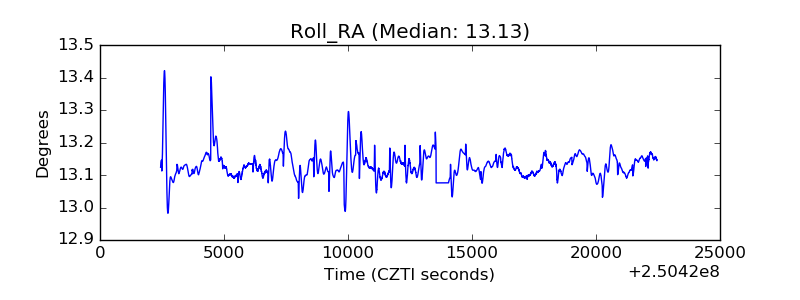 |
| Veto Counter | 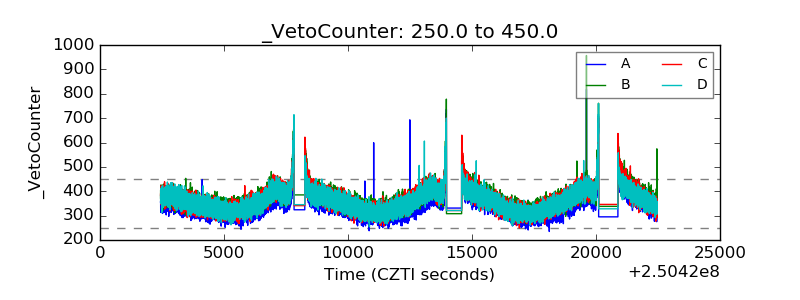 |