| Param | Original file | Final file |
|---|---|---|
| Filename | modeM0/AS1T01_209T01_9000001758_11878cztM0_level2.evt | modeM0/AS1T01_209T01_9000001758_11878cztM0_level2_quad_clean.evt |
| Size (bytes) | 425,275,200 | 91,002,240 |
| Size | 405.6 MB | 86.8 MB |
| Events in quadrant A | 2,840,686 | 602,187 |
| Events in quadrant B | 4,144,547 | 584,844 |
| Events in quadrant C | 2,535,454 | 590,532 |
| Events in quadrant D | 2,960,141 | 568,545 |
| Mode M0 | |||
|---|---|---|---|
| Quadrant | BADHDUFLAG | Total packets | Discarded packets |
| A | 0 | 12440 | 2 |
| B | 0 | 16177 | 1 |
| C | 0 | 11904 | 1 |
| D | 0 | 12835 | 1 |
| Mode SS | |||
|---|---|---|---|
| Quadrant | BADHDUFLAG | Total packets | Discarded packets |
| A | 0 | 118 | 0 |
| B | 0 | 118 | 0 |
| C | 0 | 118 | 0 |
| D | 0 | 118 | 0 |
| Mode M9 | |||
|---|---|---|---|
| Quadrant | BADHDUFLAG | Total packets | Discarded packets |
| A | 0 | 10 | 0 |
| B | 0 | 10 | 0 |
| C | 0 | 10 | 0 |
| D | 0 | 10 | 0 |
| Quadrant | Total seconds | Saturated seconds | Saturation percentage |
|---|---|---|---|
| A | 5865 | 39 | 0.664962% |
| B | 5865 | 340 | 5.797101% |
| C | 5865 | 15 | 0.255754% |
| D | 5865 | 44 | 0.750213% |
Noise dominated data is calculated using 1-second bins in cleaned event files. If a bin has >2000 counts, and if more than 50% of those come from <1% of pixels, then it is considered to be noise-dominated and hence unusable.
| Quadrant | # 1 sec bins | Bins with >0 counts | Bins with >2000 counts | High rate bins dominated by noise | Noise dominated (total time) | Noise dominated (detector-on time) | Marked lightcurve |
|---|---|---|---|---|---|---|---|
| A | 6846 | 5867 | 3 | 3 | 0.04% | 0.05% |  |
| B | 6846 | 5867 | 189 | 189 | 2.76% | 3.22% | 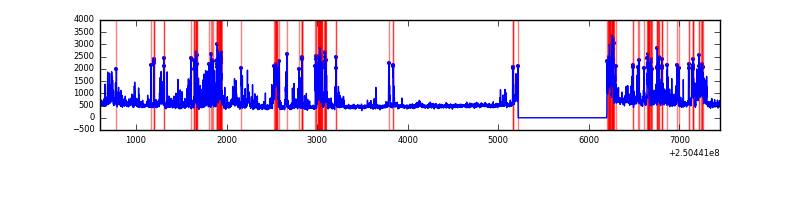 |
| C | 6846 | 5867 | 9 | 9 | 0.13% | 0.15% | 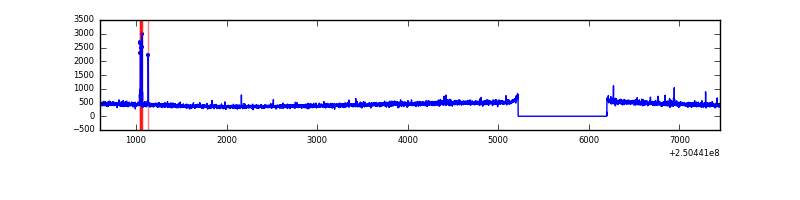 |
| D | 6846 | 5867 | 36 | 36 | 0.53% | 0.61% | 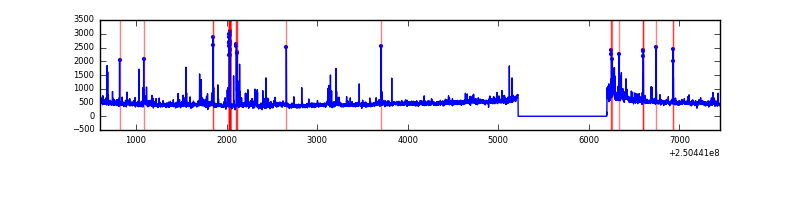 |
Top three noisy pixels from each quadrant. If the there are fewer than three noisy pixels in the level2.evt file, extra rows are filled as -1
| Pixel properties | Quadrant properties | ||||||
|---|---|---|---|---|---|---|---|
| Quadrant | DetID | PixID | Counts | Sigma | Mean | Median | Sigma |
| A | 1 | 162 | 86440 | 628.67 | 668 | 655 | 136.5 |
| A | 1 | 178 | 40854 | 294.59 | 668 | 655 | 136.5 |
| A | 1 | 161 | 36883 | 265.49 | 668 | 655 | 136.5 |
| B | 4 | 239 | 1018096 | 8146.37 | 658 | 642 | 124.9 |
| B | 15 | 185 | 219748 | 1754.3 | 658 | 642 | 124.9 |
| B | 15 | 204 | 158486 | 1263.8 | 658 | 642 | 124.9 |
| C | 0 | 207 | 34893 | 229.71 | 639 | 640 | 149.1 |
| C | 1 | 16 | 7107 | 43.37 | 639 | 640 | 149.1 |
| C | 13 | 61 | 4838 | 28.15 | 639 | 640 | 149.1 |
| D | 1 | 52 | 187056 | 1210.27 | 637 | 619 | 154.0 |
| D | 8 | 195 | 149936 | 969.31 | 637 | 619 | 154.0 |
| D | 13 | 249 | 54514 | 349.86 | 637 | 619 | 154.0 |
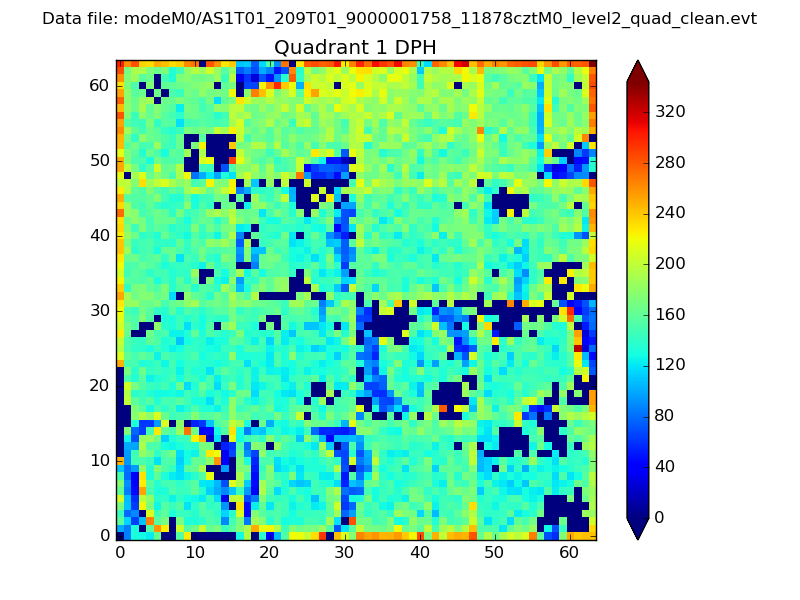
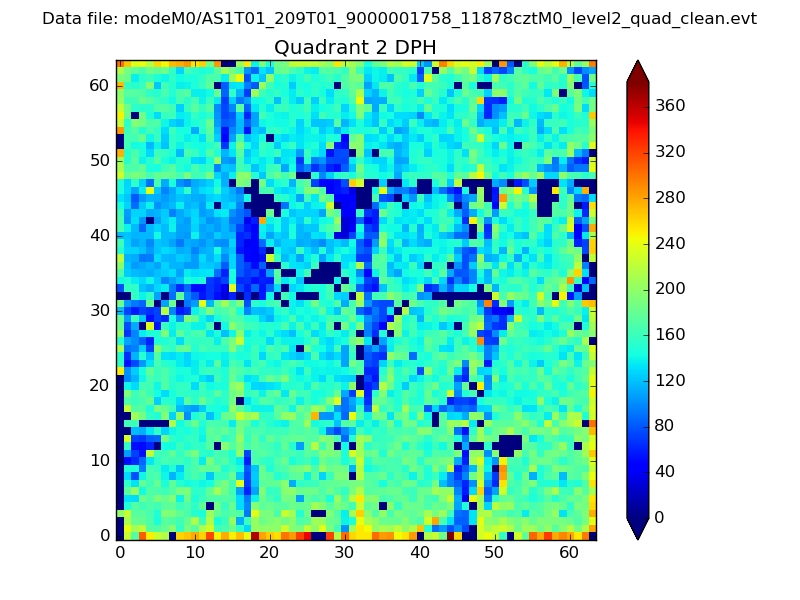
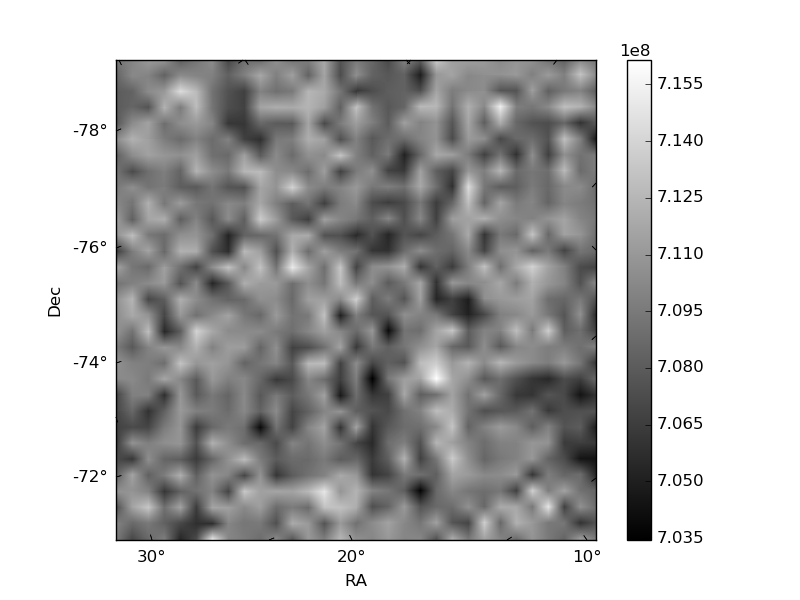
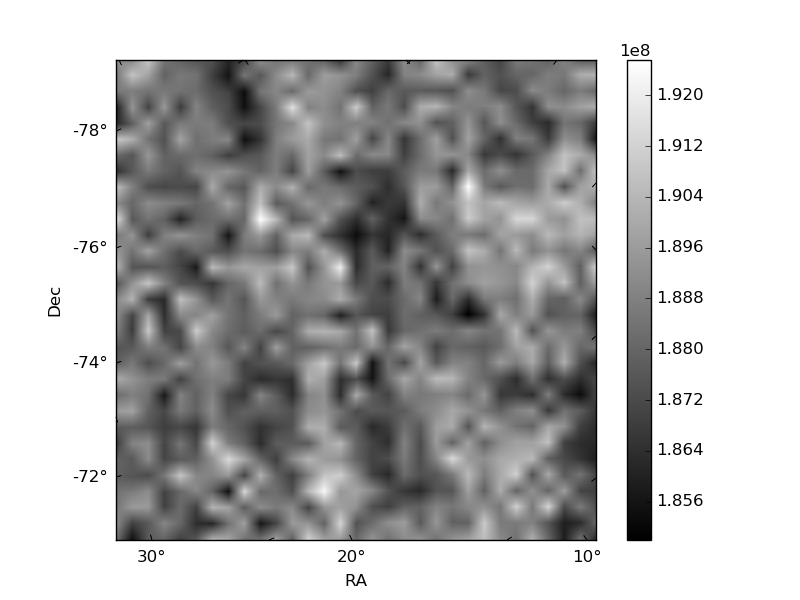
Histogram calculated using DETX and DETY for each event in the final _common_clean file
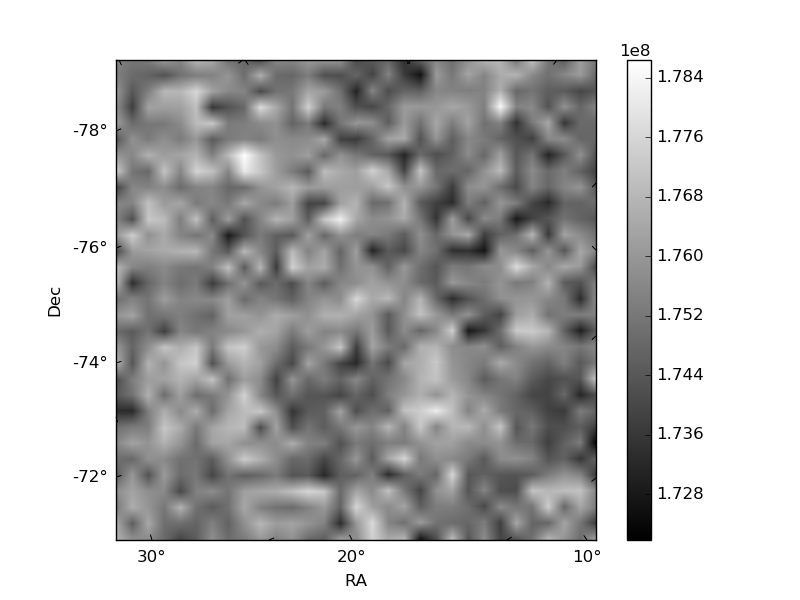
| Quadrant A | 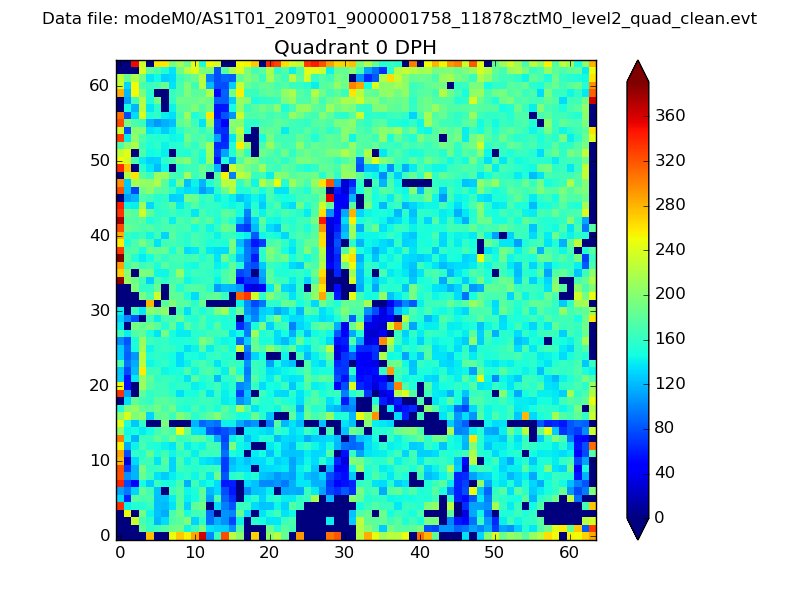 |
 |
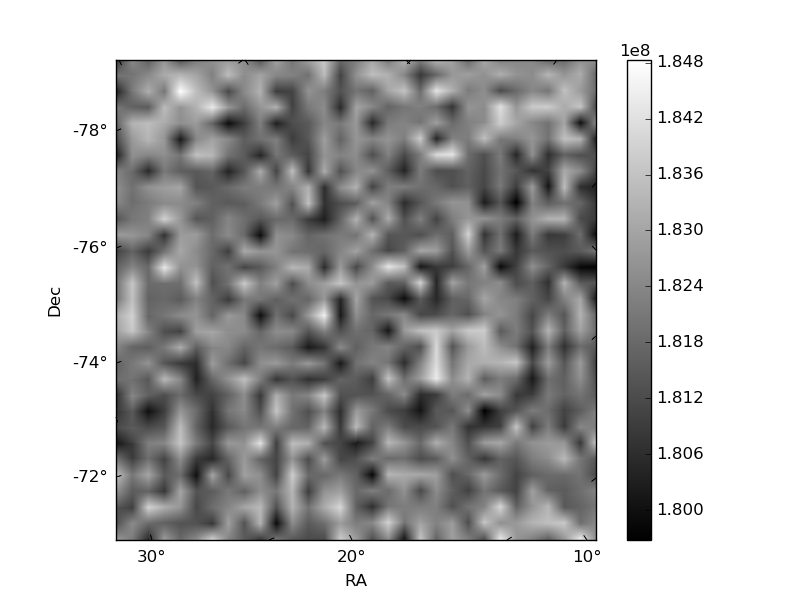
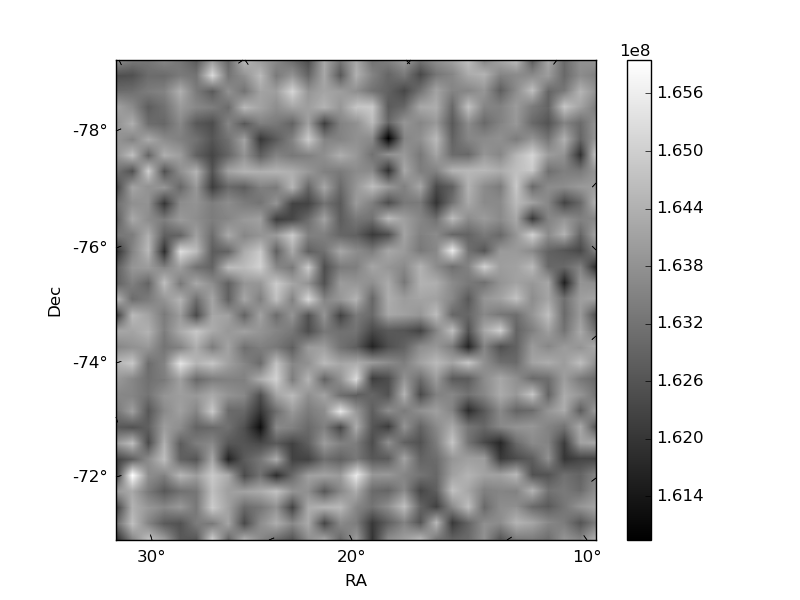
Quadrant B |
|---|---|---|---|
| Quadrant D | 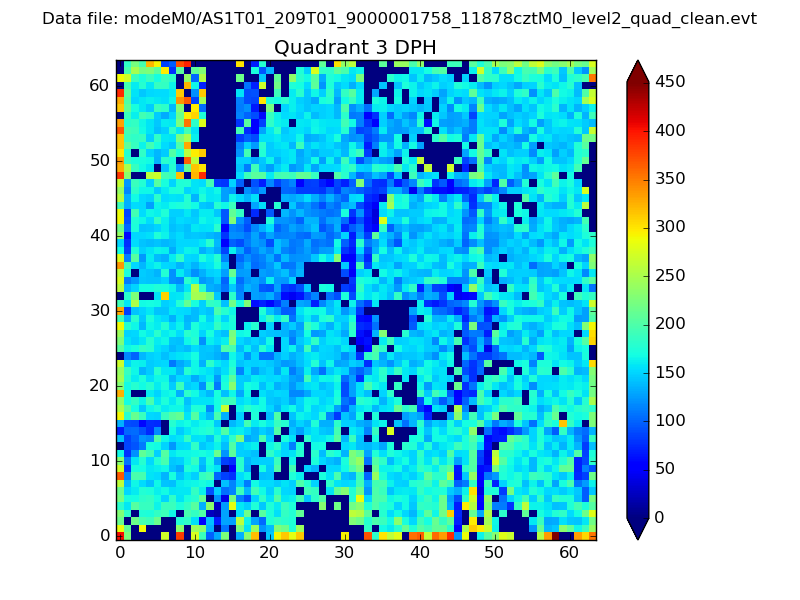 |
 |
Quadrant C |
| Plot type | Count rate plots | Images |
|---|---|---|
| Comparison with Poisson distribution Blue bars denote a histogram of data divided into 1 sec bins. Red curve is a Poisson curve with rate = median count rate of data. |
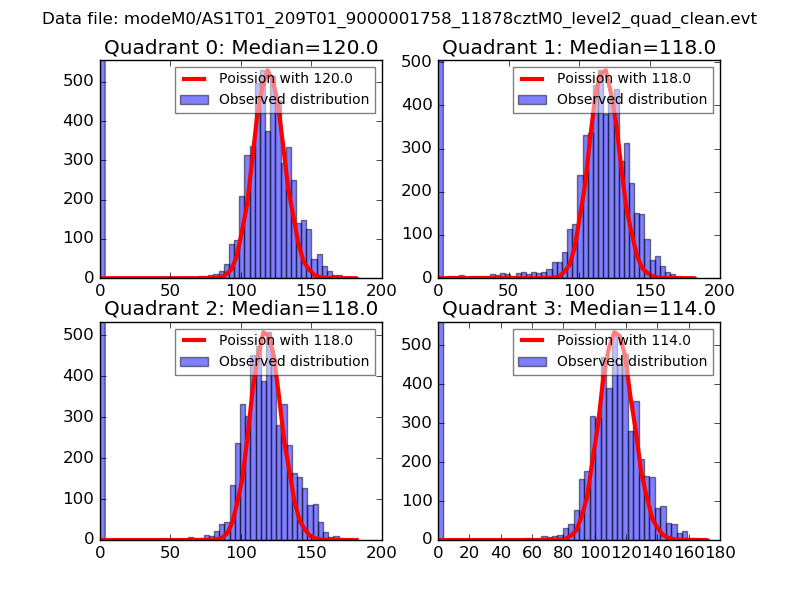 |
 |
| Quadrant-wise count rates Data is divided into 100 sec bins |
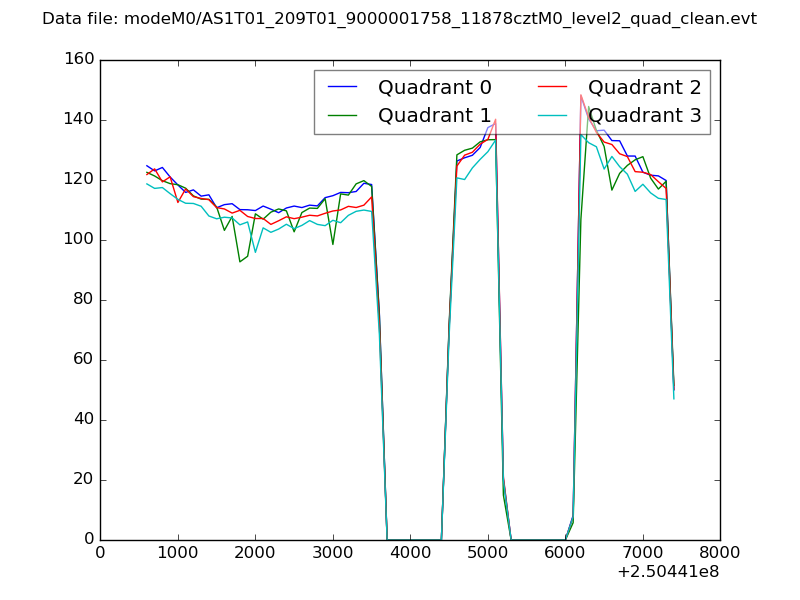 |
|
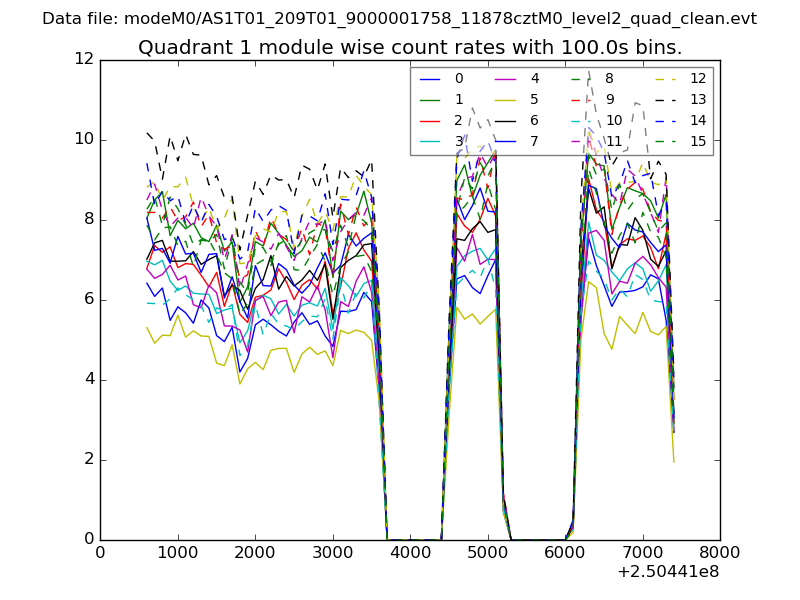
| Module-wise count rates for Quadrant A Data is divided into 100 sec bins |
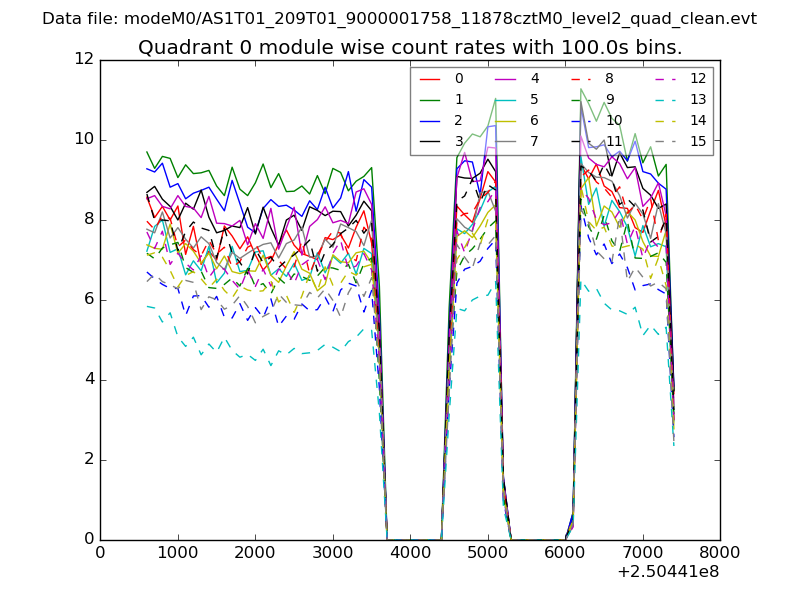 |
 |
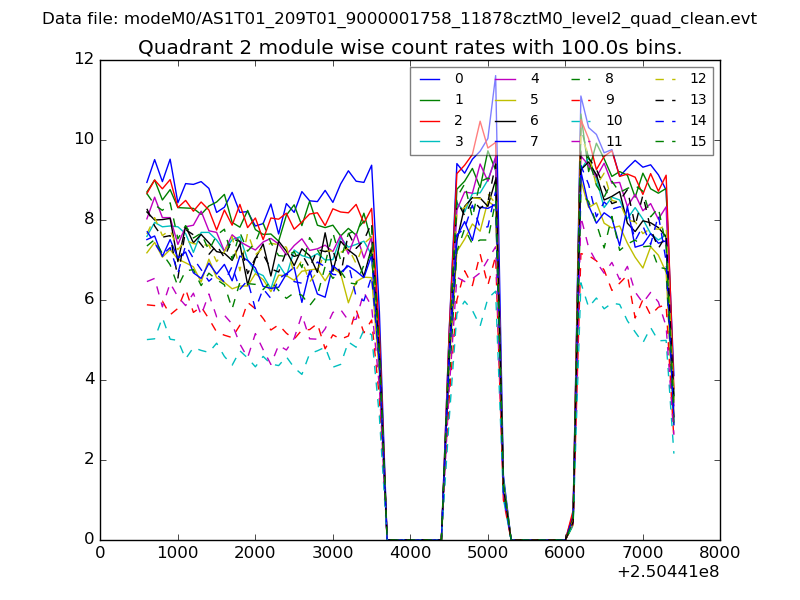
| Module-wise count rates for Quadrant B Data is divided into 100 sec bins |
 |
 |
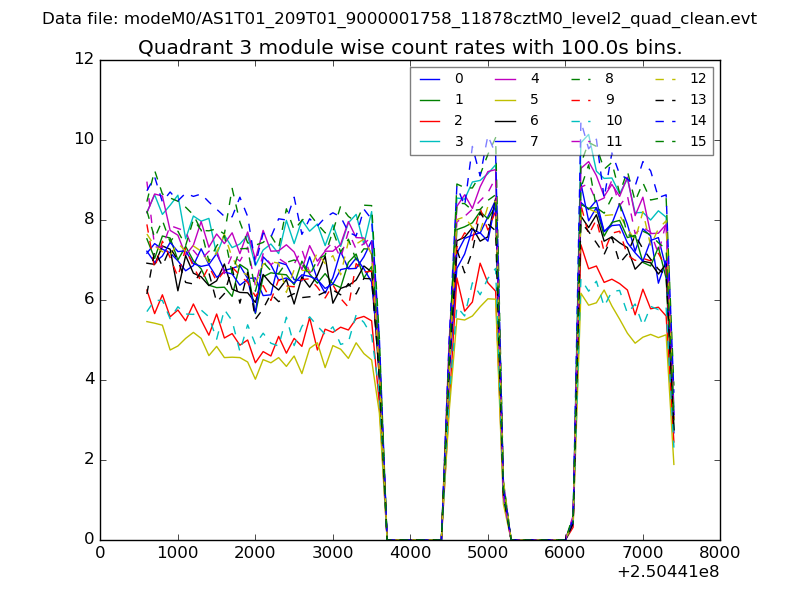
| Module-wise count rates for Quadrant C Data is divided into 100 sec bins |
 |
 |
| Module-wise count rates for Quadrant D Data is divided into 100 sec bins |
 |
 |
| Parameter | Plot |
|---|---|
| CZT HV Monitor | 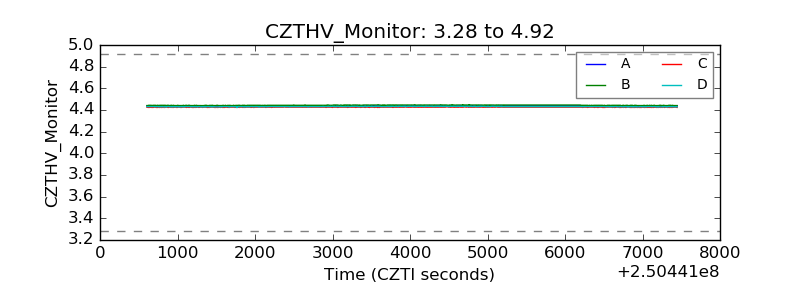 |
| D_VDD | 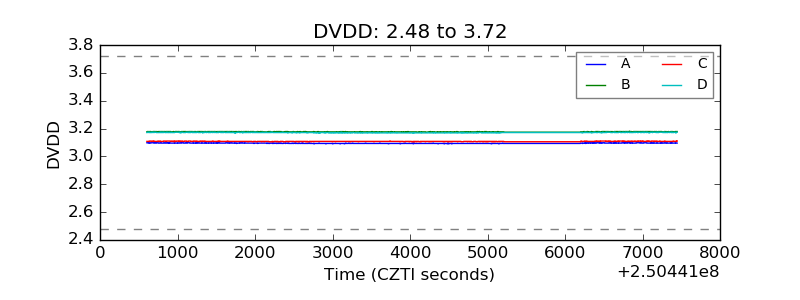 |
| Temperature 1 | 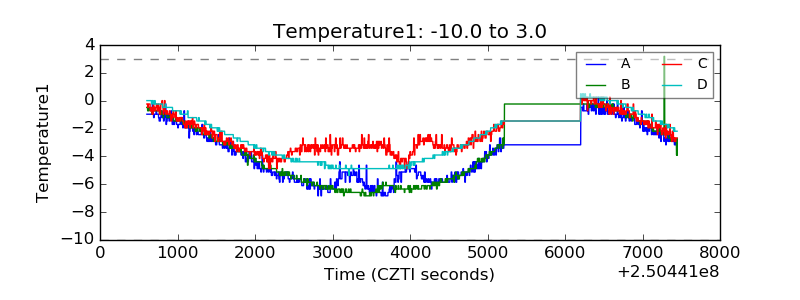 |
| Veto HV Monitor | 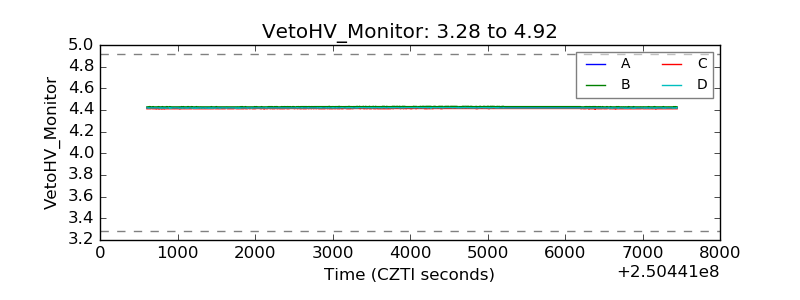 |
| Veto LLD | 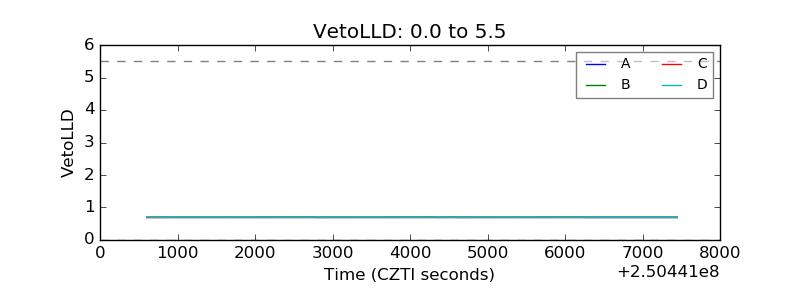 |
| Alpha Counter | 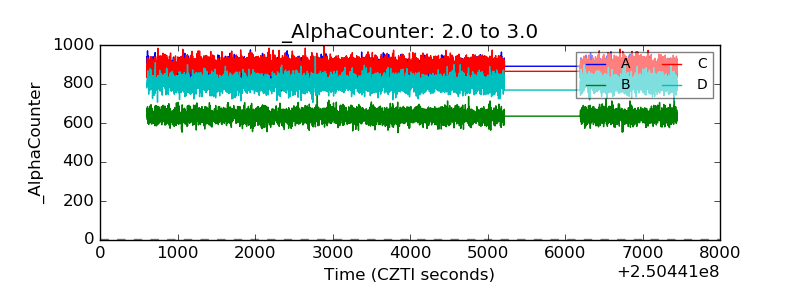 |
| _CPM_Rate | 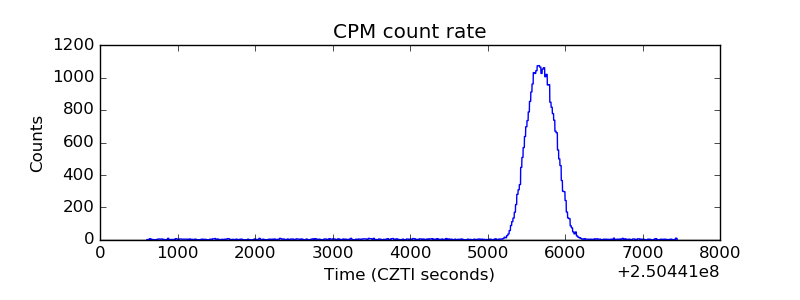 |
| CZT Counter | 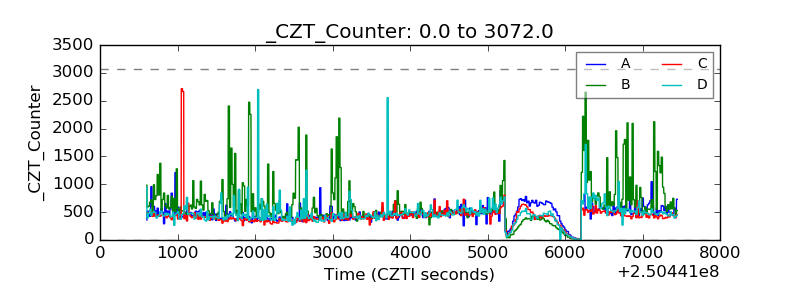 |
| +2.5 Volts monitor |  |
| +5 Volts monitor | 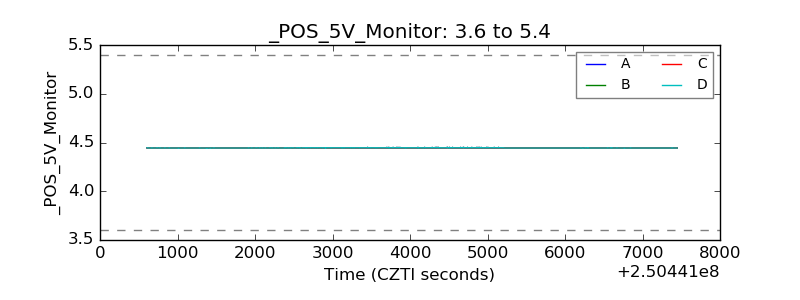 |
| _ROLL_ROT | 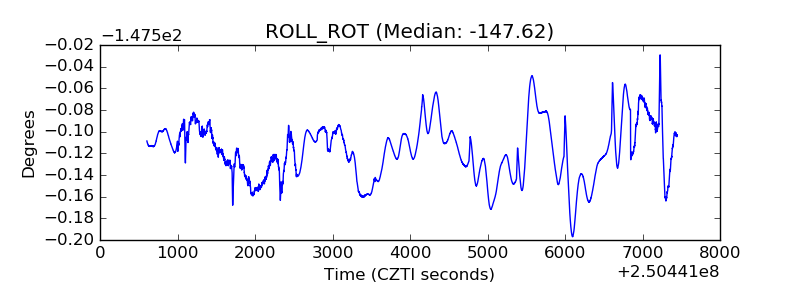 |
| _Roll_DEC | 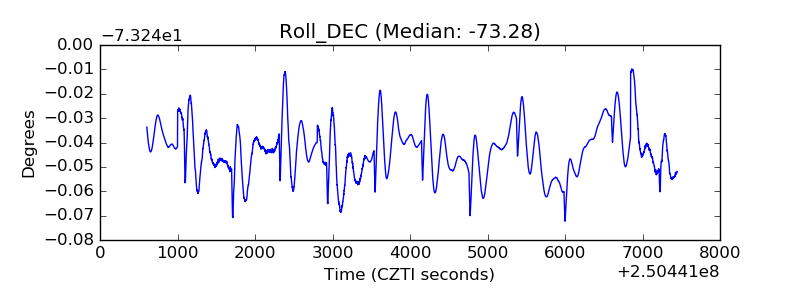 |
| _Roll_RA | 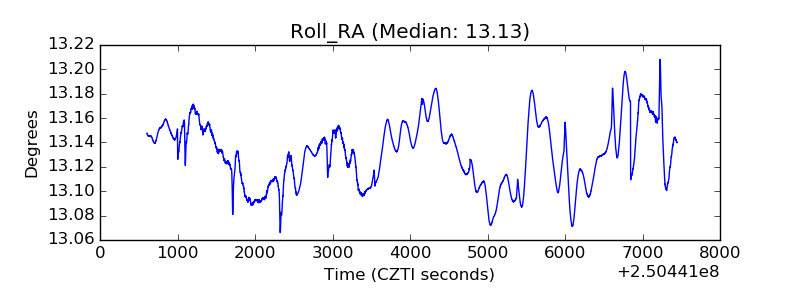 |
| Veto Counter | 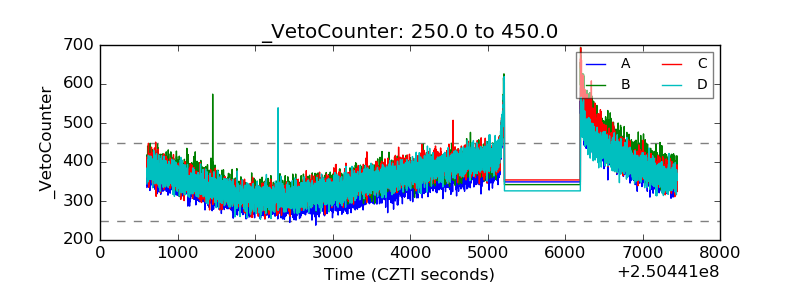 |