| Param | Original file | Final file |
|---|---|---|
| Filename | modeM0/AS1T01_209T01_9000001758_11881cztM0_level2.evt | modeM0/AS1T01_209T01_9000001758_11881cztM0_level2_quad_clean.evt |
| Size (bytes) | 457,093,440 | 105,909,120 |
| Size | 435.9 MB | 101.0 MB |
| Events in quadrant A | 3,371,407 | 703,520 |
| Events in quadrant B | 3,851,460 | 707,949 |
| Events in quadrant C | 2,822,982 | 695,932 |
| Events in quadrant D | 3,371,339 | 662,482 |
| Mode M0 | |||
|---|---|---|---|
| Quadrant | BADHDUFLAG | Total packets | Discarded packets |
| A | 0 | 14250 | 3 |
| B | 0 | 15675 | 2 |
| C | 0 | 12863 | 2 |
| D | 0 | 13987 | 2 |
| Mode SS | |||
|---|---|---|---|
| Quadrant | BADHDUFLAG | Total packets | Discarded packets |
| A | 0 | 128 | 0 |
| B | 0 | 128 | 0 |
| C | 0 | 128 | 0 |
| D | 0 | 128 | 0 |
| Mode M9 | |||
|---|---|---|---|
| Quadrant | BADHDUFLAG | Total packets | Discarded packets |
| A | 0 | 18 | 0 |
| B | 0 | 18 | 0 |
| C | 0 | 18 | 0 |
| D | 0 | 19 | 0 |
| Quadrant | Total seconds | Saturated seconds | Saturation percentage |
|---|---|---|---|
| A | 6268 | 58 | 0.925335% |
| B | 6268 | 188 | 2.999362% |
| C | 6268 | 26 | 0.414805% |
| D | 6268 | 34 | 0.542438% |
Noise dominated data is calculated using 1-second bins in cleaned event files. If a bin has >2000 counts, and if more than 50% of those come from <1% of pixels, then it is considered to be noise-dominated and hence unusable.
| Quadrant | # 1 sec bins | Bins with >0 counts | Bins with >2000 counts | High rate bins dominated by noise | Noise dominated (total time) | Noise dominated (detector-on time) | Marked lightcurve |
|---|---|---|---|---|---|---|---|
| A | 7494 | 6270 | 5 | 5 | 0.07% | 0.08% | 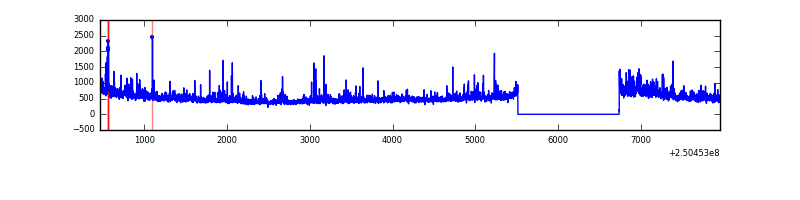 |
| B | 7494 | 6270 | 114 | 114 | 1.52% | 1.82% | 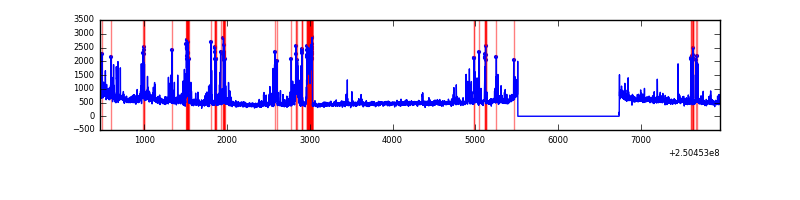 |
| C | 7494 | 6270 | 14 | 14 | 0.19% | 0.22% | 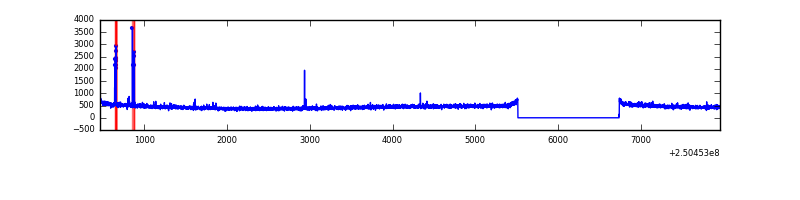 |
| D | 7494 | 6270 | 23 | 23 | 0.31% | 0.37% | 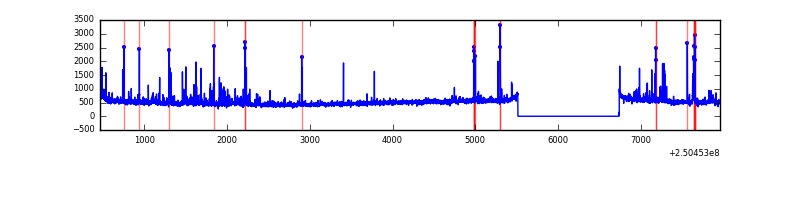 |
Top three noisy pixels from each quadrant. If the there are fewer than three noisy pixels in the level2.evt file, extra rows are filled as -1
| Pixel properties | Quadrant properties | ||||||
|---|---|---|---|---|---|---|---|
| Quadrant | DetID | PixID | Counts | Sigma | Mean | Median | Sigma |
| A | 8 | 15 | 189444 | 1258.24 | 740 | 725 | 150.0 |
| A | 1 | 162 | 100508 | 665.28 | 740 | 725 | 150.0 |
| A | 1 | 178 | 53219 | 349.99 | 740 | 725 | 150.0 |
| B | 4 | 239 | 699661 | 4984.66 | 742 | 725 | 140.2 |
| B | 15 | 204 | 152438 | 1081.98 | 742 | 725 | 140.2 |
| B | 3 | 209 | 20008 | 137.52 | 742 | 725 | 140.2 |
| C | 1 | 16 | 31512 | 187.59 | 711 | 713 | 164.2 |
| C | 0 | 207 | 16250 | 94.63 | 711 | 713 | 164.2 |
| C | 13 | 61 | 5387 | 28.47 | 711 | 713 | 164.2 |
| D | 8 | 195 | 408215 | 2388.75 | 703 | 683 | 170.6 |
| D | 13 | 249 | 74557 | 433.01 | 703 | 683 | 170.6 |
| D | 13 | 104 | 63086 | 365.78 | 703 | 683 | 170.6 |
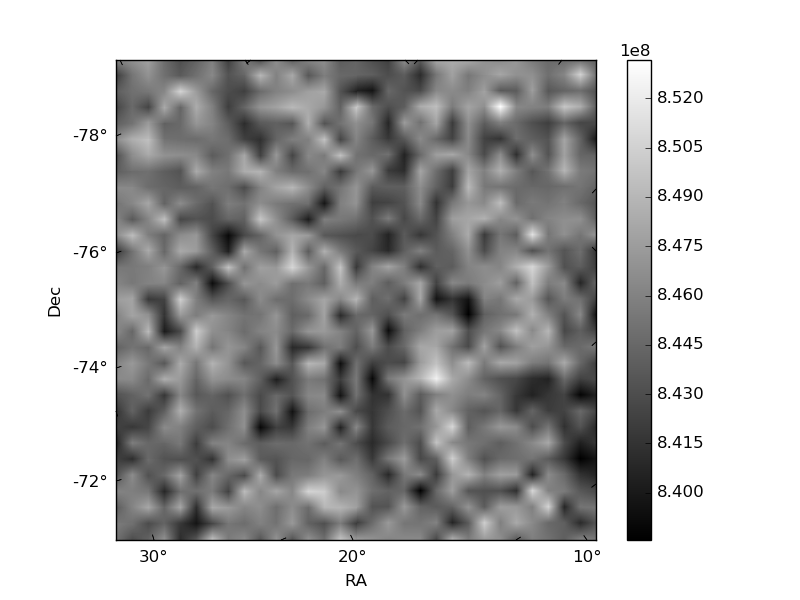
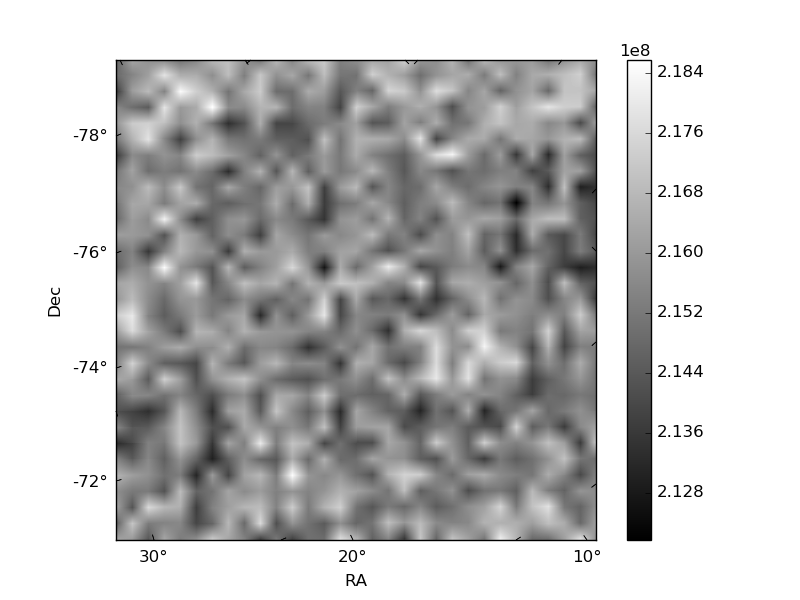
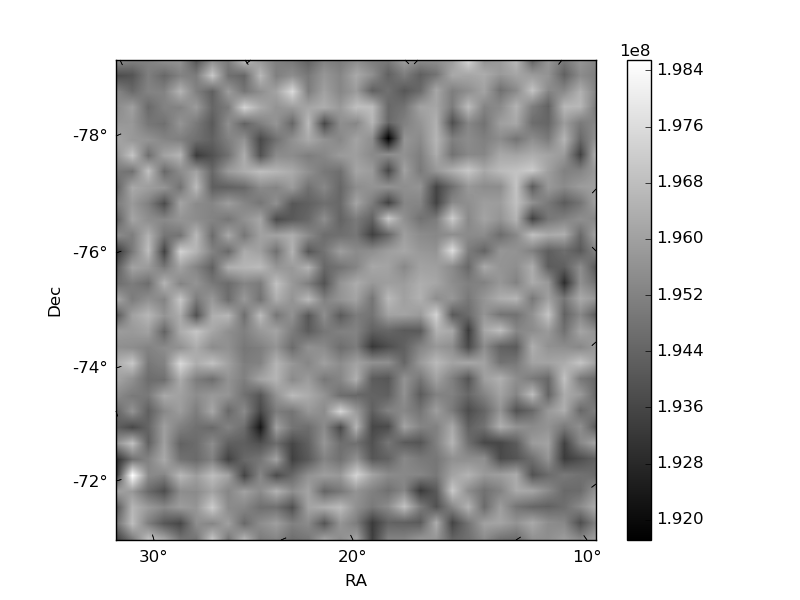
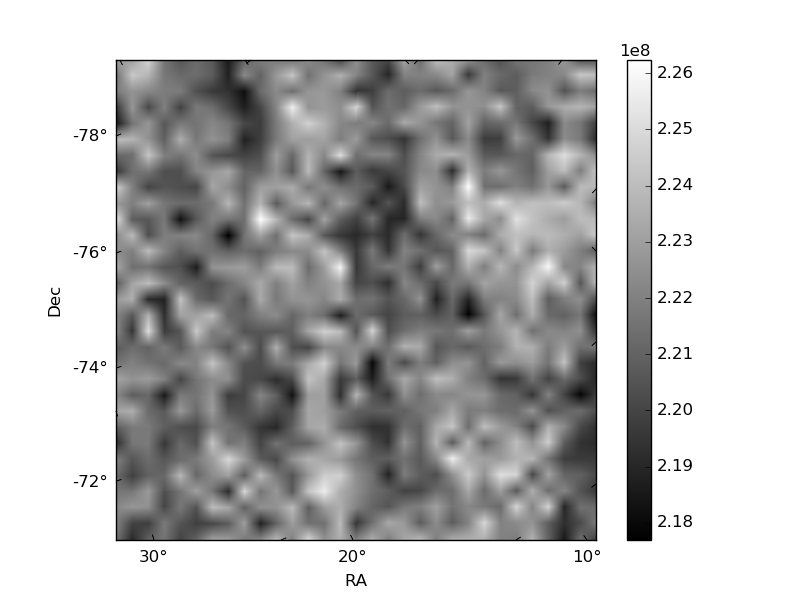
Histogram calculated using DETX and DETY for each event in the final _common_clean file
| Quadrant A | 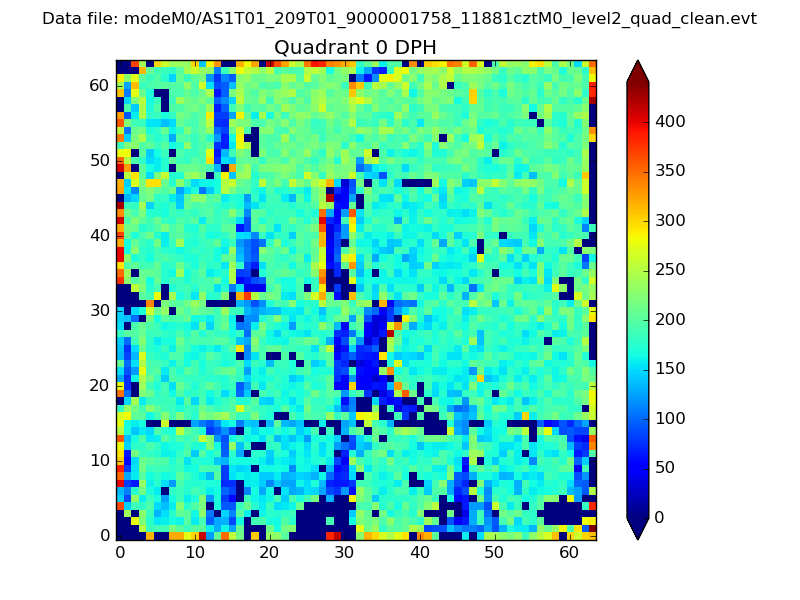 |
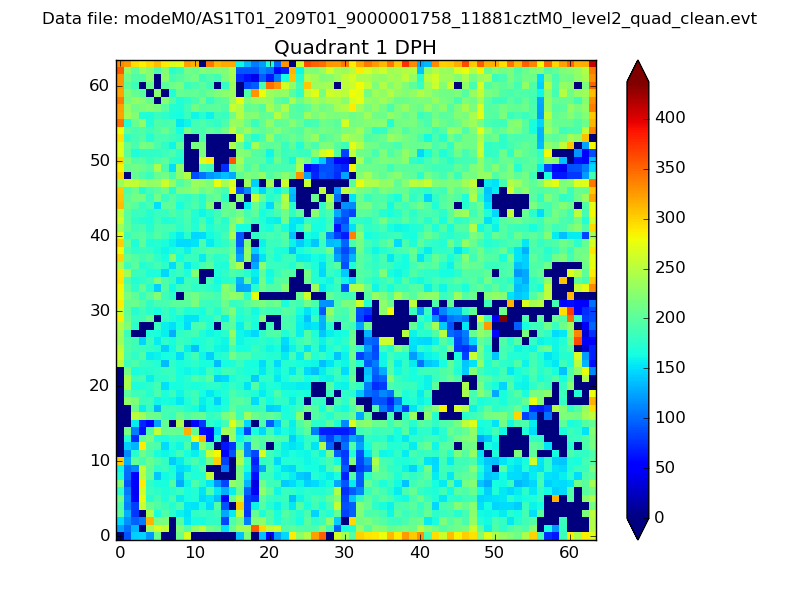 |
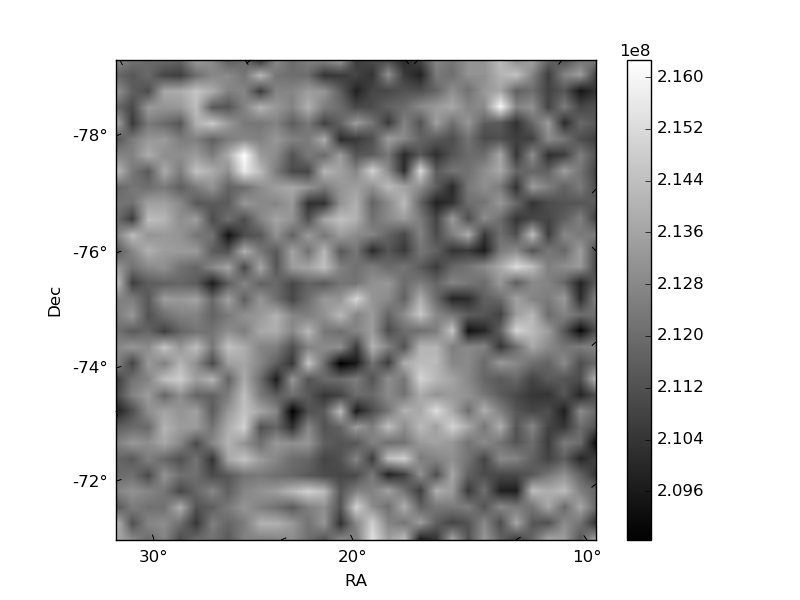
Quadrant B |
|---|---|---|---|
| Quadrant D | 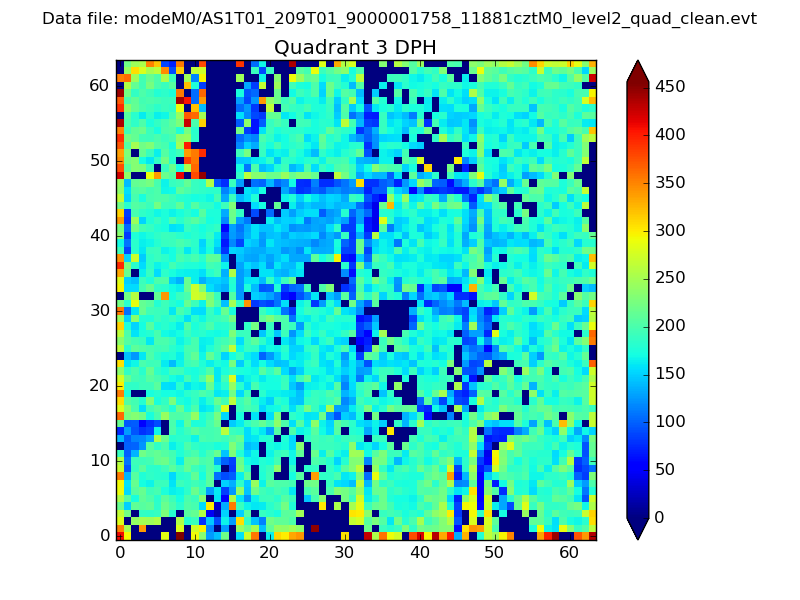 |
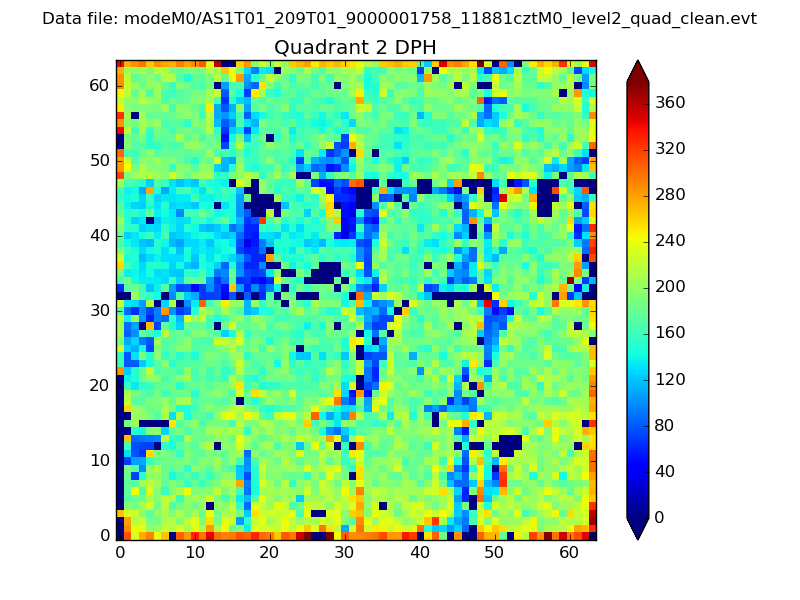 |
Quadrant C |
| Plot type | Count rate plots | Images |
|---|---|---|
| Comparison with Poisson distribution Blue bars denote a histogram of data divided into 1 sec bins. Red curve is a Poisson curve with rate = median count rate of data. |
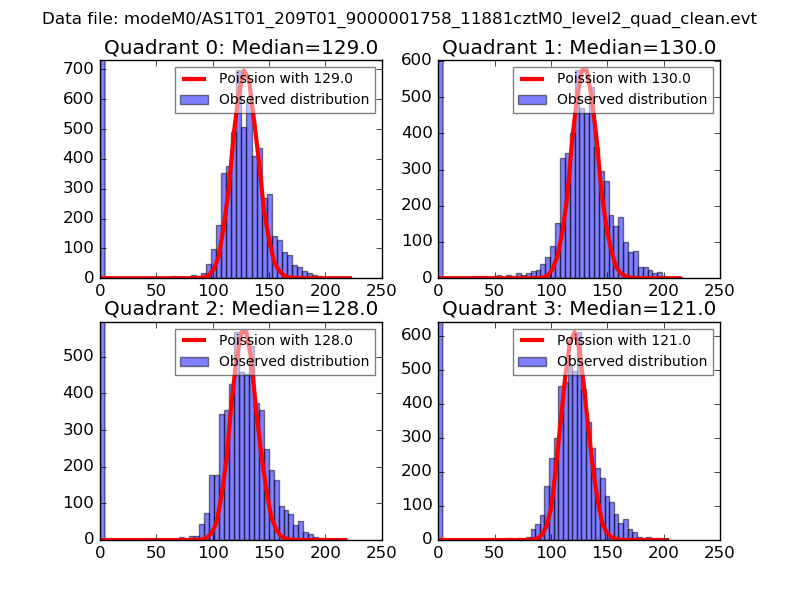 |
 |
| Quadrant-wise count rates Data is divided into 100 sec bins |
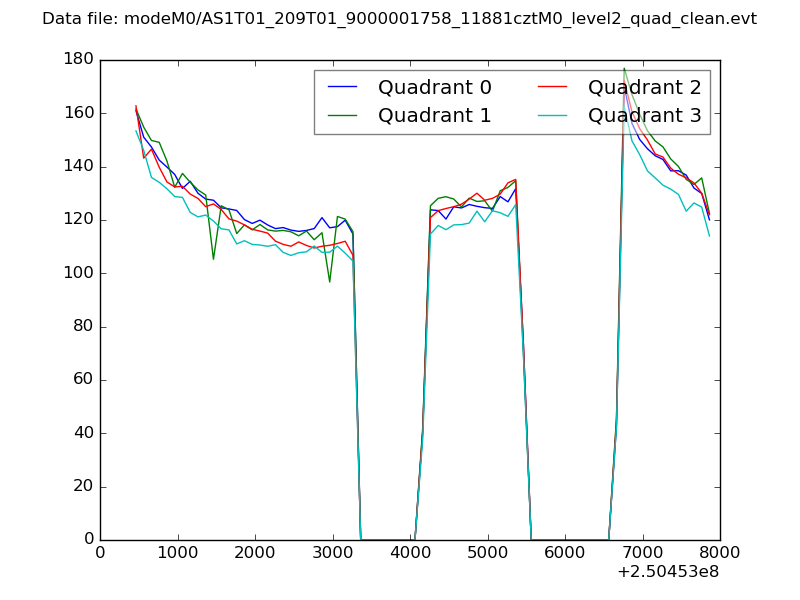 |
|
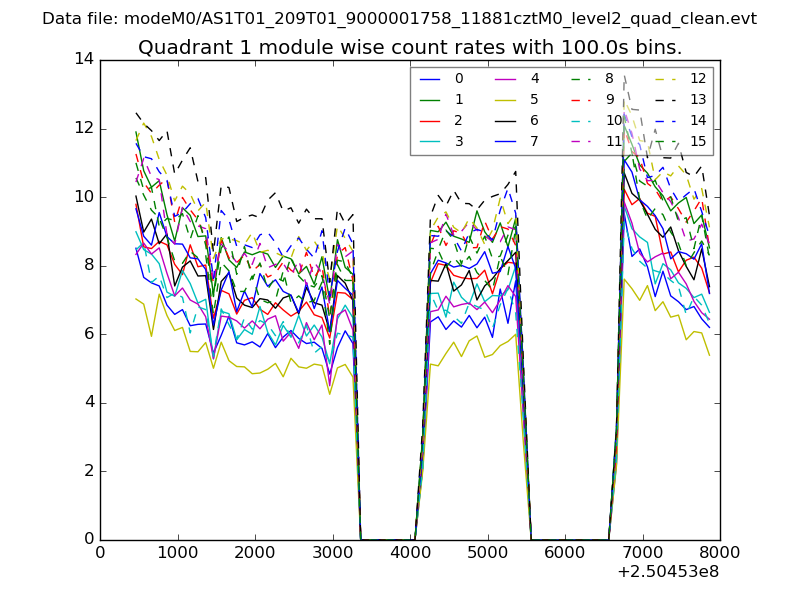
| Module-wise count rates for Quadrant A Data is divided into 100 sec bins |
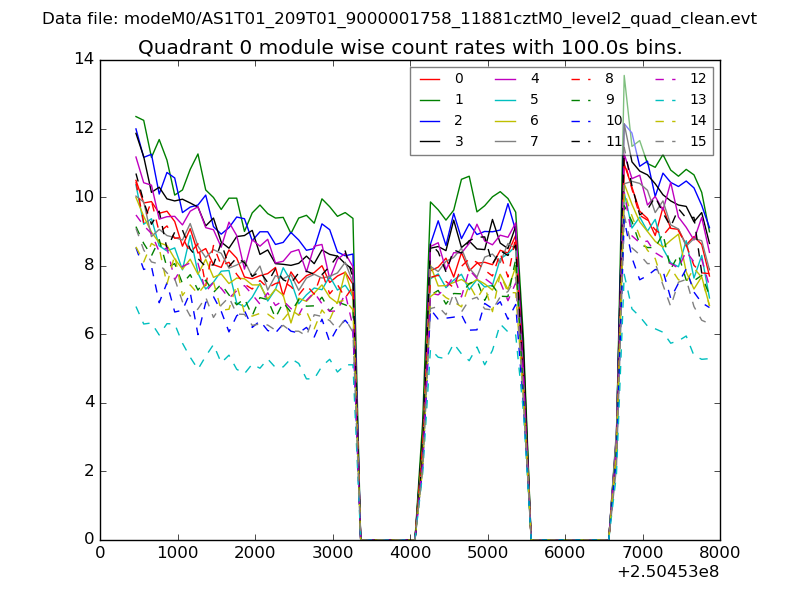 |
 |
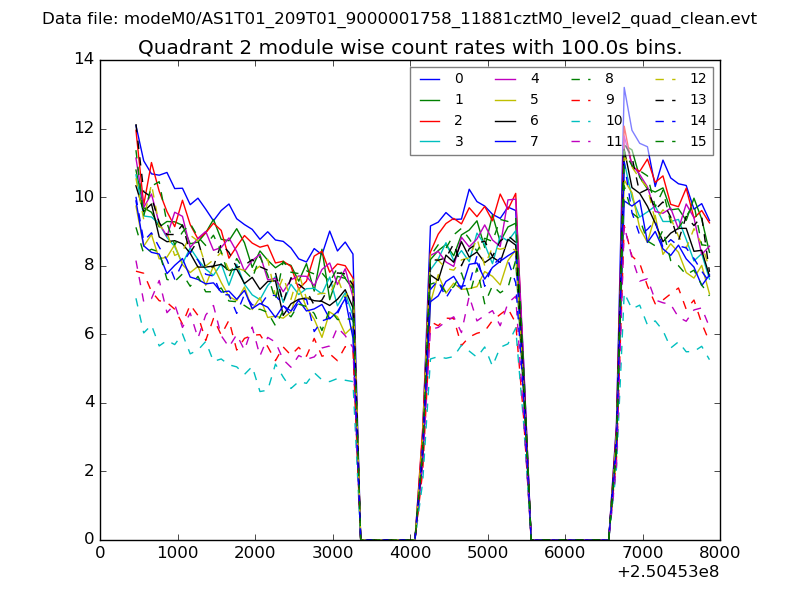
| Module-wise count rates for Quadrant B Data is divided into 100 sec bins |
 |
 |
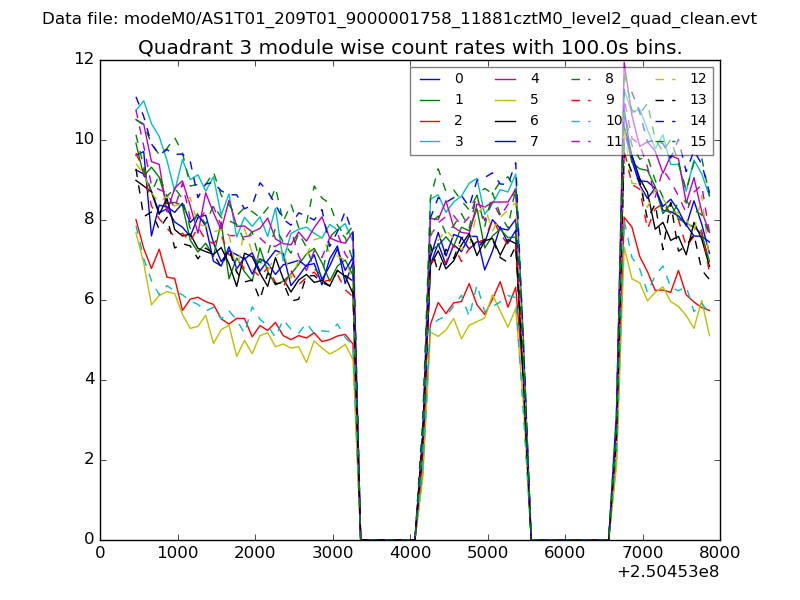
| Module-wise count rates for Quadrant C Data is divided into 100 sec bins |
 |
 |
| Module-wise count rates for Quadrant D Data is divided into 100 sec bins |
 |
 |
| Parameter | Plot |
|---|---|
| CZT HV Monitor | 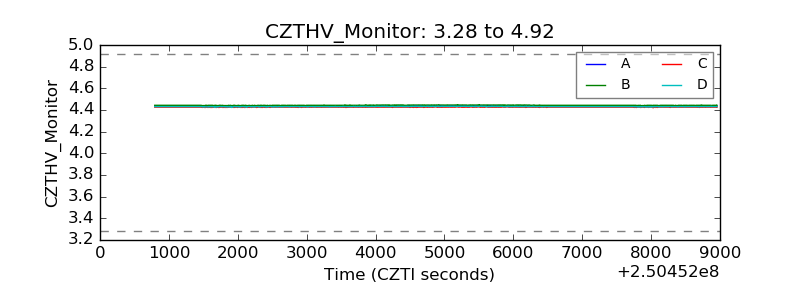 |
| D_VDD | 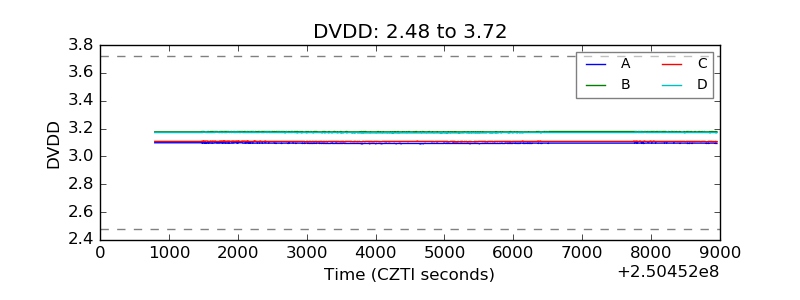 |
| Temperature 1 | 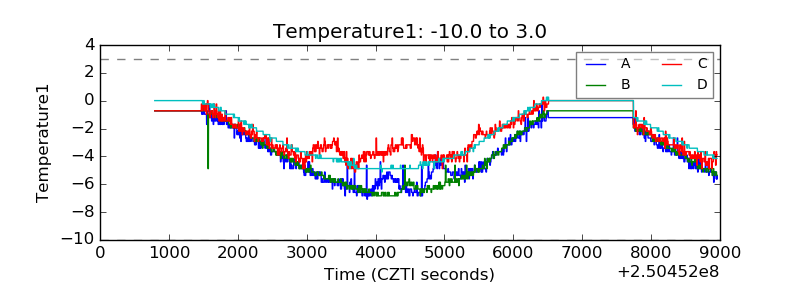 |
| Veto HV Monitor | 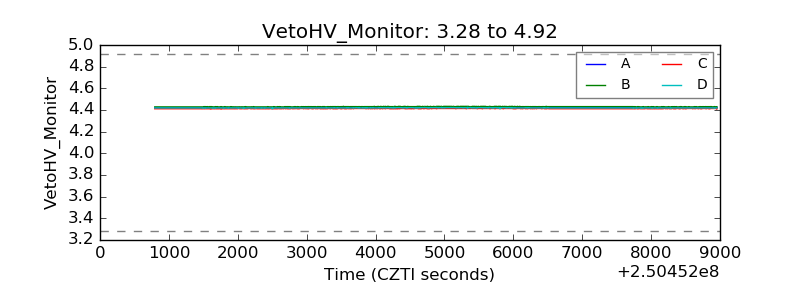 |
| Veto LLD | 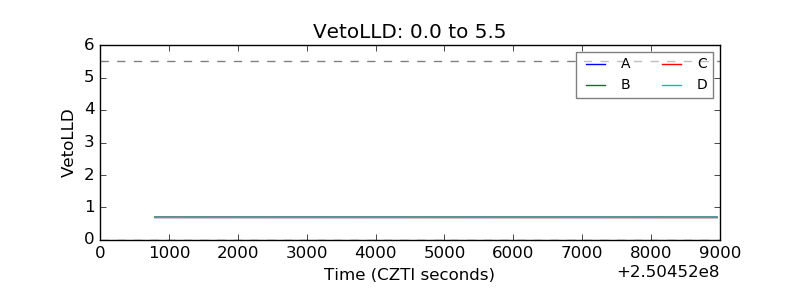 |
| Alpha Counter | 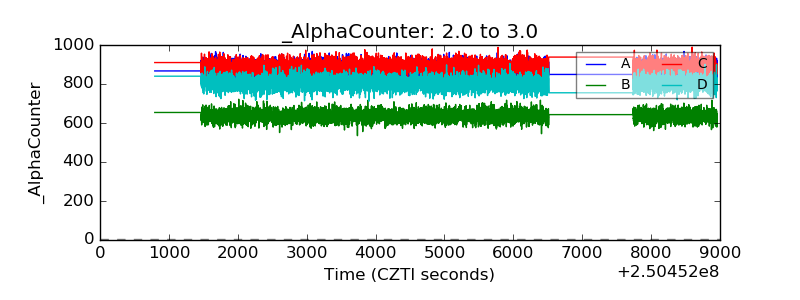 |
| _CPM_Rate | 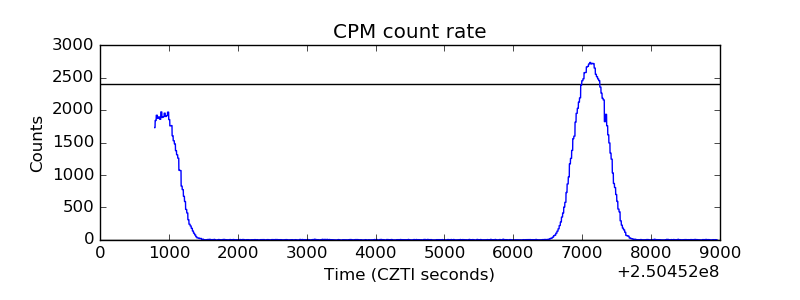 |
| CZT Counter | 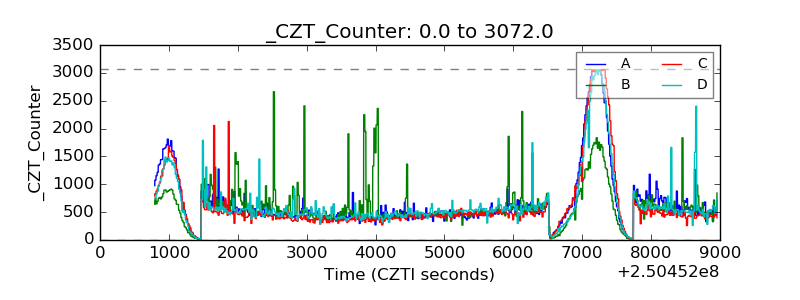 |
| +2.5 Volts monitor | 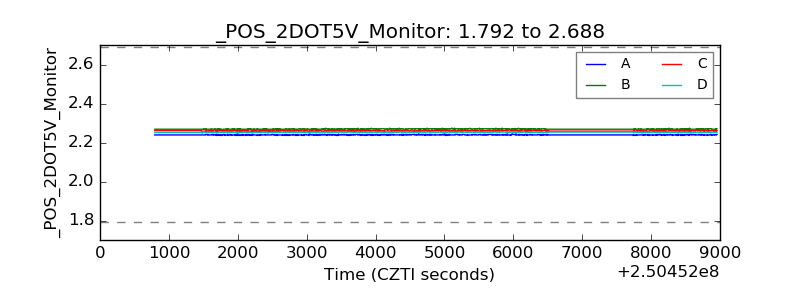 |
| +5 Volts monitor |  |
| _ROLL_ROT | 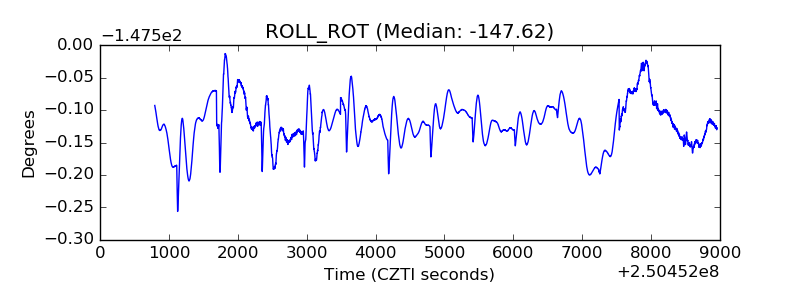 |
| _Roll_DEC | 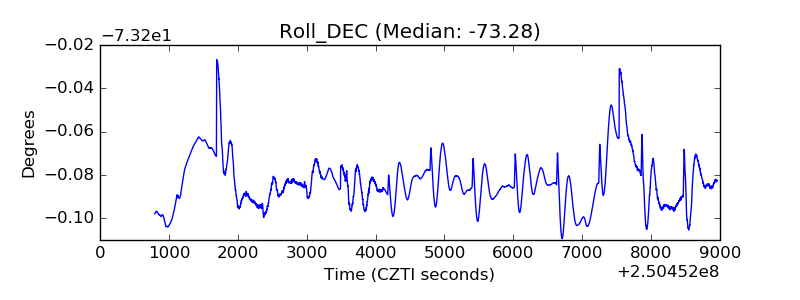 |
| _Roll_RA | 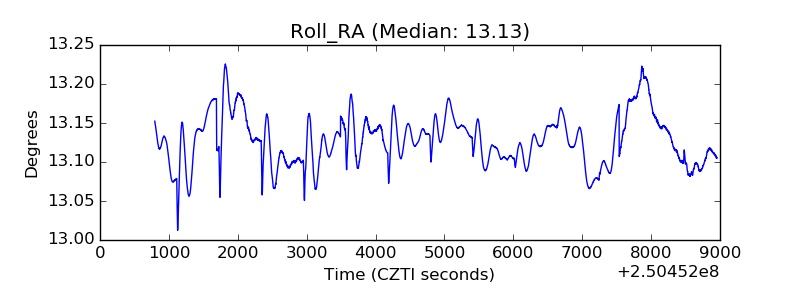 |
| Veto Counter | 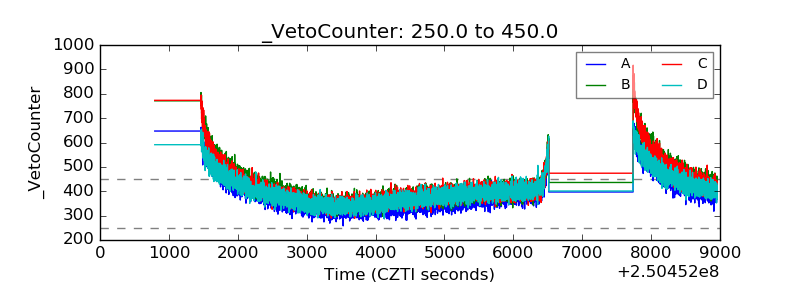 |