| Param | Original file | Final file |
|---|---|---|
| Filename | modeM0/AS1T01_209T01_9000001758_11884cztM0_level2.evt | modeM0/AS1T01_209T01_9000001758_11884cztM0_level2_quad_clean.evt |
| Size (bytes) | 868,415,040 | 191,520,000 |
| Size | 828.2 MB | 182.6 MB |
| Events in quadrant A | 6,097,772 | 1,260,388 |
| Events in quadrant B | 7,798,638 | 1,279,165 |
| Events in quadrant C | 5,254,831 | 1,274,142 |
| Events in quadrant D | 6,378,464 | 1,199,475 |
| Mode M0 | |||
|---|---|---|---|
| Quadrant | BADHDUFLAG | Total packets | Discarded packets |
| A | 0 | 25466 | 4 |
| B | 0 | 30564 | 3 |
| C | 0 | 23146 | 3 |
| D | 0 | 26219 | 3 |
| Mode SS | |||
|---|---|---|---|
| Quadrant | BADHDUFLAG | Total packets | Discarded packets |
| A | 0 | 234 | 0 |
| B | 0 | 234 | 0 |
| C | 0 | 234 | 0 |
| D | 0 | 234 | 0 |
| Mode M9 | |||
|---|---|---|---|
| Quadrant | BADHDUFLAG | Total packets | Discarded packets |
| A | 0 | 36 | 0 |
| B | 0 | 36 | 0 |
| C | 0 | 36 | 0 |
| D | 0 | 37 | 0 |
| Quadrant | Total seconds | Saturated seconds | Saturation percentage |
|---|---|---|---|
| A | 11380 | 88 | 0.773286% |
| B | 11380 | 724 | 6.362039% |
| C | 11380 | 22 | 0.193322% |
| D | 11380 | 80 | 0.702988% |
Noise dominated data is calculated using 1-second bins in cleaned event files. If a bin has >2000 counts, and if more than 50% of those come from <1% of pixels, then it is considered to be noise-dominated and hence unusable.
| Quadrant | # 1 sec bins | Bins with >0 counts | Bins with >2000 counts | High rate bins dominated by noise | Noise dominated (total time) | Noise dominated (detector-on time) | Marked lightcurve |
|---|---|---|---|---|---|---|---|
| A | 14056 | 11383 | 13 | 13 | 0.09% | 0.11% | 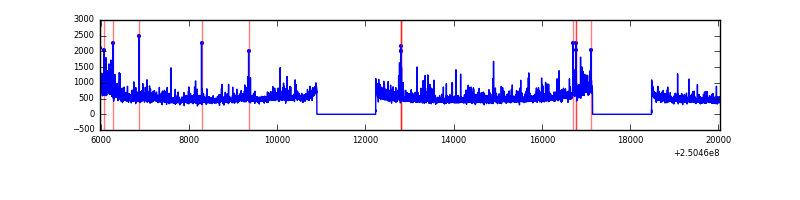 |
| B | 14056 | 11383 | 466 | 466 | 3.32% | 4.09% | 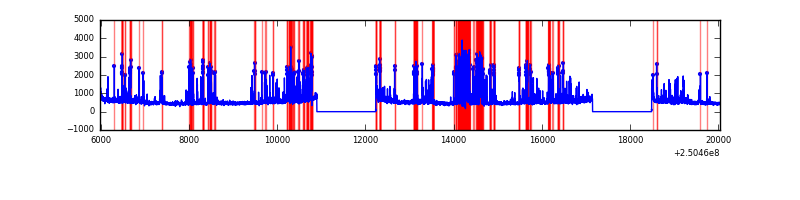 |
| C | 14056 | 11383 | 1 | 1 | 0.01% | 0.01% | 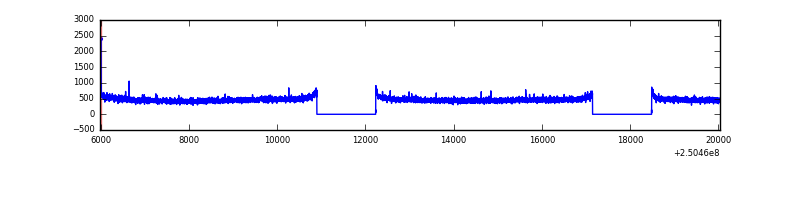 |
| D | 14056 | 11383 | 58 | 58 | 0.41% | 0.51% | 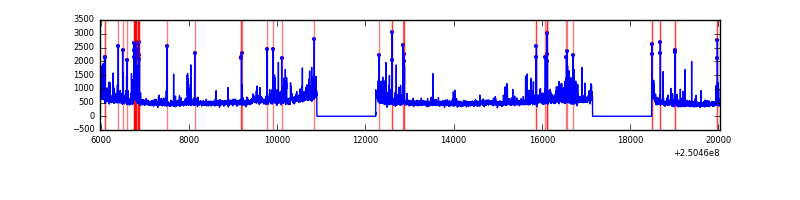 |
Top three noisy pixels from each quadrant. If the there are fewer than three noisy pixels in the level2.evt file, extra rows are filled as -1
| Pixel properties | Quadrant properties | ||||||
|---|---|---|---|---|---|---|---|
| Quadrant | DetID | PixID | Counts | Sigma | Mean | Median | Sigma |
| A | 8 | 15 | 318670 | 1171.79 | 1359 | 1336 | 270.8 |
| A | 1 | 162 | 185807 | 681.18 | 1359 | 1336 | 270.8 |
| A | 1 | 178 | 95143 | 346.39 | 1359 | 1336 | 270.8 |
| B | 4 | 239 | 1312027 | 5298.46 | 1349 | 1319 | 247.4 |
| B | 3 | 64 | 794079 | 3204.68 | 1349 | 1319 | 247.4 |
| B | 15 | 204 | 194979 | 782.86 | 1349 | 1319 | 247.4 |
| C | 13 | 61 | 10271 | 29.22 | 1343 | 1348 | 305.4 |
| C | 1 | 16 | 8383 | 23.03 | 1343 | 1348 | 305.4 |
| C | 12 | 4 | 4835 | 11.42 | 1343 | 1348 | 305.4 |
| D | 8 | 195 | 687048 | 2195.19 | 1319 | 1286 | 312.4 |
| D | 13 | 104 | 152860 | 485.2 | 1319 | 1286 | 312.4 |
| D | 13 | 249 | 99280 | 313.69 | 1319 | 1286 | 312.4 |
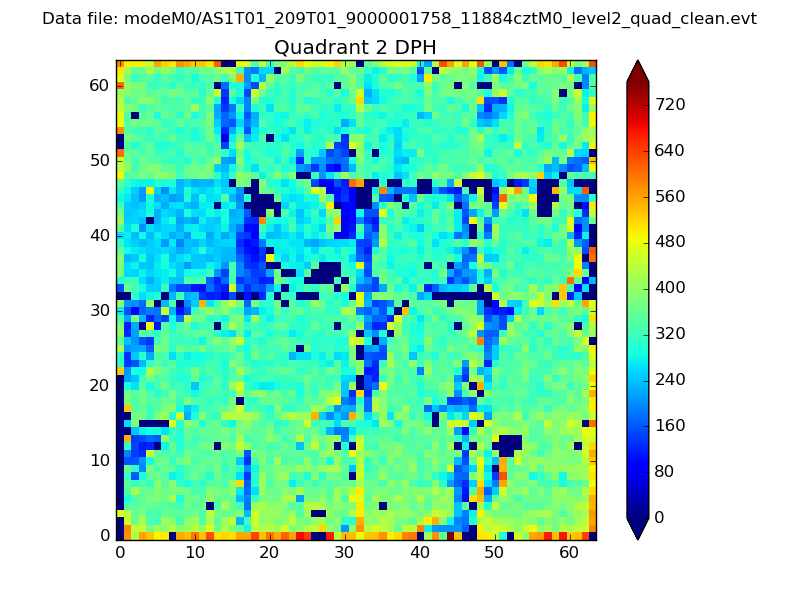
Histogram calculated using DETX and DETY for each event in the final _common_clean file
| Quadrant A | 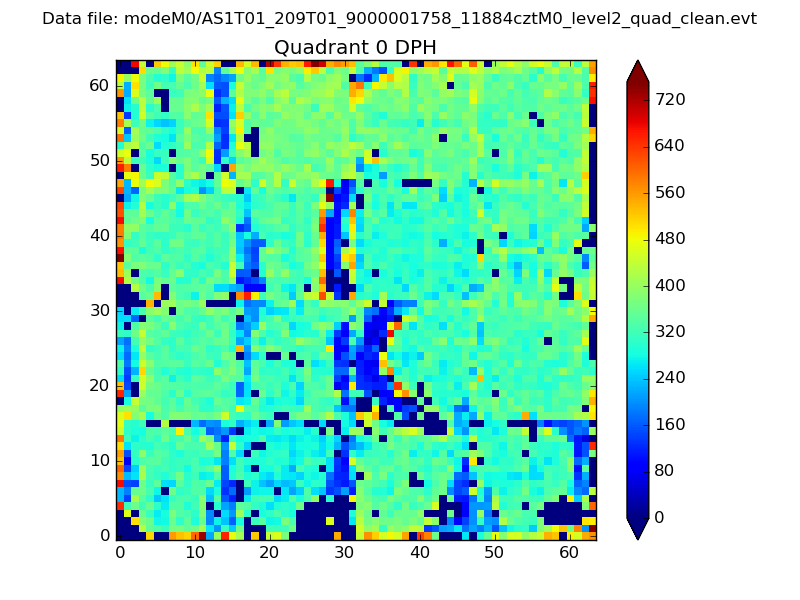 |
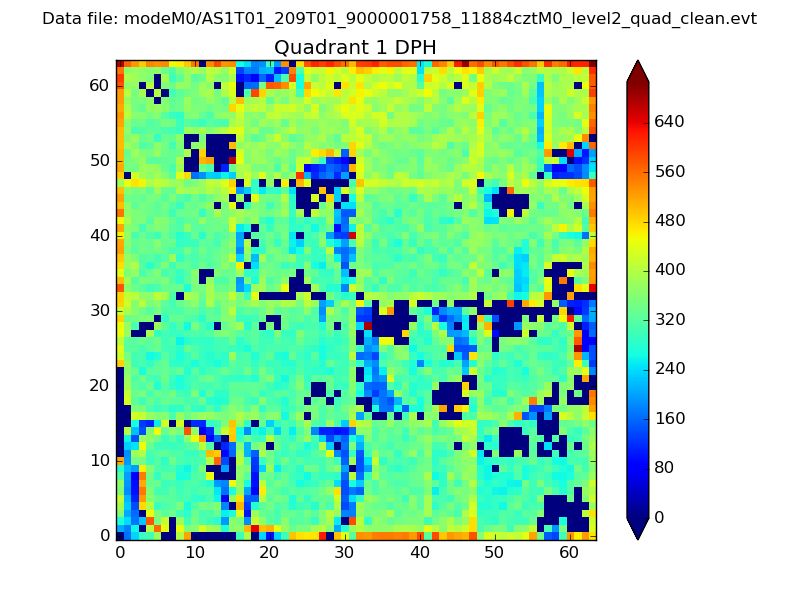 |
Quadrant B |
|---|---|---|---|
| Quadrant D | 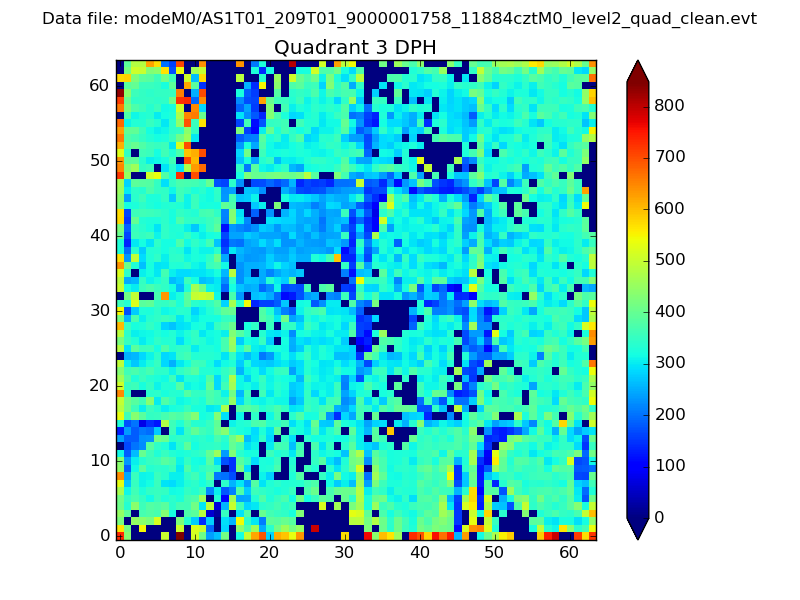 |
 |
Quadrant C |
| Plot type | Count rate plots | Images |
|---|---|---|
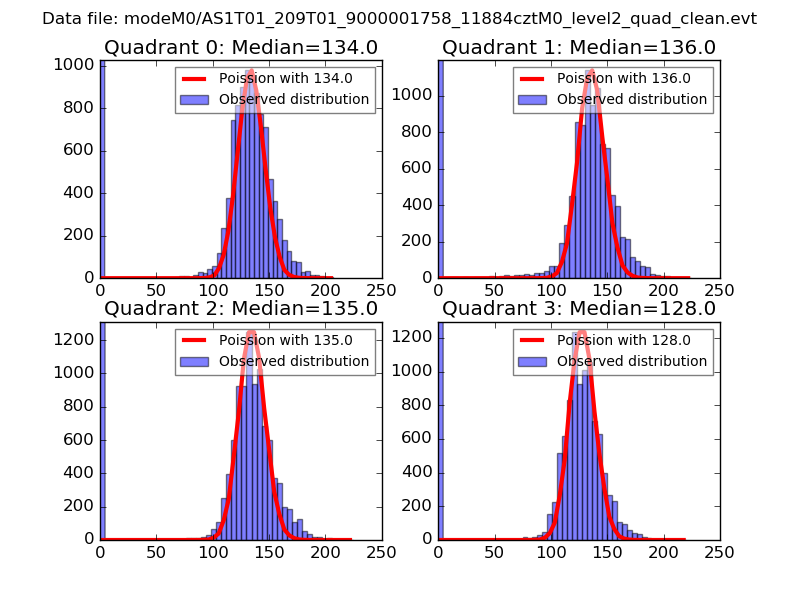
| Comparison with Poisson distribution Blue bars denote a histogram of data divided into 1 sec bins. Red curve is a Poisson curve with rate = median count rate of data. |
 |
 |
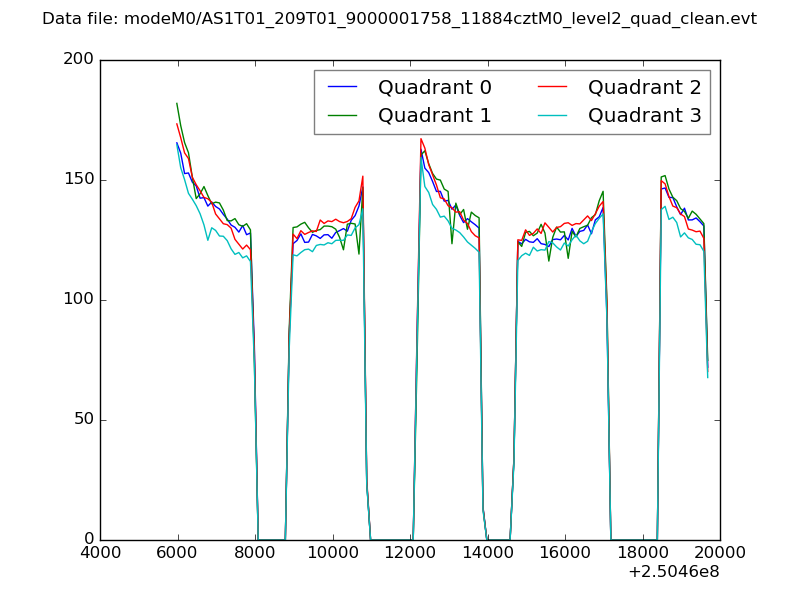
| Quadrant-wise count rates Data is divided into 100 sec bins |
 |
|
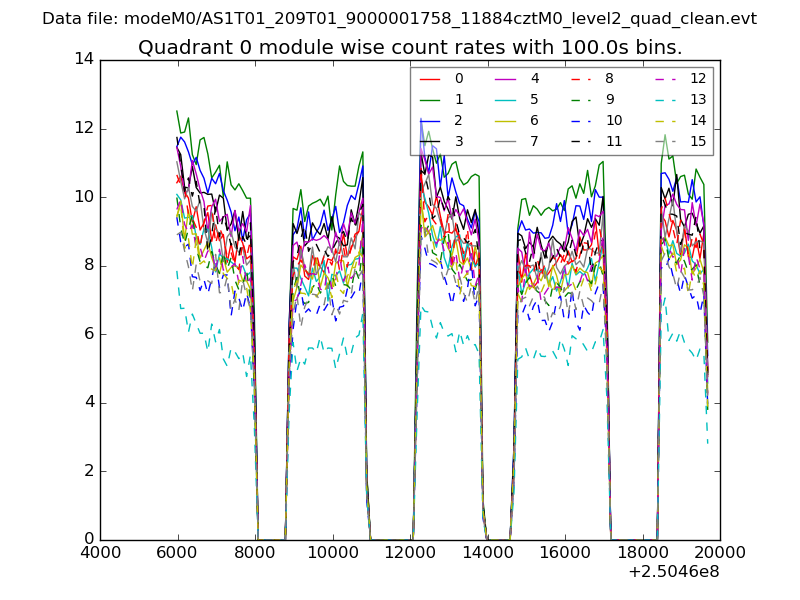
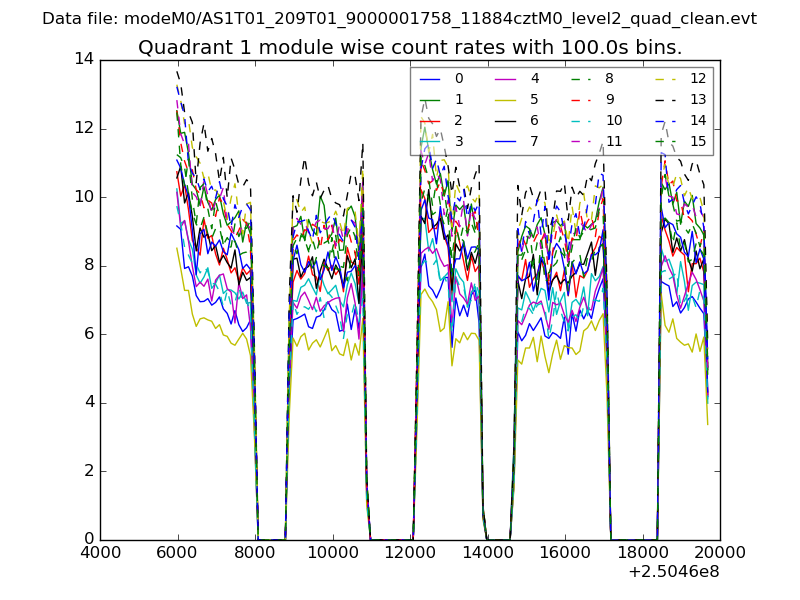
| Module-wise count rates for Quadrant A Data is divided into 100 sec bins |
 |
 |
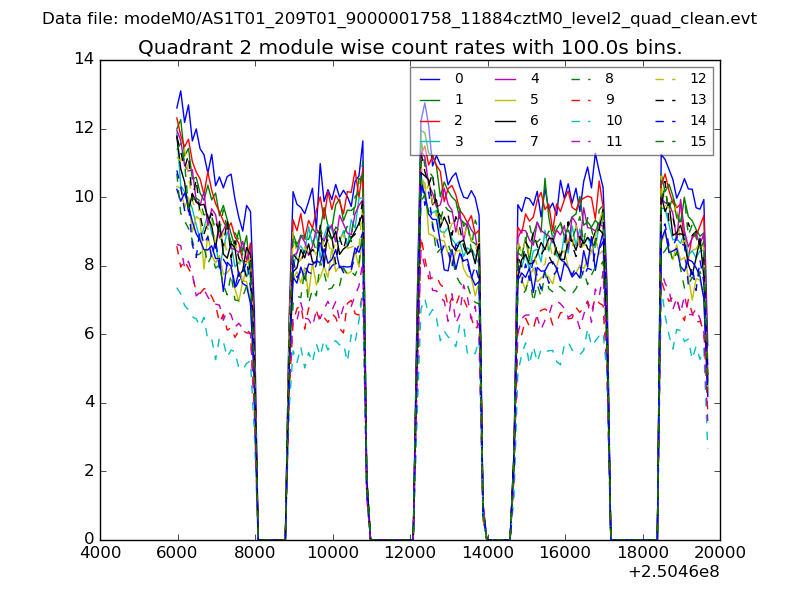
| Module-wise count rates for Quadrant B Data is divided into 100 sec bins |
 |
 |
| Module-wise count rates for Quadrant C Data is divided into 100 sec bins |
 |
 |
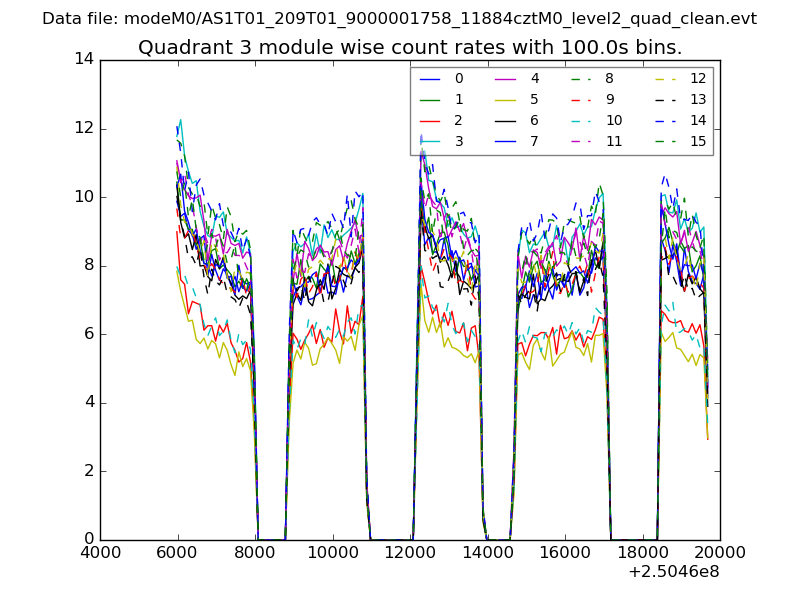
| Module-wise count rates for Quadrant D Data is divided into 100 sec bins |
 |
 |
| Parameter | Plot |
|---|---|
| CZT HV Monitor | 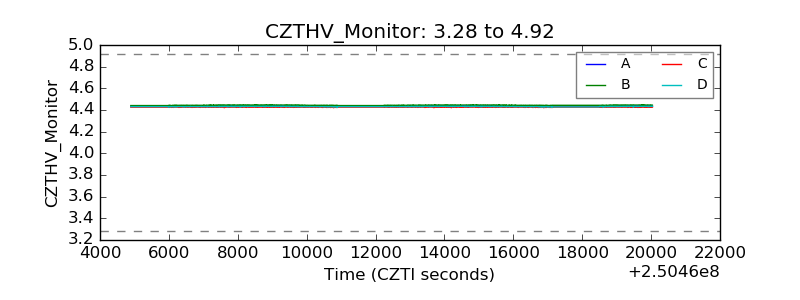 |
| D_VDD | 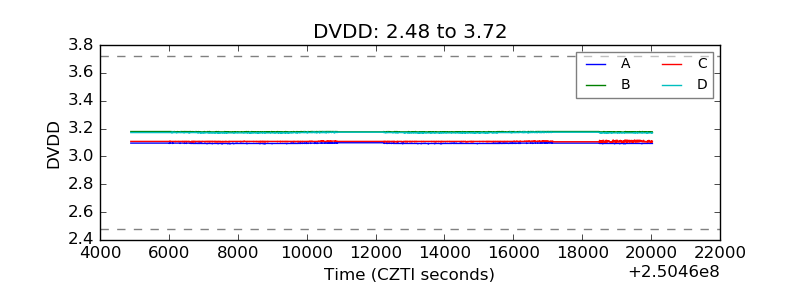 |
| Temperature 1 | 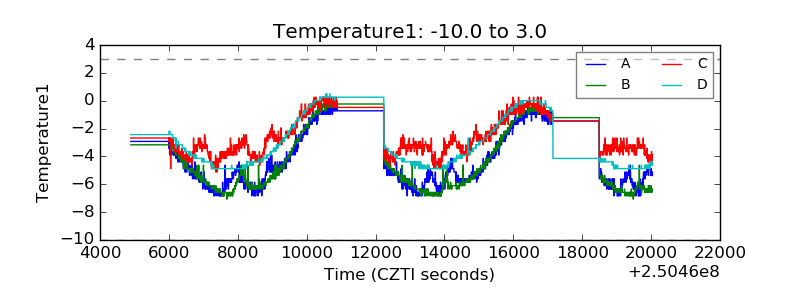 |
| Veto HV Monitor | 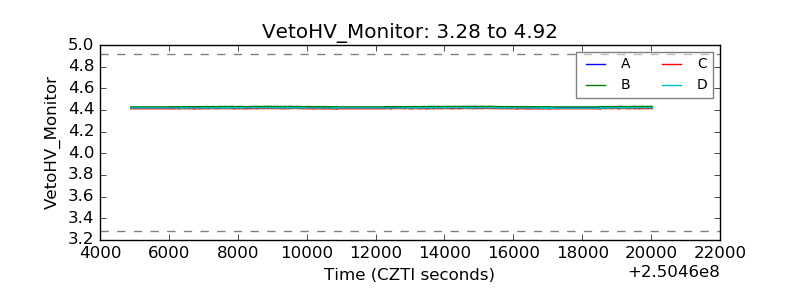 |
| Veto LLD | 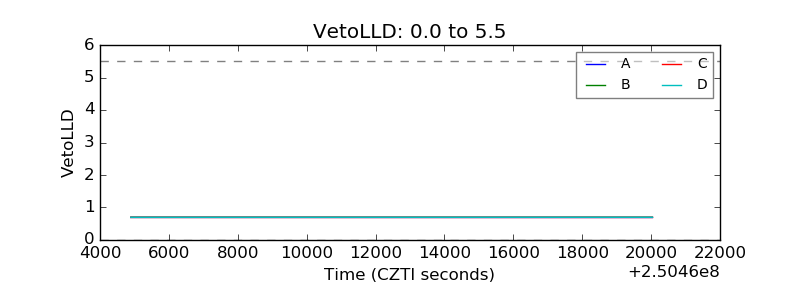 |
| Alpha Counter | 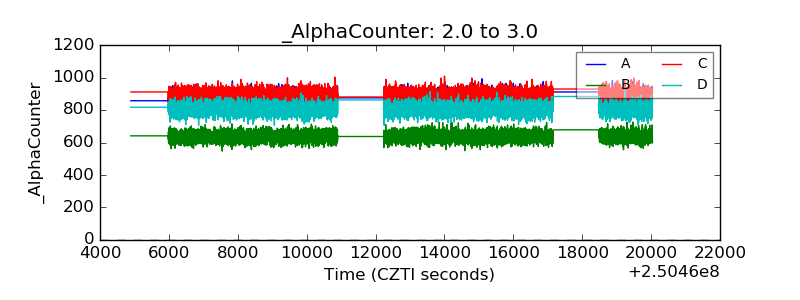 |
| _CPM_Rate | 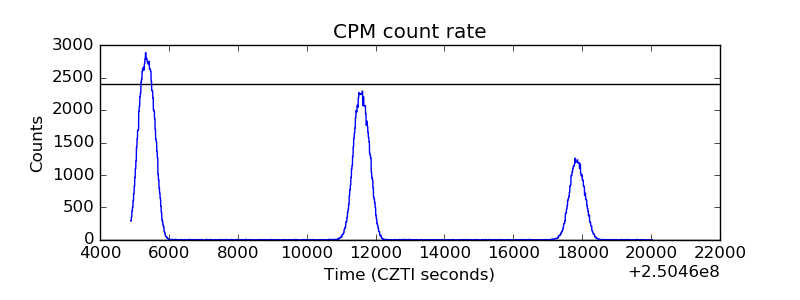 |
| CZT Counter | 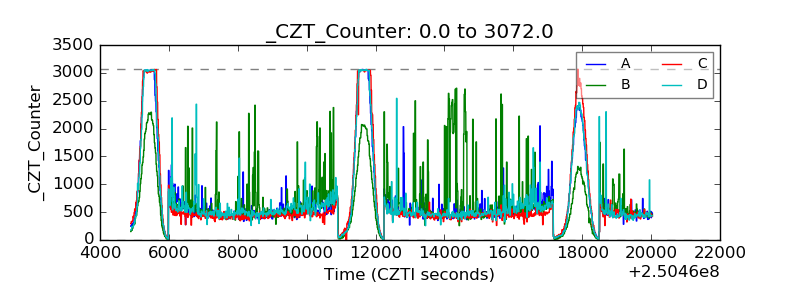 |
| +2.5 Volts monitor |  |
| +5 Volts monitor |  |
| _ROLL_ROT |  |
| _Roll_DEC | 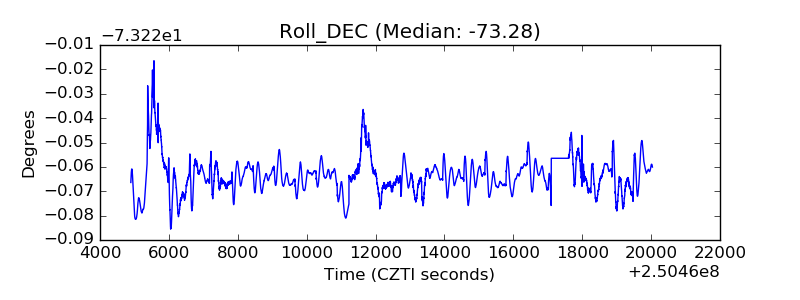 |
| _Roll_RA |  |
| Veto Counter | 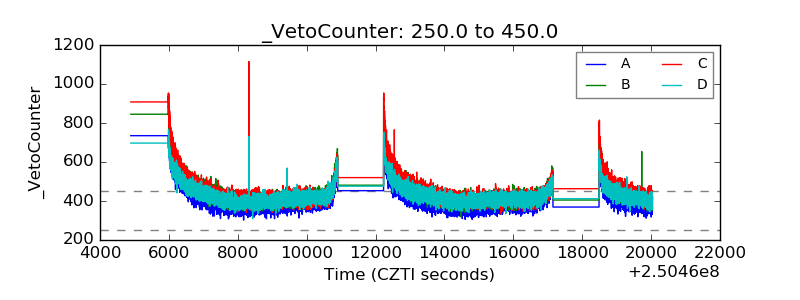 |